The precise mechanism of action of ECT remains unknown. One line of research has focused on the anticonvulsant properties of ECT, postulating that endogenous processes involved in the termination of seizures are critical to therapeutic mechanisms
(1). This research has included examination of change in seizure threshold during a course of ECT and in concentrations of inhibitory neurotransmitters
(2) and endogenous opioids
(3). Both bioelectric suppression immediately after seizure termination
(4) and the magnitude of delta activity in prefrontal regions in the interictal EEG
(5) have been associated with superior ECT outcome, suggesting that reductions in neural activity may be critical to efficacy. Finally, imaging studies consistently have found reductions of regional cerebral blood flow (rCBF) or regional cerebral metabolic rate after ECT, again pointing to suppression of functional brain activity
(6).
In a study that used the xenon inhalation technique, we previously found that post-ECT reductions in rCBF in prefrontal regions were associated with better clinical outcome
(7). Positron emission tomography (PET) offers the advantages of measurement of regional metabolism, superior spatial resolution, and the ability to image subcortical brain regions. We report on 10 patients with major depression who underwent [
18F]fluorodeoxyglucose (FDG) PET before and after a course of bilateral ECT.
Method
Ten inpatients (mean age=45.5 years, SD=12.3; seven female; six with unipolar depression; nine right-handed) who met DSM-III-R criteria for a major depressive episode on the basis of interviews with the Structured Clinical Interview for DSM-III-R–Patient Edition, and who had a score of at least 16 on the 17-item Hamilton Depression Rating Scale, were referred for ECT on clinical grounds. Patients were medication free for at least 2 weeks (6 weeks for fluoxetine and 4 weeks for oral neuroleptics) before baseline imaging and until completion of post-ECT assessments. After complete description of the study, written informed consent was obtained.
ECT was administered with a constant current, brief-pulse device. Medications at ECT were atropine (0.4 mg), methohexital (0.75 mg/kg), and succinylcholine (0.75 mg/kg), with dose adjustment after the first treatment. Motor and EEG seizure manifestations were monitored to ensure adequate duration. Patients were treated with the standard bifrontotemporal electrode placement, with stimulus intensity 2–2.5 times the initial seizure threshold, as determined at the first treatment
(8). ECT treatments were continued until the patients were asymptomatic or had not shown further improvement over at least two consecutive treatments (mean=13.7 treatments, SD=6.4; range=6–25). Patients were considered responders if they achieved ≥50% reduction in the Hamilton depression scale score from baseline, and remitters if they had ≥60% reduction in the Hamilton depression scale scores and a final Hamilton depression scale score ≤10.
Patients were scanned 1–3 days before their first ECT and a mean of 4.8 days (SD=2.6) after the end of the treatment course. PET scans began 40 minutes after intravenous bolus injection of 5 mCi FDG. During the FDG distribution phase, subjects were provided with a uniform visual stimulus in a partly dimmed and quiet examination room. A thermoplastic mask was used to minimize head movement and facilitate reproducibility of positioning for the second PET study. A Siemens (Knoxville, Tenn.) ECAT EXACT 47 scanner (spatial resolution 5.8 mm full width at half maximum at center) was used in two-dimensional mode to acquire a series of 12 5-minute frames. Images were reconstructed by using attenuation correction measured by a 15-minute transmission scan.
Regions with significant differences in regional cerebral metabolic rate for glucose from pre- to post-ECT were evaluated by using Statistical Parametric Mapping, Version 1996, as previously described
(9). Analysis of covariance (ANCOVA) was applied within each condition to control for differences across studies in global regional cerebral metabolic rate for glucose. Then, within each condition (pre- or post-ECT), the adjusted mean metabolic rate and variance were computed at each pixel. These were used to compute t tests of the differences of the means between conditions at each pixel, and converted to z scores for graphical display as parametric maps. Regions with increases or decreases in regional cerebral metabolic rate for glucose were considered significant on the basis of pixel intensity and spatial extent estimated by using distributional approximations from Gaussian field theory
(10). The foci of change were characterized in terms of the probability that the number of pixels of significant change (p<0.01) in a contiguous group exceeded that which could have occurred by chance. We further required that there be pixels with a z score >3 overlying the region and that the region extend over more than one transverse plane. By using this approach, significance values were corrected for multiple comparisons. As we examined separately peak changes in areas of decreased and increased regional cerebral metabolic rate for glucose, all tests were one-tailed. Analyses were done blind to clinical response status and time of the scan (pre- versus post-ECT).
Results
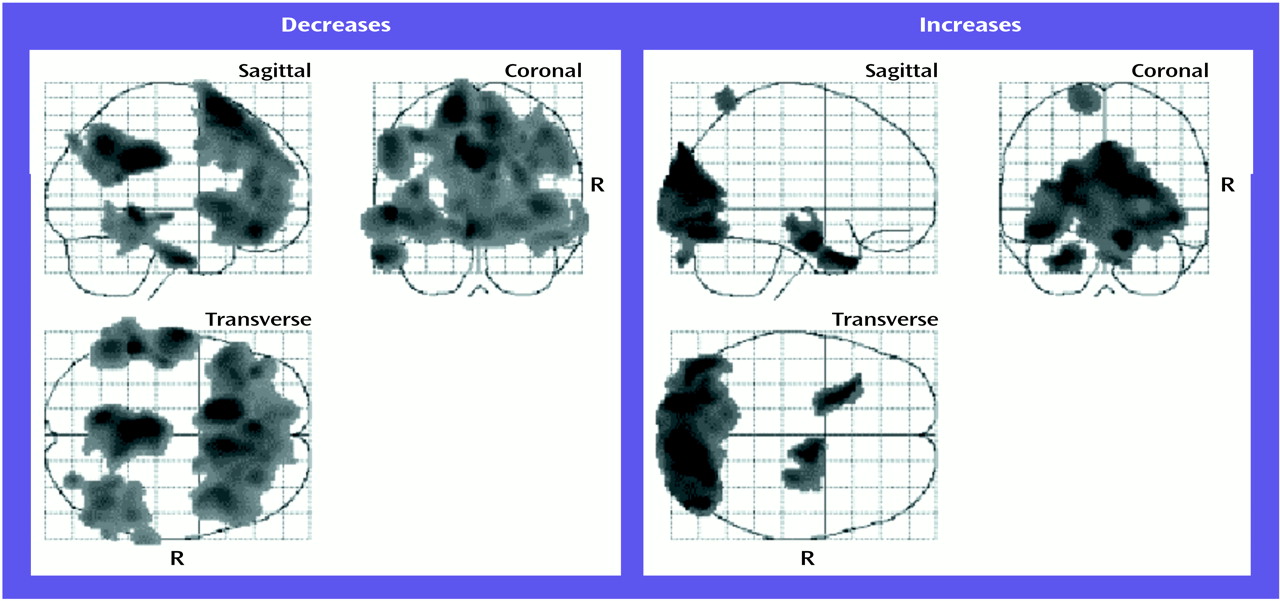
There were widespread, highly significant decreases in regional cerebral metabolic rate for glucose after the course of ECT (
Figure 1). The largest area encompassed reductions in bilateral superior frontal lobe and the dorsolateral and medial prefrontal cortices bilaterally. The second largest area involved reductions in bilateral parietal regions and the posterior cingulate gyrus. A third area primarily involved reductions in the left medial temporal lobe, and a fourth region, encompassing the left inferior temporal lobe, had reductions that approached statistical significance. Significant increases in regional cerebral metabolic rate for glucose were limited to occipital regions (
Figure 1). The large relative decreases in frontal regions and the relative increase in occipital regions indicated a shift in the anteroposterior gradient, consistent with previous rCBF research
(7). The relative increase in occipital regions likely reflected the lack of absolute quantification (and the large relative decreases in other regions).
Four regions of interest were drawn on the areas corresponding to the pixels of most significant change within the areas of statistically significant change (epicenter pixels), on the basis of a statistical parametric mapping analysis set at an elevated z-score threshold {u}=3.090, (p=0.001, uncorrected). The stereotactic coordinates (and locations) of the regions of interest were –14, 16, 68 (left superior frontal gyrus), –2, 40, –14 (subgenual region of left medial frontal gyrus), 0, –42, 32 (precuneus region of the left parietal lobe), and –52, –42, 0 (left middle temporal gyrus). Proportionately normalized counts were determined in each of these four regions of interest, and the difference in counts (pre- versus post-ECT) was evaluated with a two-tailed, paired t test. The differences all indicated significant decreases post-ECT, with p values ranging from p=0.0005 to p<0.0001 (t=5.23 to t=8.58, df=9). There was a significant Pearson’s correlation between the number of ECT treatments and the percentage change in regional cerebral metabolic rate for glucose in the left middle temporal gyrus (r=–0.73, df=8, p=0.01) and a similar, but nonsignificant, effect in the left medial frontal gyrus (r=–0.56, df=8, p=0.09). In both areas, a larger number of treatments was associated with greater decreases in regional cerebral metabolic rate for glucose. All patients showed clinically significant improvement (eight achieved remission, and 10 met the response criterion), which prevented examination of correlations between clinical improvement and changes in regional cerebral metabolic rate for glucose.
Discussion
The major finding of this study was that a course of bilateral ECT reduced regional cerebral metabolic rate for glucose in medication-free patients with major depression. These decreases were widespread and most significant in the frontal, prefrontal, and parietal cortexes. Further, both statistical parametric mapping and region-of-interest analyses were consistent in identifying metabolic reductions. This finding extends our earlier report of reduced cortical rCBF after ECT and is in agreement with the majority of studies in this area
(6,
11–
14). Limitations of this study include the modest sample size, the absence of matched comparison subjects to determine baseline abnormalities of regional cerebral metabolic rate for glucose in the patients, and the use of nonquantitative PET, given that ECT is known to cause changes in global cerebral perfusion
(7) and metabolic rate
(14).
The main implication of these findings is that the mechanism of therapeutic action of ECT may be related to the suppression of functional brain activity, especially in the prefrontal cortex. Since the majority of imaging studies have demonstrated baseline (pretreatment) deficits in similar regions among depressed patients
(15), such a finding may appear counterintuitive. However, our results are consistent with other data indicating ECT-related decreases in neuronal activity, as elaborated in the anticonvulsant theory of ECT
(1). Moreover, there is a growing body of literature that similarly indicates reduced functional brain activity after treatment with antidepressant medications
(15). Larger controlled studies are needed to examine state versus trait functional brain abnormalities in major depression.
Also noteworthy were the findings of reduced regional cerebral metabolic rate for glucose in left temporal regions after ECT, as well as a significant correlation between an increased number of ECT treatments and the percentage reduction of the regional cerebral metabolic rate for glucose in the left middle temporal gyrus. Since dysfunction in medial temporal lobe structures is hypothesized to mediate the amnestic side effects of ECT
(16), such findings may represent evidence of ECT-related physiologic disturbance in temporal lobe function. It would be expected that reduced functional brain activity may result in cognitive deficits
(17). Too few patients in this study received cognitive evaluation to permit meaningful analysis. Determining functional pathways associated with the therapeutic and adverse effects of ECT is an important issue for future research.