Schizophrenia is a severe, debilitating disorder that is characterized by delusional beliefs, hallucinations, disordered speech, and deficits in emotional and social behavior. Although the etiology of the disorder is unknown, family, twin, and adoption studies have suggested that there is a strong genetic component, with heritability estimates of approximately 0.80
(1) . Risk loci identification has been hindered by small gene effect sizes, genetic and phenotypic heterogeneity, and the involvement of indeterminate environmental factors. Despite these challenges, there are growing findings of replicated linkage and association. However, to date, no marker, allele, or haplotype has been unequivocally associated with schizophrenia.
The detection and replication of schizophrenia risk loci could be facilitated by the study of homogeneous populations
(2) . We conducted a genomewide linkage analysis of ethnically homogeneous schizophrenia pedigrees from an Indian population. For thousands of years, India has been populated by diverse caste and tribal groups, with a hierarchical caste system dominating marital and cultural interactions. Strict endogamy has resulted in social stratification and barriers to gene flow between caste groups, which likely has been augmented by geographical dispersal and subdivision of the country into different linguistic regions
(3) . Accordingly, studies comparing geographically distinct caste populations have consistently reported clines (gradual changes across adjacent populations) in gene frequencies across the country, especially in a north-south direction
(4) .
To minimize clinal variation, we recruited participants from the southern state of Tamil Nadu. To maximize sample homogeneity, we exhaustively recruited pedigrees from a single endogamous caste: the Tamil Brahmin. We then recruited additional pedigrees from other Tamil castes. Thus, our study sample could be considered ethnically homogeneous, since population genetic analyses have shown that 1) genetic distances between different Tamil castes are small and 2) Tamil castes are distinguishable from other Indian castes as well as other continental world populations (data available upon request from Watkins et al.).
Results
Pedigree Sample
The genotyped sample included 441 individuals (262 affected probands and siblings) organized into 124 pedigrees. The distribution of pedigrees by the number of affected siblings, available parents, and unaffected siblings is detailed in
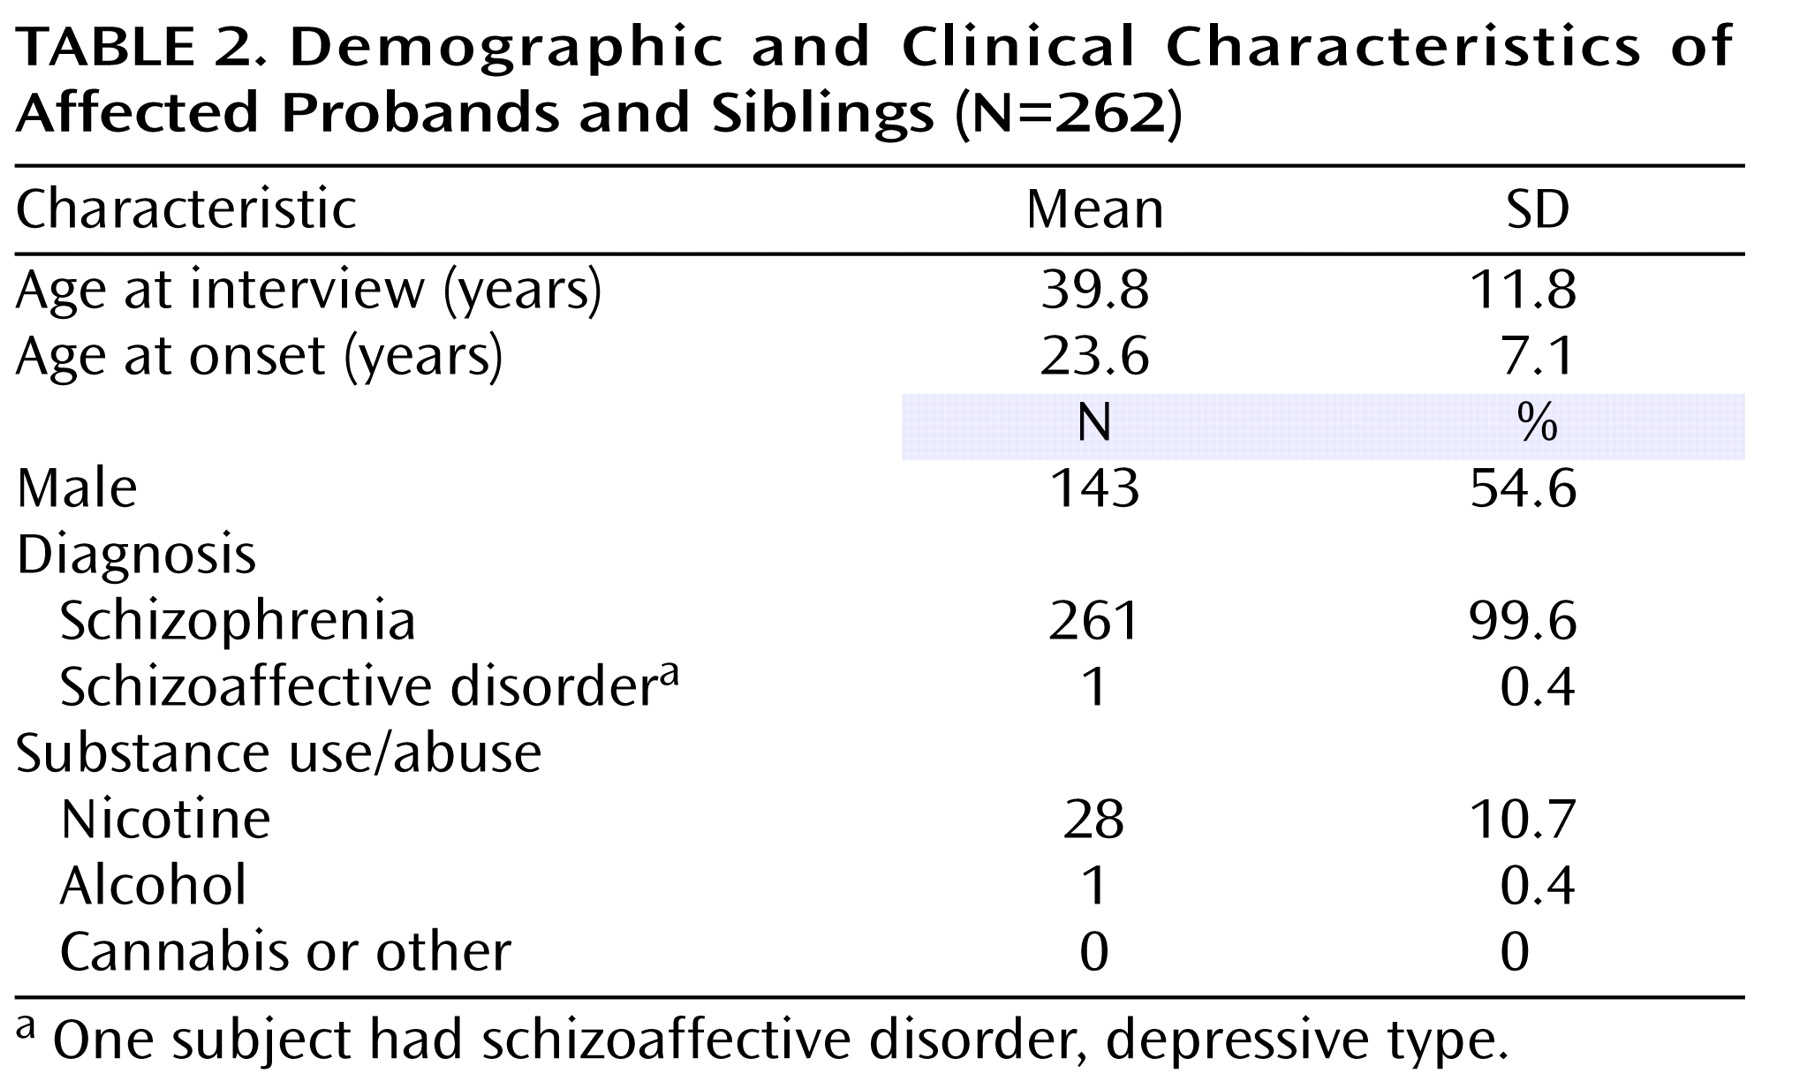
Table 1 . Ninety-seven pedigrees (approximately 78%) were of Tamil Brahmin descent. The remaining 27 pedigrees were from other Tamil Nadu castes. The study sample showed remarkable clinical homogeneity, with all but one affected individual having schizophrenia (
Table 2 ). In addition, there were very low rates of comorbid drug and alcohol use.
Population Structure
Population structure analyses using STRUCTURE supported the presence of a single population cluster (k=1). Moreover, analysis of molecular variance using four castes showed that 99.3% of genetic variation occurred within castes and only 0.7% occurred between castes (data available upon request from Watkins et al.). These modest genetic differences justified the combination of Tamil Brahmin and non-Tamil Brahmin castes for linkage analysis.
Inbreeding Assessment
Inbreeding coefficients (f) were calculated using FEstim. The majority of affected siblings (approximately 68%) showed no evidence of inbreeding (f=0), and 86% had inbreeding coefficient estimates <0.05. However, 13 pedigrees had a mean inbreeding coefficient estimate >0.05 among affected sibling pairs, which may have increased type I error rates among affected sibling pair tests
(30) . The highest observed inbreeding coefficient estimate was 0.159.
To investigate the potential inflation of linkage statistics by inbreeding, we computed mean genomewide exponential LOD scores and dominant and recessive heterogeneity LOD scores and then compared these mean scores with empirically derived expected values. The observed and expected mean exponential LOD scores were 0.194 and 0.004 (p=0.01), respectively, suggesting potential inflation via inbreeding by approximately 0.19 LOD units. Observed and expected mean heterogeneity LOD scores were 0.244 and 0.110 (dominant: p=0.02), respectively, and 0.201 and 0.106 (recessive: p=0.03), respectively, suggesting potential inflation of linkage statistics via inbreeding by approximately 0.134 (dominant) and 0.095 (recessive) heterogeneity LOD units. Increased identity-by-descent sharing and linkage evidence may result from either inbreeding or linkage. However, because modest inbreeding was suggested by both clinical data and inbreeding coefficient estimates, we corrected observed linkage statistics by subtracting their degree of apparent inflation at all map locations. All reported multipoint statistics were corrected using this method (unless otherwise stated).
Significance Thresholds
Based on genomewide correlations between exponential LOD scores (negative scores zeroed) and heterogeneity LOD (dominant and recessive models) scores and the use of the method described by Cheverud
(23), the effective number of independent test statistics was 2.1. Incorporating 2.1 effectively independent tests, empirical genomewide “significant” and “suggestive” thresholds for exponential LOD scores were 3.23 and 1.92, respectively, and thresholds for nominal p values of 0.01 and 0.05 were 1.46 and 0.85, respectively. For heterogeneity LOD dominant and recessive scores, genomewide “significant” and “suggestive” thresholds were 3.26 and 1.92, respectively, and thresholds for nominal p values of 0.01 and 0.05 were 1.45 and 0.85, respectively.
Linkage Analyses
Genomewide multipoint results for all linkage statistics are detailed in the data supplement accompanying the online version of this article.
Allele-Sharing LOD Score Analysis
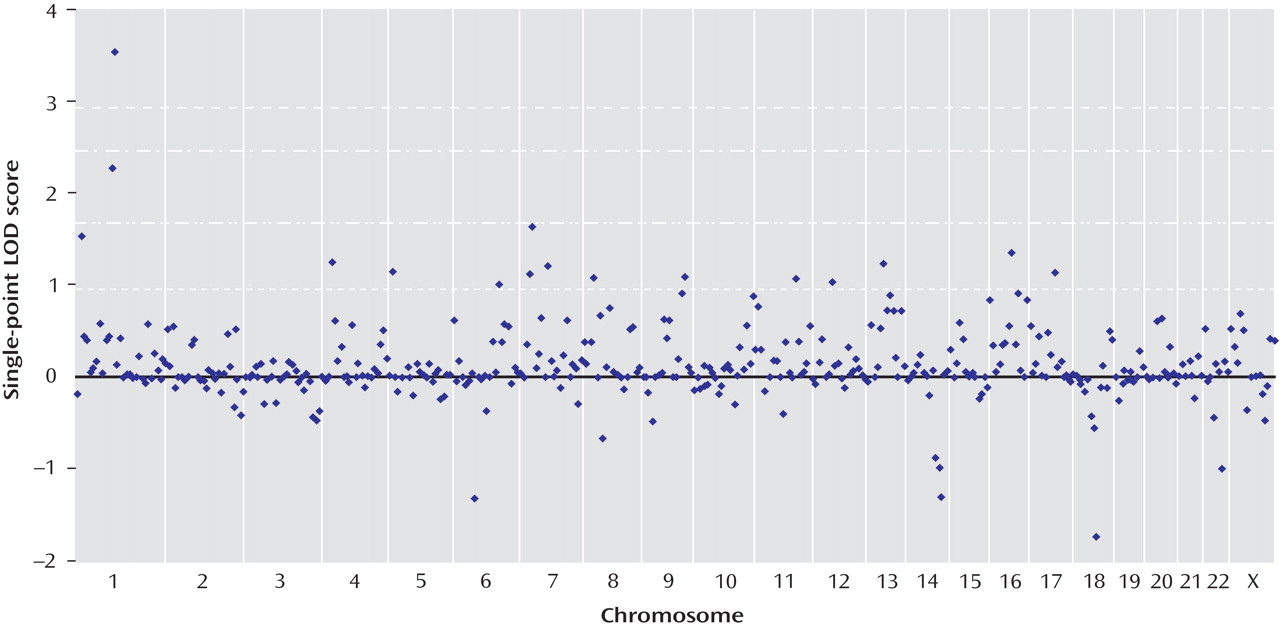
All single-point exponential LOD scores are shown in
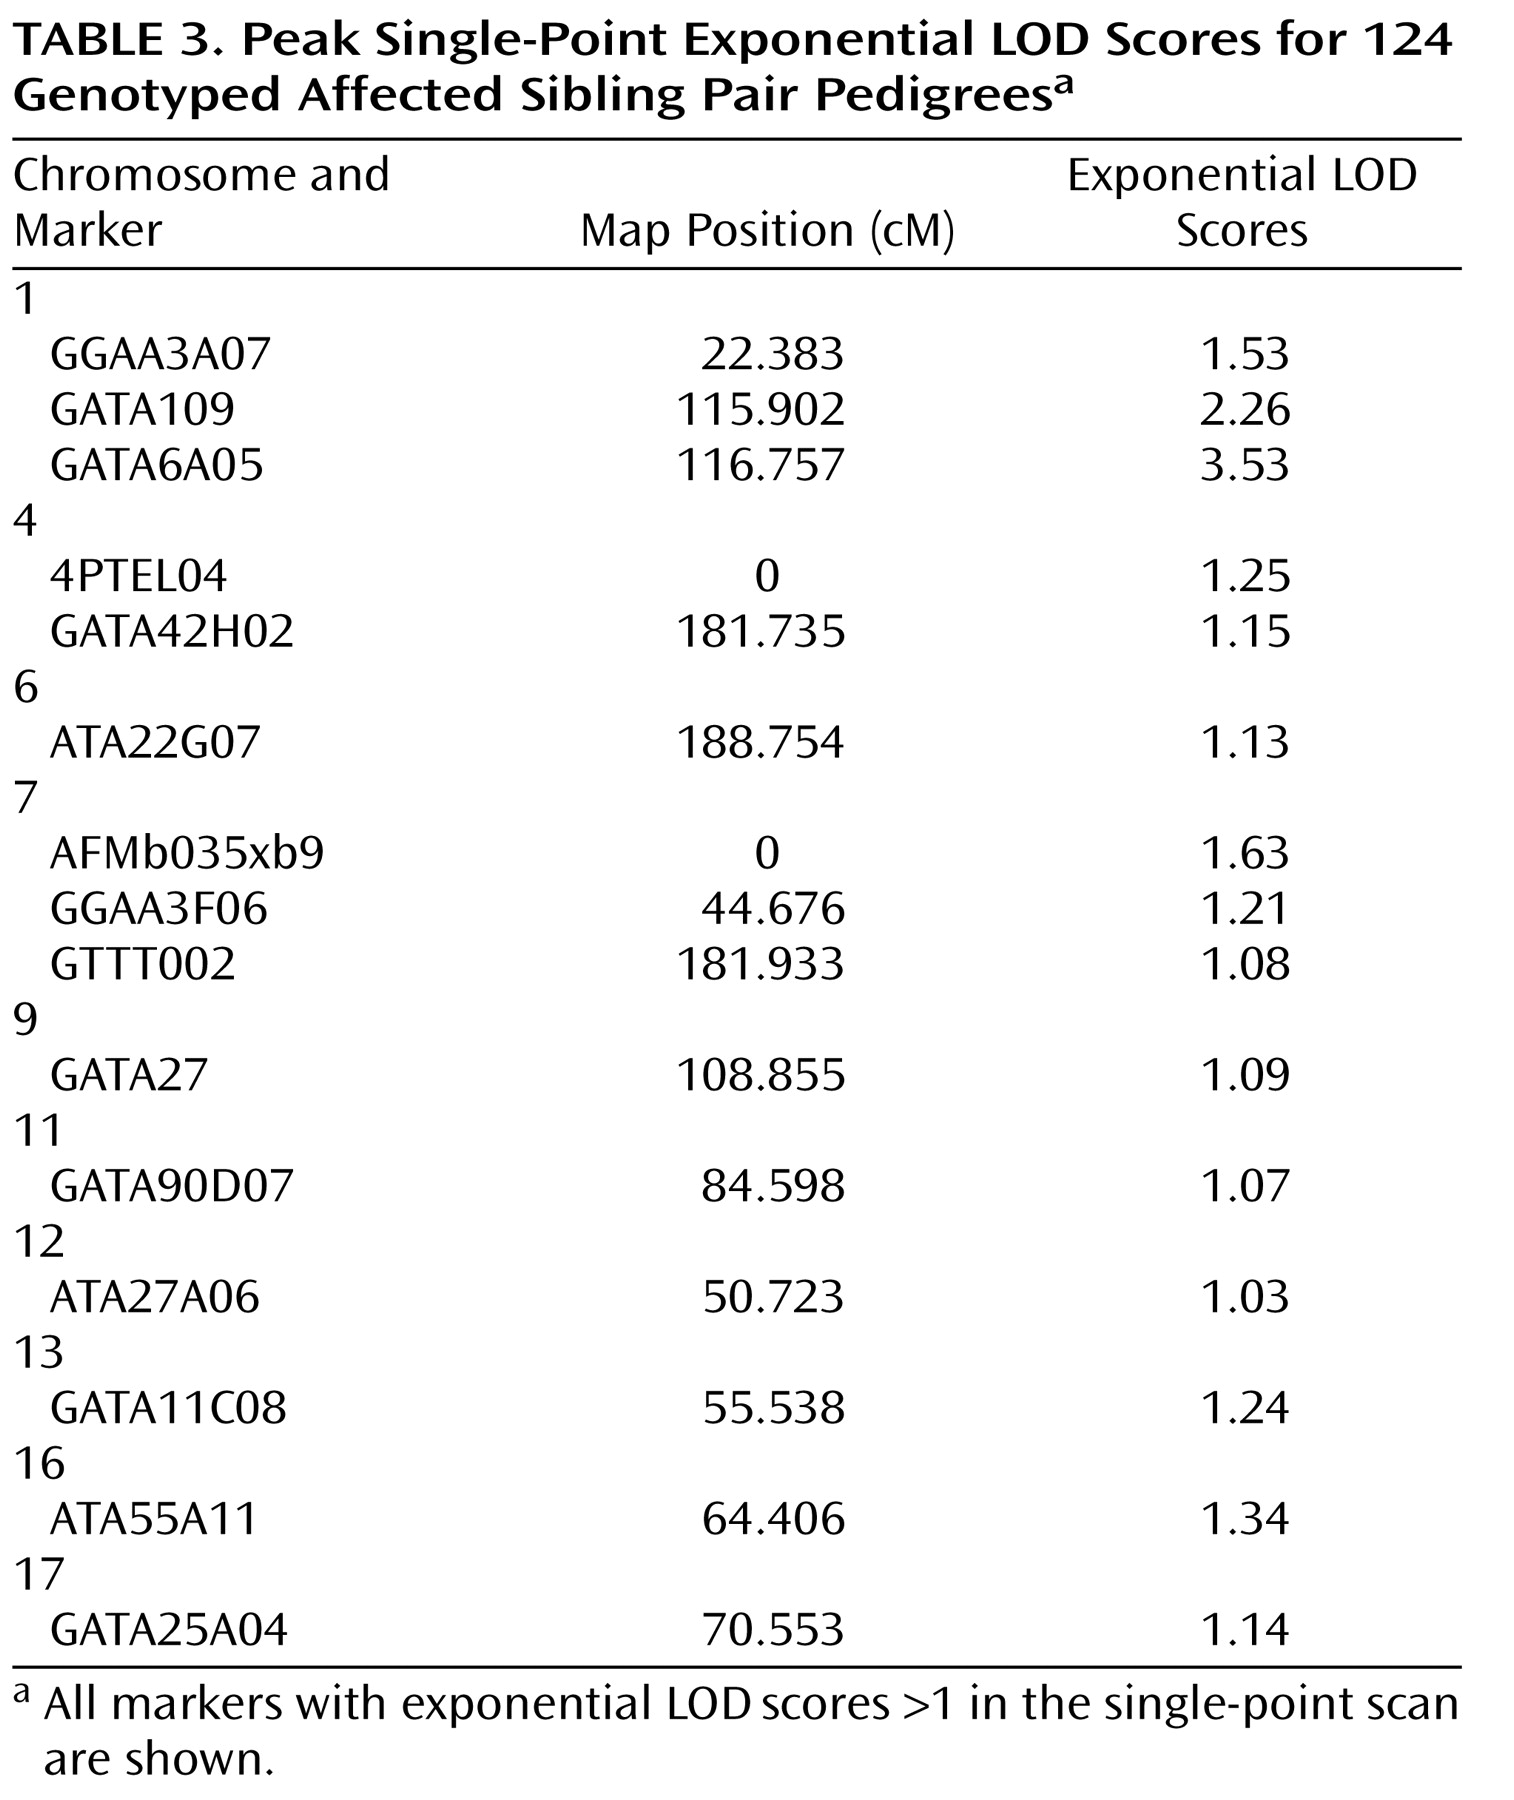
Figure 1 . The highest observed scores were for two adjacent markers on chromosome 1p31.1: marker GATA109 (exponential LOD score=2.26) and marker GATA6A05 (exponential LOD score=3.53). Markers achieving single-point exponential LOD scores >1 are detailed in
Table 3 .
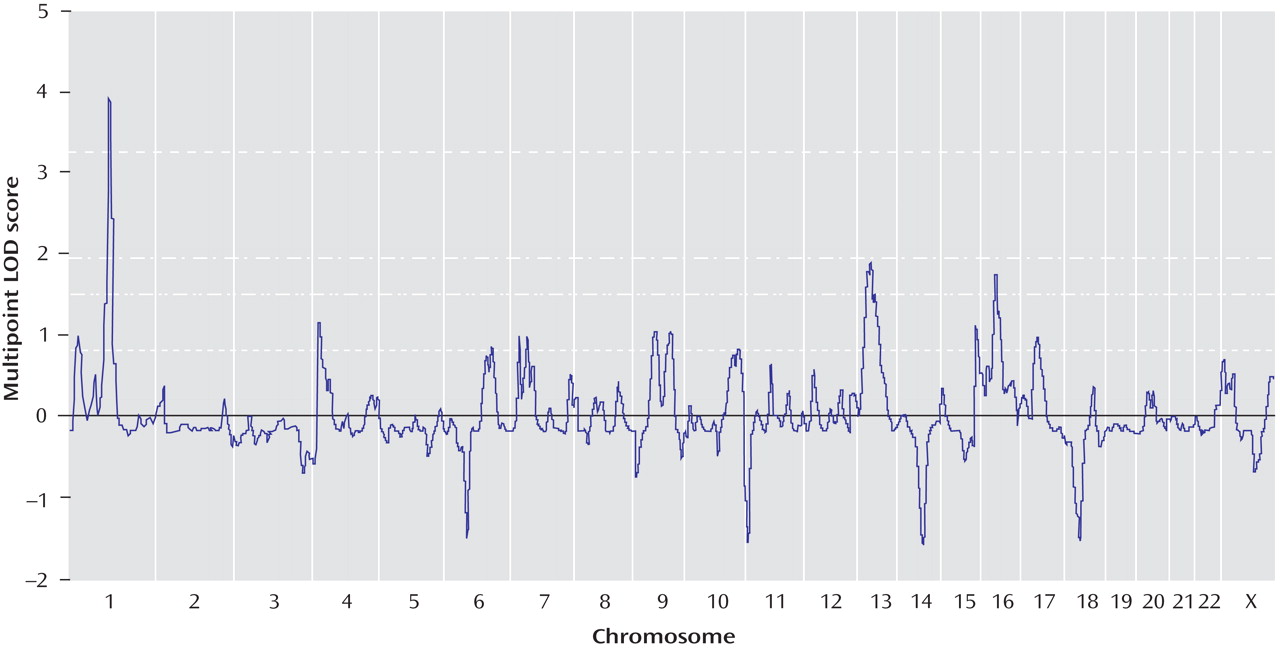
Genomewide multipoint exponential LOD scores are shown in
Figure 2 . Multipoint exponential LOD scores were largely consistent with findings for single-point scores. The highest multipoint exponential LOD score was obtained on chromosome 1p31.1, located 117 cM from the p-telomere (corrected exponential LOD score=3.91). This result easily surpassed the threshold for genomewide significant linkage, with only 56 peaks >3.91 occurring in 10,000 simulations (corrected genomewide significance: p=0.01). Approximately 53% of pedigrees (66/124) yielded positive exponential LOD scores at the 1p31 peak. The 1-LOD drop (approximating a 95% confidence interval [CI] for the location of the peak) delimited a 9.6-cM region that ranged from 114.1–123.7 cM (79.8–89.6 Mb, NCBI Build 36.2). The sibling relative risk associated with the 1p31 peak was calculated using the following equation: λ
s =0.25/Z
0 =1.95 (Z
0 indicates the mean proportion of affected sibling pairs sharing zero alleles, identity-by-descent, at the peak
[31] ). This locus-specific effect size may have been inflated because of its calculation from genome scan data
(32) . Both Tamil Brahmin (78% of the study sample; uncorrected peak exponential LOD score=3.6, 117 cM from the p-telomere) and non-Tamil Brahmin pedigrees (22% of the study sample; uncorrected peak exponential LOD score=0.93, 116 cM from the p-telomere) contributed proportionate linkage evidence at the 1p31 peak.
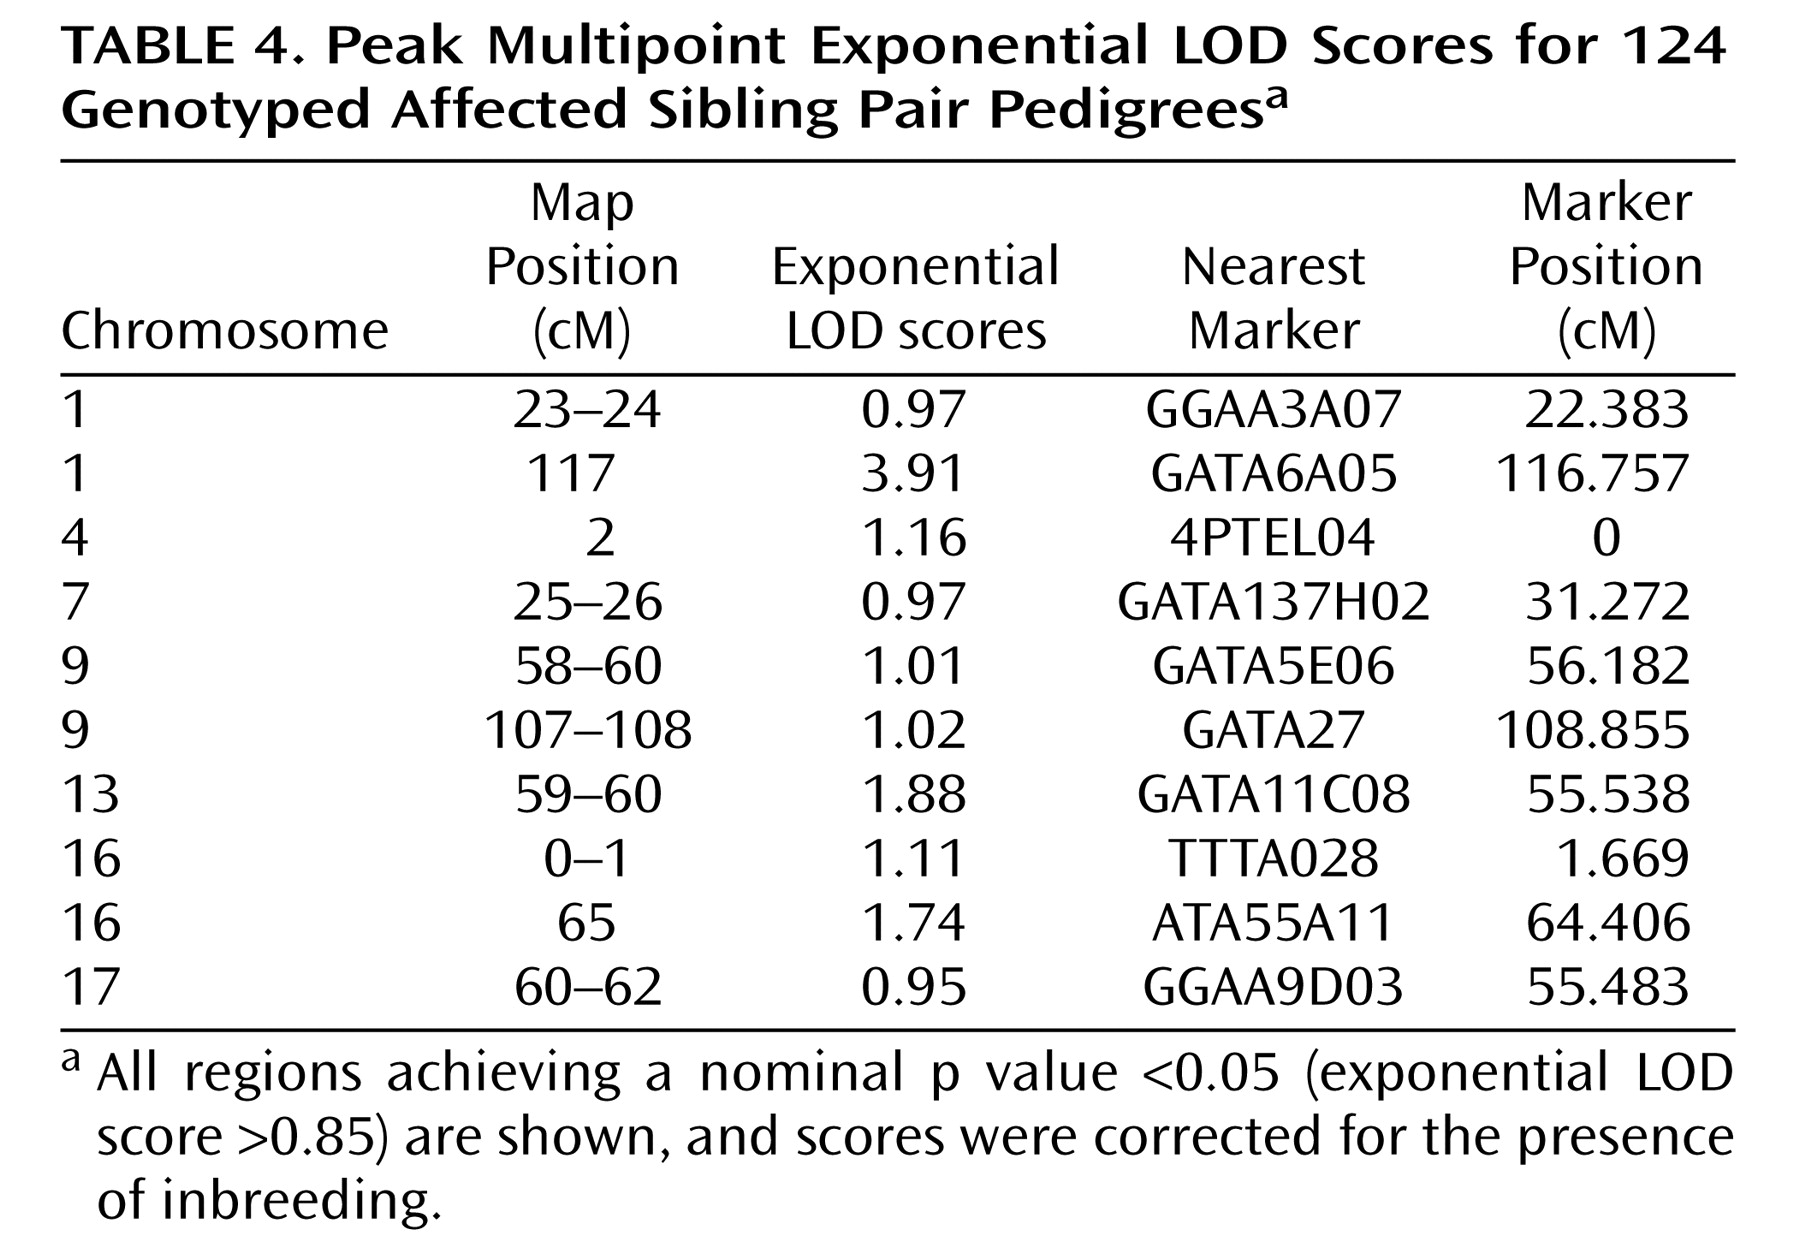
Using exponential LOD scores, the 1p31 peak was the only result to achieve either genomewide suggestive or significant linkage. In addition, three regions achieved nominal p values ≤0.01, and 10 achieved nominal p values ≤0.05 (
Table 4 ). These values did not exceed those that were expected by chance at a nominal p value <0.05. Of 10,000 simulated genomewide scans, 838 had three or more peaks that achieved nominal p values ≤0.01 (experiment-wide significance: p=0.08), and 1,587 had 10 or more peaks that achieved nominal p values ≤0.05 (experiment-wide significance: p=0.2).
Heterogeneity LOD Score Analyses
Heterogeneity LOD score analyses supported and extended the allele-sharing analysis. The peak heterogeneity LOD score was also observed on chromosome 1p31.1, 117 cM from the p-telomere. Maximal evidence was obtained using the dominant model (corrected heterogeneity LOD dominant score=4.47; corrected genomewide significance: p=0.004). The difference between heterogeneity LOD dominant and recessive scores at this position was 2.439 (heterogeneity LOD recessive score=2.034), suggesting a dominant mode of inheritance. In 10,000 simulated data sets, an absolute difference between heterogeneity LOD dominant and recessive scores >2.439 was observed for only 67 data sets (point-wise empirical significance: p=0.007), suggesting that this difference did not occur by chance. Strong support for chromosome 1p31 was also provided by single-point analyses of the two markers beneath the multipoint peak (marker GATA109, heterogeneity LOD dominant score=2.61; marker GATA6A05, heterogeneity LOD dominant score=4.49).
Using heterogeneity LOD statistics, suggestive linkage was also observed for chromosome 13q22.1, 69 cM from the p-telomere (heterogeneity LOD recessive score=2.62, corrected genomewide type I error rate=0.205), and chromosome 16q12.2, 65 cM from the p-telomere (heterogeneity LOD dominant score=1.92, corrected genomewide type I error rate=1).
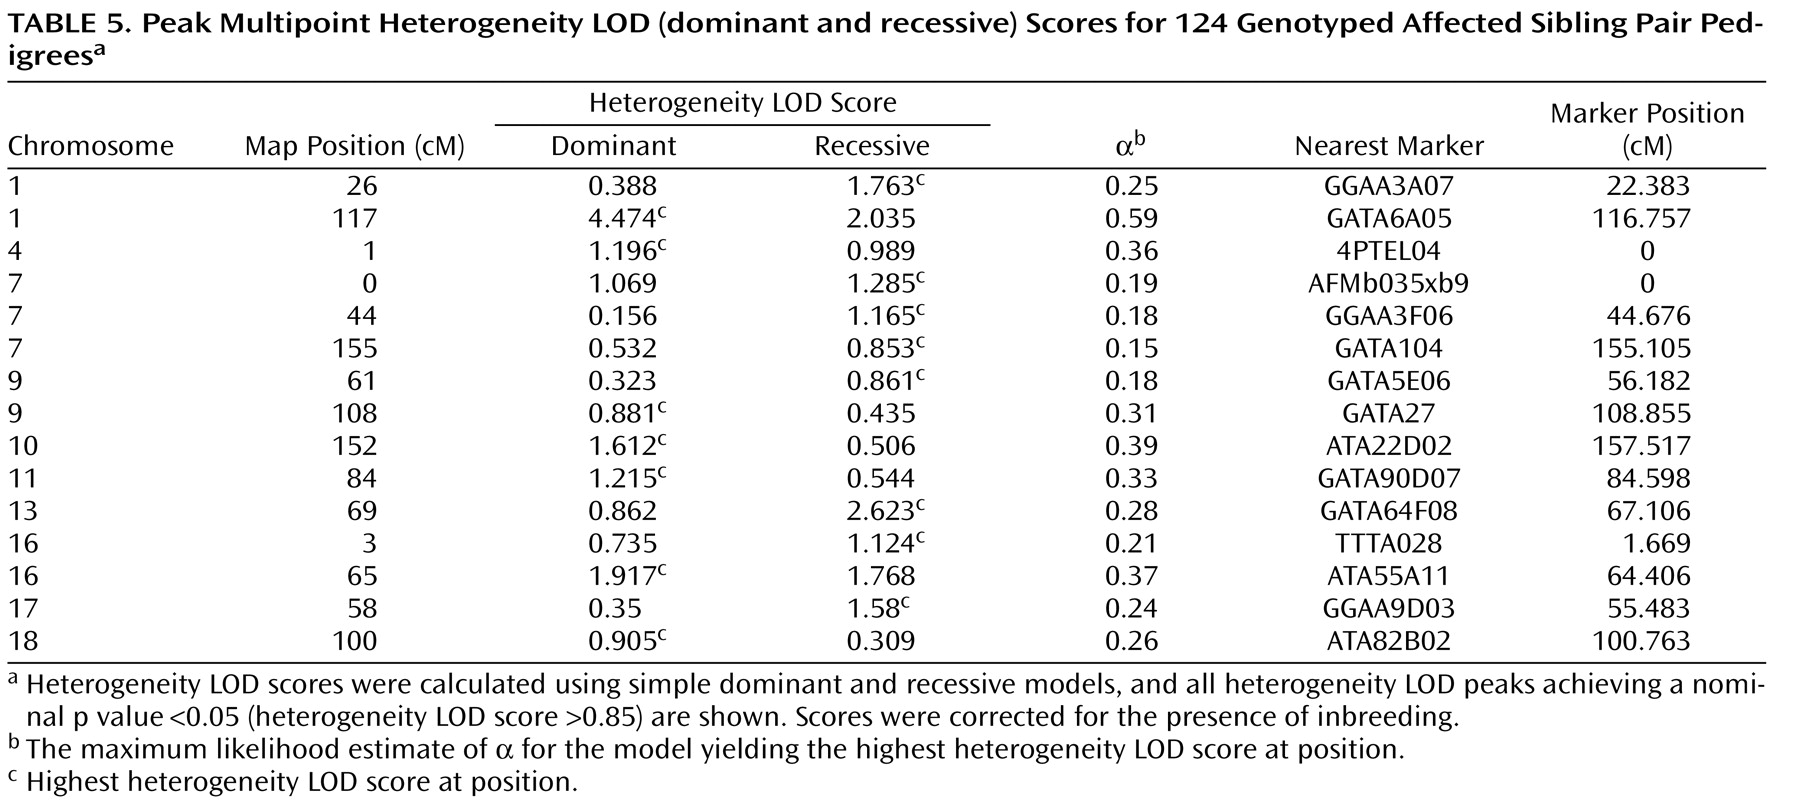
Heterogeneity LOD analyses also detected linkage evidence for more regions than expected by chance across the entire heterogeneity LOD score range. The number of peaks achieving nominal p values ≤0.05, nominal p values ≤0.01, genomewide suggestive linkage, and genomewide significant linkage were 15, 6, 3, and 1, respectively. In 10,000 simulations of heterogeneity LOD dominant scores, 173 had 15 or more peaks with nominal p values ≤0.05 (experiment-wide significance: p=0.02); 152 had six or more peaks with nominal p values ≤0.01 (experiment-wide significance: p=0.02); 217 had three or more peaks achieving suggestive linkage (experiment-wide significance: p=0.02); and 222 had one or more peaks achieving significant linkage (experiment-wide significance: p=0.02). The results were almost identical using the empirical distribution of heterogeneity LOD recessive scores. These findings suggest the presence of multiple, small-effect loci in addition to the significant and suggestive regions. All multipoint heterogeneity LOD peaks achieving nominal p values ≤0.05 are detailed in
Table 5 .
PDE4B Gene Association Analyses
To our knowledge, there are no established schizophrenia candidate genes under the chromosome 1 peak. The nearest candidate gene is
PDE4B (33,
34) on chromosome 1p31.3, located approximately 15 Mb from our reported peak. To determine whether our reported peak reflected the association of schizophrenia with
PDE4B gene variants, we conducted genetic association analyses of the
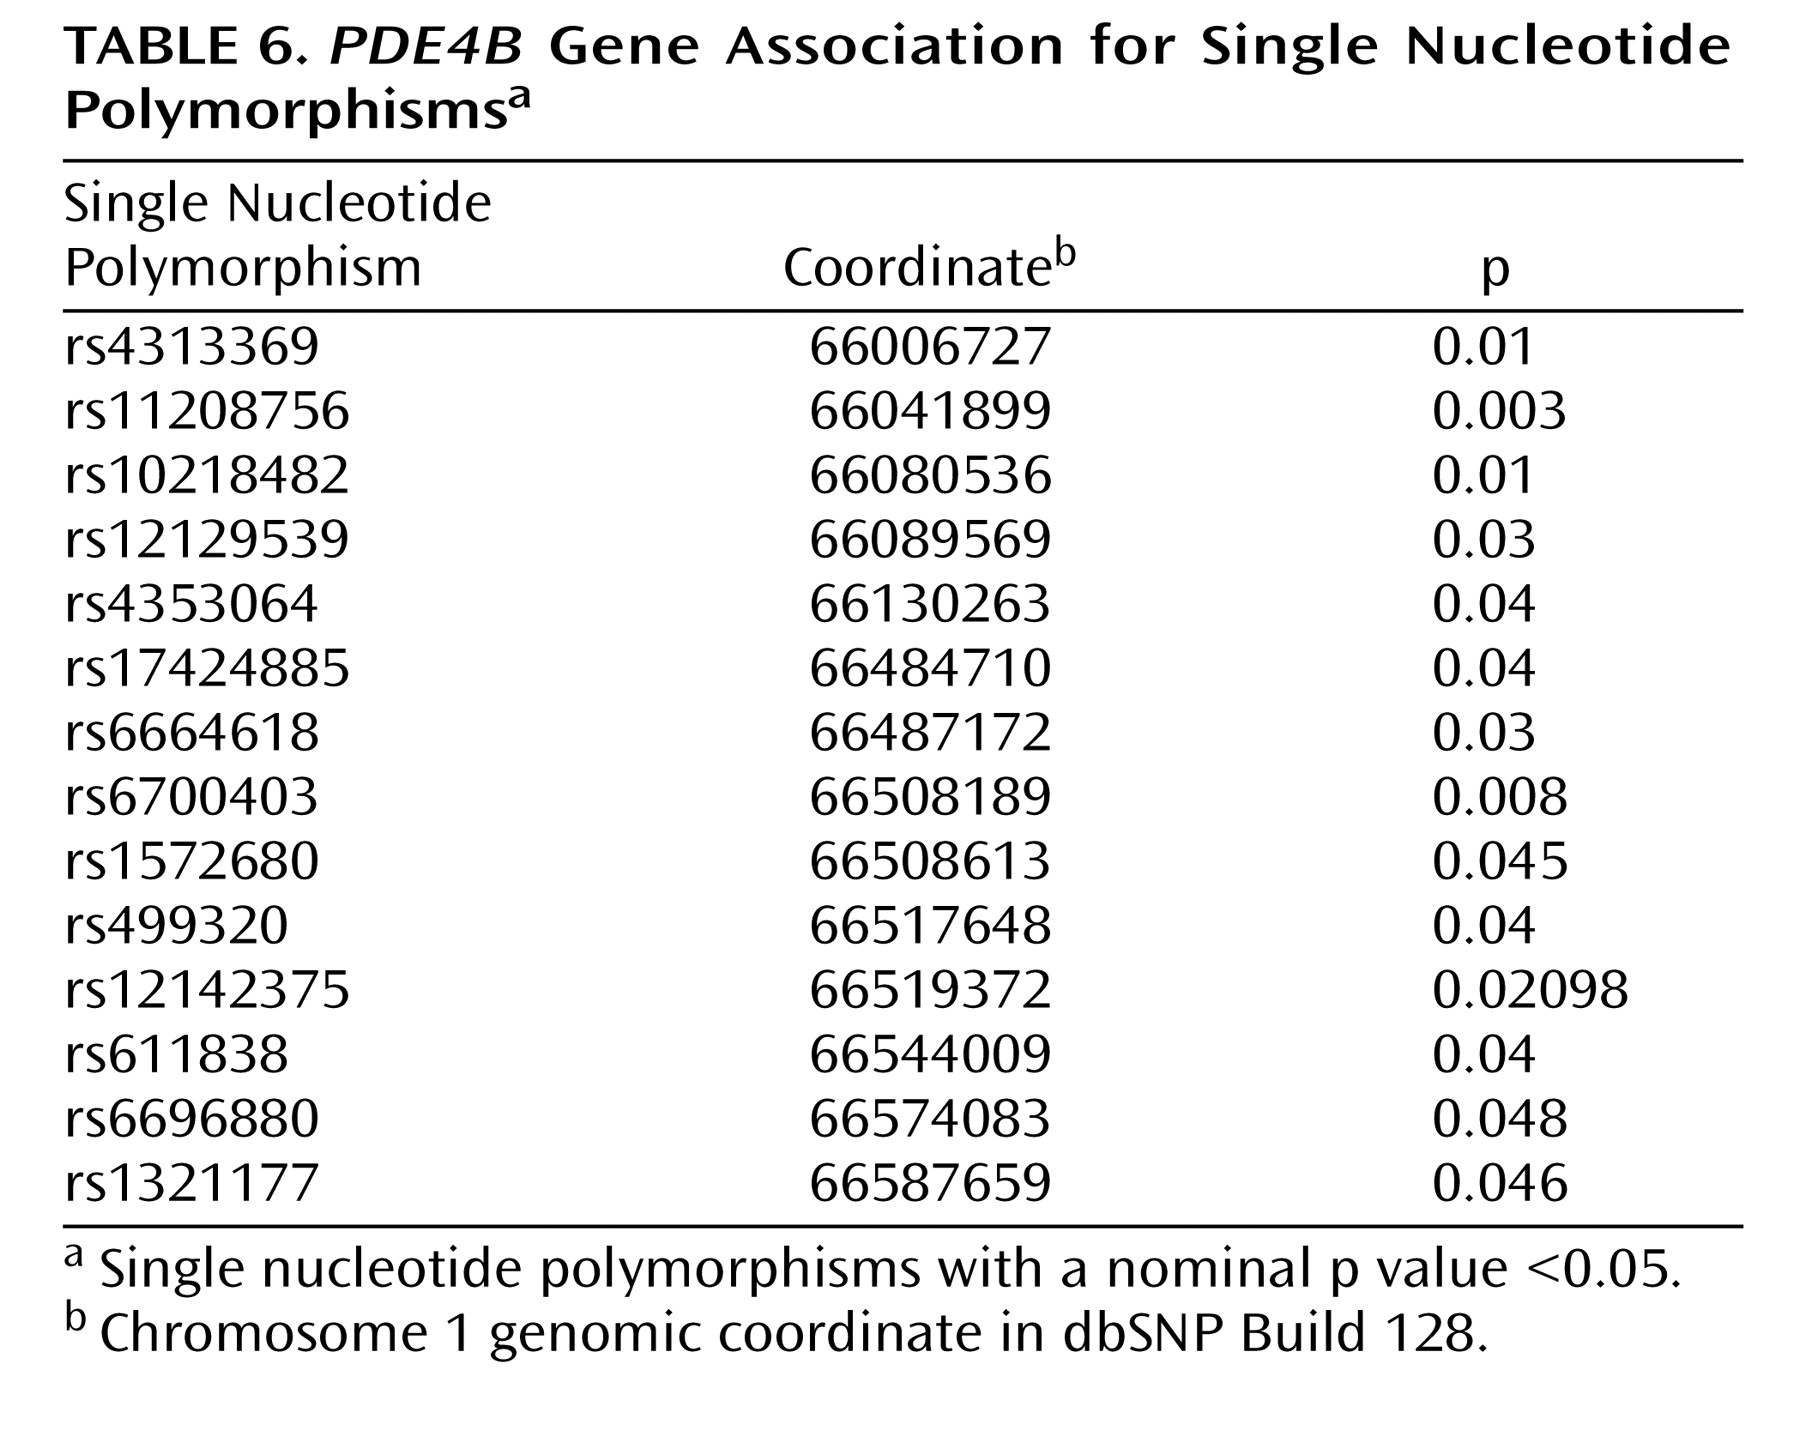
PDE4B gene. This analysis included 117 SNPs spanning approximately 620 kb, which were genotyped for 207 fully informative Tamil pedigrees (40 affected sibling pairs, 167 trios). Association analysis using UNPHASED identified 14 SNPs (
Table 6 ) and several multimarker haplotypes with nominal p values ≤0.05. However, no SNP or haplotype association survived multiple testing correction. Although a previous association study demonstrated association of a
PDE4B gene haplotype in women
(34), we detected no increased association evidence in families with female-only offspring.
Discussion
To our knowledge, the present study is the first to describe a genomewide linkage scan for schizophrenia in an Indian population. The primary finding was a LOD score of 3.91 on chromosome 1p31.1. This finding achieved genomewide significance using both allele-sharing LOD scores and heterogeneity LOD scores, incorporating correction for multiple testing and mild consanguinity.
Genetic distance estimates have demonstrated that Indian castes occupy a genetic position intermediate between European and East Asian populations
(3,
35) . Consistent with these findings, Caucasian and Chinese schizophrenia subjects have also demonstrated linkage to chromosome 1p31.1. In 238 Finnish schizophrenia pedigrees, Paunio et al.
(36) detected a single-point LOD score of 2.68 at marker D1S1728, located approximately 1.1 cM from our reported multipoint peak. Notably, this result may be interpreted as a replication
(24) of the significant linkage reported in the present study. In 557 Han Chinese schizophrenia pedigrees, Faraone et al.
(37) detected a z score of 2.08 at marker D1S551, located approximately 0.3 cM from our multipoint peak. Shaw et al.
(38) also detected linkage to marker D1S551 (nonparametric linkage=1.65) in 70 Caucasian pedigrees with a psychosis-spectrum phenotype. Further, the 1p31.1 region overlaps with a chromosome bin achieving the sixth best p value in a recent meta-analysis of 32 schizophrenia linkage scans (D.L. Levinson, personal communication, August 2008). These results implicate the 1p region in schizophrenia pathogenesis among multiple population groups.
A Japanese study reported significant linkage of schizophrenia to chromosome 1p21.1 (LOD score=3.39), located approximately 18 cM from our multipoint peak
(39) . However, the 95% CI regions for the peak reported in the Japanese study and the peak reported in the present study are separated by >12 Mb, suggesting that they represent distinct loci. However, large variations in peak location estimates have been reported for complex diseases
(40), and it is possible that both studies detected the same locus. Clarification will require identification of the causal variants underlying each peak.
In contrast, many published studies, including three meta-analyses
(41 –
43), have not reported linkage of schizophrenia to the 1p region. It is possible that the putative risk variants underlying the peak reported in the present study have similar frequencies in different population groups but that genetic and phenotypic heterogeneity have precluded detection of these risk variants in many studies. Alternatively, these risk variants may have had a higher frequency in our study population. Further research is required to confirm the presence of one or more schizophrenia risk variants in this chromosome region and determine their significance in different populations.
Our second highest linkage peak was detected between the 13q21.31 and 13q22.1 regions. Several studies have reported linkage of schizophrenia to a 13q32-33 region, located approximately 20 cM telomeric from our 13q heterogeneity LOD peak
(44 –
47), and to regions located approximately 6 cM
(38) and <1 cM
(48) from our reported peak. The heterogeneity LOD peak reported in the present study also overlaps with a region that showed significant linkage evidence in a meta-analysis of 18 genomewide schizophrenia scans
(42) . Given the expected variability in peak location estimates from linkage scans of complex disease
(49), these results may support previous evidence for a schizophrenia susceptibility locus on chromosome 13q. Our third highest and suggestive heterogeneity LOD peak was detected on chromosome 16q12.2. We are aware of two studies that have provided evidence for chromosome 16q
(38,
50), although our findings are the first to report suggestive linkage to this region. Evidence for linkage to this region may be sufficient to justify further study.
In addition to our significant and suggestive findings, our heterogeneity LOD analyses detected more regions at nominal p values ≤0.01 and ≤0.05 than expected by chance. These findings are consistent with an oligogenic transmission model for schizophrenia, which produces moderately increased allele sharing at a number of loci
(22) .
A unique feature of the present study sample was phenotypic homogeneity. Molecular genetic studies of schizophrenia typically combine schizophrenia and schizoaffective disorder into a core phenotype, with schizoaffective disorder subjects usually comprising approximately 10%–15% of affected subjects
(5,
51) . Although the same diagnostic criterion was applied to the present study, all affected subjects except one had schizophrenia, which is a finding consistent with several epidemiological studies also conducted in Chennai, India
(52 –
54) . The phenotypic homogeneity of our study sample may have increased power to resolve schizophrenia-specific risk variants. Another favorable characteristic was the extremely low rate of comorbid alcohol and illicit drug use, which simplified diagnostic ascertainment and may have reduced an important source of gene-environment interactions influencing disease risk. The Indian families who participated in the present study may also have more uniform dietary and social customs relative to many multicultural Western societies, increasing the environmental homogeneity of the study sample.
One potential limitation to the study is the presence of consanguinity in some pedigrees, which can falsely increase linkage evidence
(14) . We corrected for consanguinity by 1) computing expected and observed genomewide mean values for each statistic and 2) subtracting observed scores by the difference between the two. This approach was probably conservative, since mean scores will be inflated by consanguinity or linkage. Notably, linkage evidence for chromosome 1p31.1 remained significant (genomewide significance: p<0.05) following removal of the 13 pedigrees for whom the inbreeding coefficient among affected sibling pairs exceeded 0.05
(30) . This suggests that our corrections were adequate and consanguinity did not substantially influence our results.
To our knowledge, there are no established schizophrenia candidate genes beneath the 1p31 peak. However, the boundary of the 1-LOD drop is located approximately 13 Mb from the
PDE4B gene, which has been previously implicated in schizophrenia susceptibility
(33,
34) . Our failure to detect association of
PDE4B gene variants with schizophrenia suggests that
PDE4B gene variants are not responsible for the 1p31 linkage peak. A possible limitation to the study is the modest power of the association sample, although power should have been enhanced by the inclusion of pedigrees linked to the region
(55) . Even allowing for variation in peak location
(40), the
PDE4B gene is located well outside the region implicated by the 1p31 peak. Given that the identified 1-LOD drop contains approximately 60 unique brain-expressed genes, it appears more likely that this linkage finding reflects association to a novel candidate gene.
In summary, we detected genomewide significant linkage to chromosome 1p31.1 and suggestive linkage to chromosomes 13q22.1 and 16q12.2 in an Indian population. Power of this analysis may have been enhanced by genetic, environmental, and phenotypic homogeneity, which should also benefit subsequent fine-mapping analyses. We are currently planning a comprehensive linkage disequilibrium mapping analysis of a larger sample to identify novel schizophrenia-associated risk variants.

