Abstract

Placebo response has increased over the past few decades, and this temporal effect is explained by an increase of the number of sites per trial and by a decrease in the number of academic sites in randomized controlled trials.

Abstract

Objective

Large placebo response presents a major challenge for psychopharmacologic drug development and contributes to the increasing failure of psychiatric trials. The objective of this meta-regression analysis was to identify potential contributors to placebo response in randomized controlled trials of antipsychotic treatment in schizophrenia.

Method

The authors extracted trial design and clinical variables from eligible randomized controlled trials (N=50) identified through searches of MEDLINE (1960–2010) and other sources. Standardized mean change (SMC) was used as the effect size measure for placebo response, based on change scores on the Brief Psychiatric Rating Scale or the Positive and Negative Syndrome Scale from baseline to endpoint (2 to 12 weeks).

Results

The results suggest significant heterogeneities (Q=387.83, df=49) in the magnitude of placebo response (mean SMC, −0.33, range −1.4 to 0.9) and in study quality. Both placebo SMC and study quality increased over time. Younger age, shorter duration of illness, greater baseline symptom severity, and shorter trial duration were significantly associated with greater placebo response, while country (United States compared with other countries) was not. More study sites, fewer university or Veterans Affairs treatment settings, and a lower percentage of patients assigned to receive placebo were associated with a greater placebo response, but these were not independent of publication year. Study quality affected the variability but not mean levels of placebo response.

Conclusions

This study identified important patient characteristics and trial design factors affecting the level of placebo response and hence the likelihood of detecting efficacy signals in randomized controlled trials. Future studies should test whether controlling these factors improves the detection of an antipsychotic effect.
The inclusion of placebo control groups has been standard practice, and often a regulatory requirement, in randomized psychopharmacology trials despite some ethical concerns (13). An increasing placebo response in recent antipsychotic trials presents a major challenge in psychopharmacologic drug development (46), with studies reporting a trend toward diminished drug-placebo differences over time (4, 6, 7). Reported placebo responses have ranged from 25% to 75% in psychopharmacology trials (8), a trend contributing to numerous trial failures. In psychiatric trials, these failures often become apparent only late in the development process and can thus be particularly costly because of the intrinsically longer investigational path required for psychiatric agents (9, 10).
There is a paucity of empirical data addressing placebo response in schizophrenia (47, 11, 12), and systematic analyses to date have been inconclusive. A meta-analysis of 32 randomized controlled trials conducted between 1970 and 2000 (13) reported substantial variation in placebo effect size and identified trial duration as the only significant moderator affecting the reported placebo effect sizes. Another meta-analysis of 27 antipsychotic trials conducted between 1997 and 2008 (14) found that increased placebo response was associated with a decrease in the percentage of patients assigned to receive placebo, a larger number of country sites involved in the study, and a greater percentage of female subjects involved, but not by other factors examined (year the trial was started, number of treatment arms, number of sites and regions, mean baseline symptom severity, trial duration, and dosing regimen). Systematic reviews of drug treatment effect sizes in schizophrenia trials have also been conducted, and they have found only small to modest effect sizes (7, 11, 14, 15). A better understanding of factors underlying rising placebo responses could help address this drug development challenge.

Method

Our primary objective in this study was to examine potential contributors to placebo response, as suggested by previous authors (4, 5, 7, 13, 14, 1621). We tested the hypothesis that each factor on the comprehensive listing specified in Table 1 could influence response to placebo. In addition, we sought to systematically evaluate the quality of these randomized controlled trials as assessed by the omnibus rating proposed by Kocsis et al. (22), as well as the influence of study quality on the placebo response effect size.
TABLE 1. Findings for Meta-Regression Analysisa
Contributors to Placebo Response (Standardized Mean Change in Symptom Score From Baseline)No AdjustmentCovariate-Adjusted Regression Model
 CoefficientLR χ2pCoefficientLR χ2pCommon Confounders Adjustedb
 Patient characteristics and study design factors
Study year–0.0114.300.038–0.03510.65<0.001Age, baseline CGI severity score, % on placebo, trial durationc
 1970–1999–0.0111.680.195    
 2000–2010–0.0948.100.004    
 Patient characteristics
% Male<–0.0010.030.871<–0.0010.010.926Study year, period
Age (all studies)0.04416.15<0.0010.04622.92<0.001Study year, period
Age (>30 years)0.0374.360.0370.0468.320.004 
Illness durationd0.06814.66<0.0010.05411.12<0.001Study year, period
Baseline CGI severity score–0.51110.530.001–0.4209.230.002Study year, period
 Study design factors
Trial duratione0.09411.93<0.0010.0818.07<0.005Study year, period
Washout periodf 1.410.495 1.040.593Study year, period
Treatment settingg 8.220.016 3.960.138Study year, period
Number of study sites–0.0085.610.018–0.0051.750.186Study year, period
Country (United States or others)0.0620.200.651–0.0050.000.970Study year, period
Number of treatment armsh      Study year, period (by stratification)
 1970–19970.0410.320.5710.0510.470.493 
 1998–2010–0.1424.490.034–0.0891.220.269 
Percent in placebo grouph      Study year, period (by stratification)
 1970–1997–0.0050.300.587–0.0070.520.472 
 1998–20100.0204.610.0320.0142.090.148 
a
Coefficient (slope) indicates association between standardized mean change (SMC) in symptom score (Positive and Negative Syndrome Scale or Brief Psychiatric Rating Scale) and explanatory variables. Reduced symptom score from baseline would result in a negative SMC value. LR=likelihood ratio; CGI=Clinical Global Impressions Scale. Study year refers to year of publication.
b
In this column, period refers to before versus after 1993. Intercept was allowed to differ according to study period.
c
Each of these four variables was significant at p<0.05, based on likelihood ratio chi-square (SAS generalized linear model).
d
Illness duration was derived from time since onset of psychotic symptoms based on clinical interview.
e
Trial duration was based on nominal duration stated in the short-term (<12 weeks) protocol.
f
Washout period was defined as the number of days between termination of previous antipsychotic treatment and the date that study treatment was initiated; it was categorized as ≤2 days, 3–7 days, or 8–84 days.
g
Treatment setting was coded as follows: 1=community hospital (N=3), 2=university hospital (N=16), 3=state/provincial hospital (N=0), 4=mixed patients (N=31), 5=not mentioned (N=8), and 6=Veterans Affairs (VA) hospital (N=3). In the analysis, treatment setting was categorized as university or Veterans Affairs; mixed; or community or not mentioned). Missing data were imputed with median values from available data in the other studies.
h
Number of treatment arms and percent in the placebo group were analyzed by study period using 1997 as cutoff, excluding the four studies that used a crossover design.

Search for Randomized Trials

We searched MEDLINE (1960–2010), Embase (1980–2010), Google Scholar, ISI Web of Science (Thomson Reuters) (1960–2010), Cochrane Database of Systematic Reviews (COCH) and Cochrane Library (1958–2010), CINAHL (Cumulative Index to Nursing and Allied Health Literature) (1982–2010), and PsycINFO (1970–2010) for randomized, placebo-controlled, double-blind studies published in English and addressing antipsychotic treatment in schizophrenia spectrum disorders (schizophrenia, schizoaffective disorder, and schizophreniform disorder).

Data Extraction

All data were extracted independently by two reviewers (O.A. and C.O.S.).

Outcome Measure: Placebo Response

We focused our analysis on response to placebo treatment alone. Placebo response was assessed using standardized mean change (SMC) from baseline to endpoint in symptom score on the Positive and Negative Syndrome Scale (PANSS) or the Brief Psychiatric Rating Scale (BPRS). Thus, a reduced symptom score from baseline would result in a negative SMC value. We used the Glass effect size estimator for within-subject, single-group pre- versus posttreatment (or crossover) design, defined as the mean change divided by the standard deviation of the pretreatment group (control group) (2327). Note that SMC as an effect size measure for placebo response is a scale-free index of treatment effect on outcome, as defined by Glass (26) and Cohen (27), that can be compared across studies, independent of study design or choice of outcome measure. Because pretreatment standard deviation is not affected by the nature of treatment and correlation between pre- and posttreatment scores, it constitutes the most straightforward metric to use as the point of reference for deriving a scale-free index of treatment effect (26). Potential bias associated with not using the pretreatment standard deviation in calculating SMC was demonstrated by Dunlap et al. (24). When last-observation-carried-forward data were not available, symptom scores assessed at week 12 (or at an earlier study visit) were used. If the authors presented only data on study participants who completed the study, then those data were used in the analysis. Missing values for pretreatment standard deviation were imputed from measurements at endpoint or other available time points (five studies used the BPRS change score).

Potential Contributors to Placebo Response

Potential contributors to placebo response, listed in Table 1, included study year (4, 5, 7, 21), sex (13, 14), age (4, 13, 19), duration of illness (4, 13, 19), baseline symptom severity (5, 13, 20), trial duration (13, 17, 20), washout period (16), treatment setting (4, 16, 18), number of study sites (14, 16), and number of study arms (14). The percentage of patients assigned to receive placebo was added as a post hoc factor based on a recent report highlighting its importance (14).
Study quality rating score was based on the omnibus rating in Kocsis et al. (22), a prespecified study quality factor to be tested in the meta-regression analysis. This omnibus study quality measure provides an overall rating of the quality of an entire study, on a scale ranging from 1, exceptionally poor, to 7, exceptionally good. It takes into account adequacy of description, quality of study design, data analysis, and justification of conclusions.

Meta-Analytical Method

We applied the random-effects model for pooling studies (28), using the inverse of variance weighting based on the variance formula for SMC (25, 29). The heterogeneity of SMC across studies was assessed using the Q statistic (heterogeneity chi-square), and an estimate of between-study variance was calculated. Publication bias was assessed by funnel plots.

Meta-Regression Analysis Models

Following the Cochrane review method, meta-regression analysis based on aggregate data (SMC) was conducted by weighting each study with the inverse of the sum of estimated between-study variance and estimated variance from each individual study (29). The objective of this meta-regression analysis was to verify previous observations (4, 5, 1321) on the potential effects of individual contributors to placebo response. All of these factors were examined independently with and without adjustment for potential confounding variables by regression models. The effect of each patient characteristic and study design factor on SMC was analyzed using a more focused covariate-adjusted regression approach in which the association between each explanatory factor and the response variable (SMC) were considered to be affected by common confounders, as described in equations 1 and 2:
placebo SMC = intercept + an explanatory factor [1]
placebo SMC = intercept + an explanatory factor + common confounders [2]
We included study year as a common confounder in the regression model to determine estimated effect for individual predictor above and beyond the influence of study year. We also applied a full multivariate regression model and a nonparametric data visualization method (locally weighted scatterplot smoothing) to check for outliers and linear model assumption (30).

Study Quality

Variability of placebo SMC between study quality categories was compared using Brown and Forsythe’s test for equal variance, as assessed by absolute deviation from the group median.

Results

Included Studies

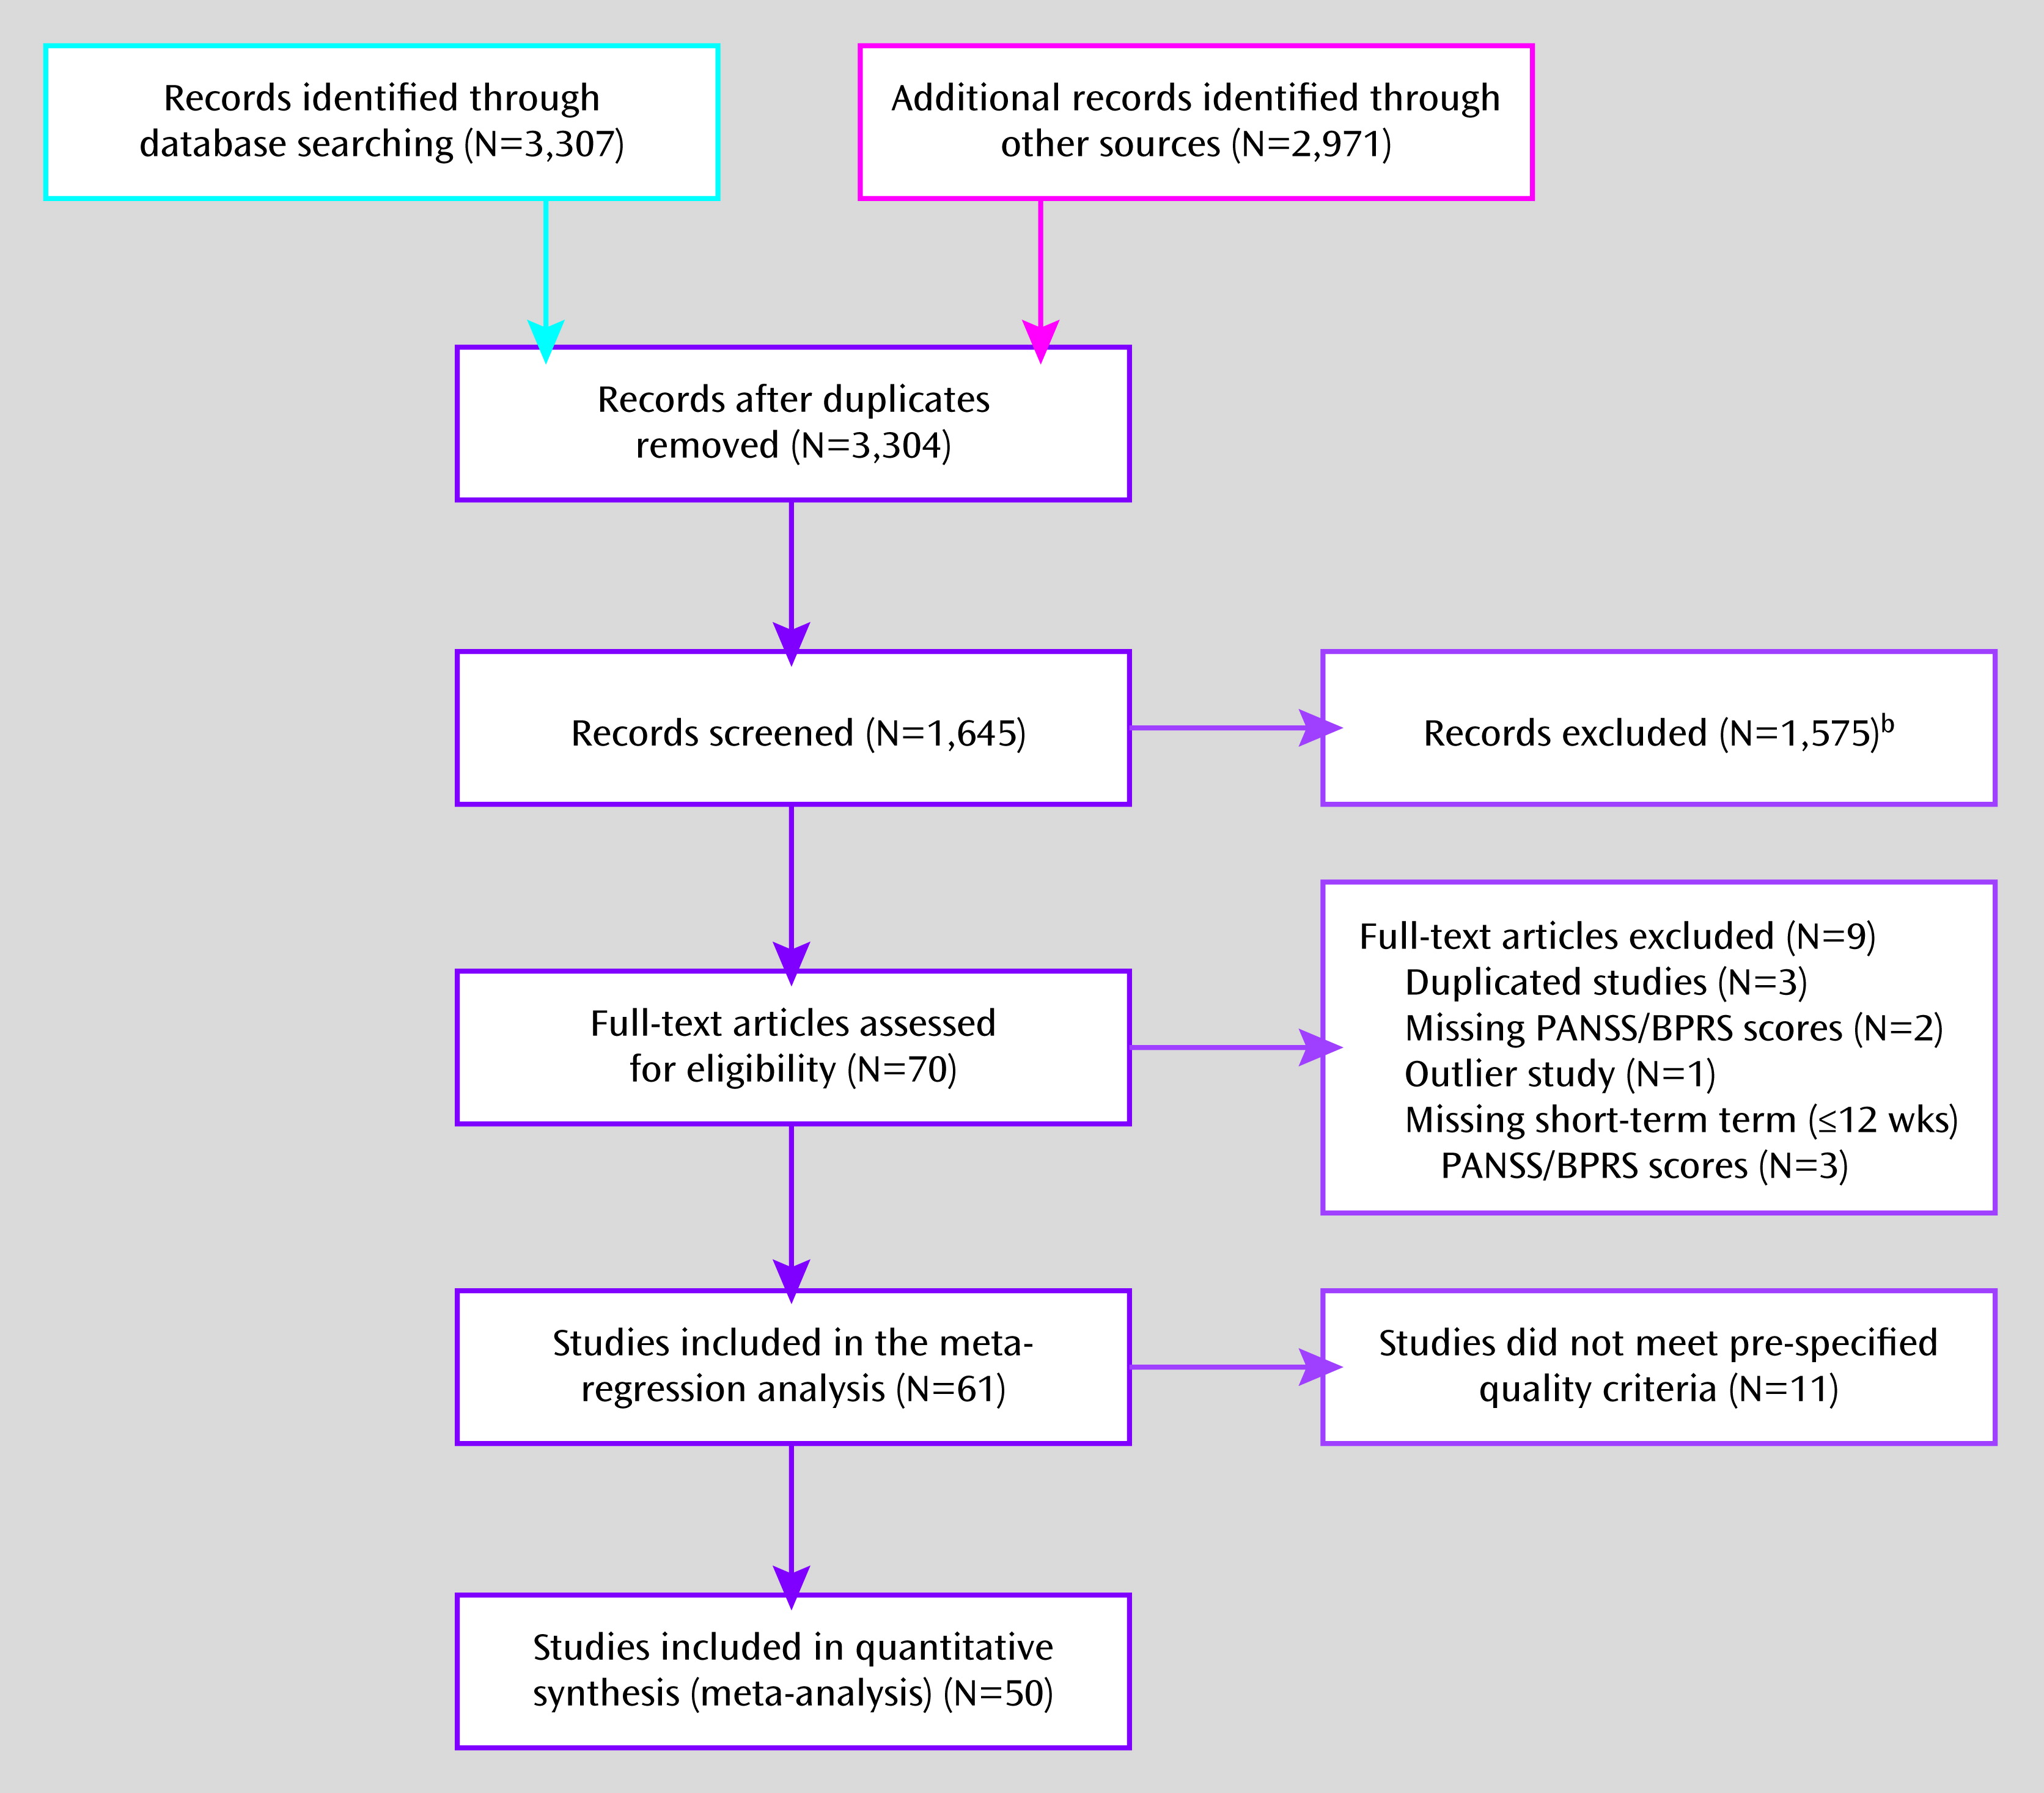
Figure 1 summarizes the selection flow of this systematic review (31). Sixty-one randomized controlled trials, with a total of 14,787 patients (3,698 taking placebo), were included in the meta-regression analysis. These included a mixture of parallel-group randomized controlled trials (N=57) and single-arm crossover randomized controlled trials (N=4) (2225). Of the 61 studies, 11 did not meet the prespecified data quality criterion, which was an omnibus rating ≥3. Therefore, 50 studies were included in the primary estimation of the placebo response SMC. The main design characteristics are summarized in Table S1 in the data supplement that accompanies the online edition of this article.
FIGURE 1. Flow Diagram for the Stages of Data Extraction for a Meta-Regression Analysis of Randomized Controlled Trials of Antipsychoticsa
a PANSS=Positive and Negative Syndrome Scale; BPRS=Brief Psychiatric Rating Scale.
b Studies were excluded because they focused on add-on treatments (N=256), augmentation treatments (N=83), adjunctive medication (N=75), or long-acting injectables (N=138); had children or adolescents as study subjects (N=37); provided no information about the placebo group (N=929); analyzed previously published results (N=12); used rating scales other than the PANSS or BPRS (N=25); did not provide baseline rating scale scores (N=4); or had missing values for the rating scales used. Five long-term studies had available data on week 6 to week 12, which were extracted and included in the analysis.

Primary Outcome Measure: Placebo Response SMC

The placebo response SMC was −0.33 (95% CI=−0.44, −0.22), with significant heterogeneity (Q=387.83, df=49, p<0.001) for the 50 studies meeting adequate study quality (see Figure S1 in the online data supplement). Sensitivity analyses showed a SMC of −0.29 (95% CI=−0.40, −0.19) for all 61 studies (quality score, 1–7) (see Table S2 in the data supplement). The funnel plot was symmetrical, showing no evidence of publication bias for the placebo response (see Figure S2 in the data supplement).

Drug-Placebo Response Relationship

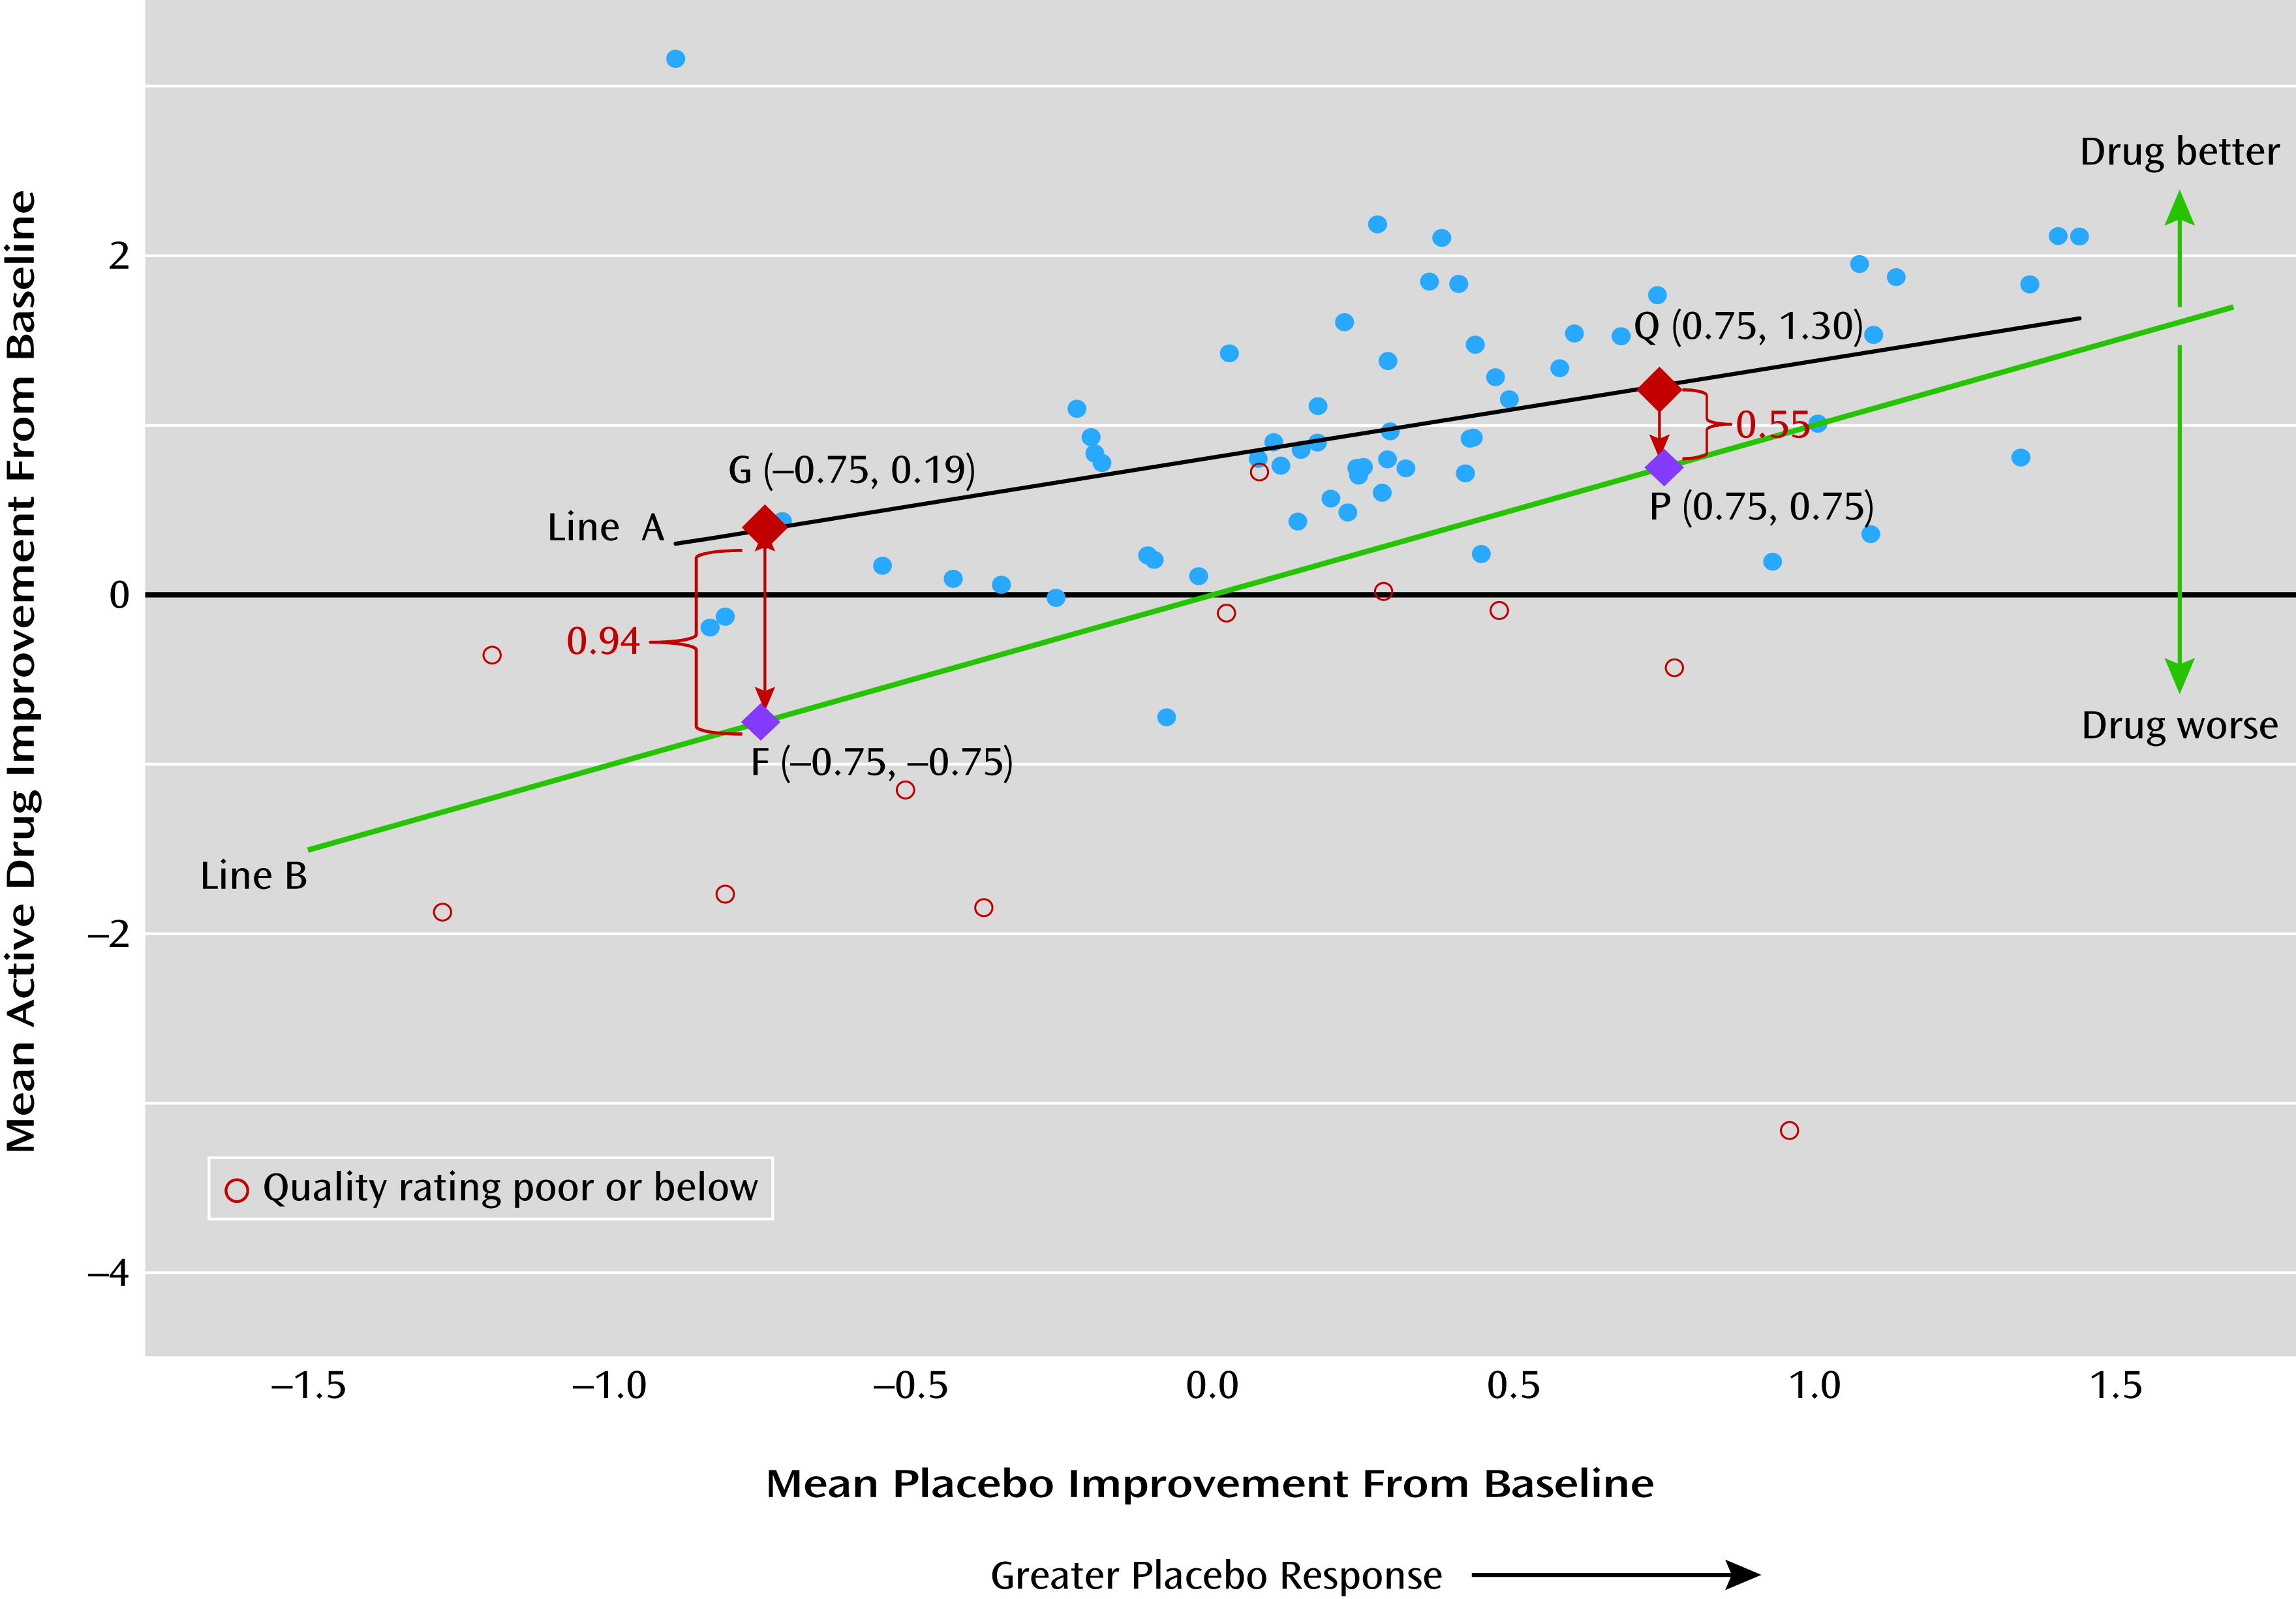
Figure 2 illustrates the relationship between the placebo and drug response. Mean improvement in symptom score is defined as −1×SMC, so a positive value indicates improvement and a negative value indicates worsening in this figure. As indicated by line A in the figure, trials with a larger placebo response were likely to have a greater mean improvement in their drug arms. For example, the drug improvement was 1.3 for trials with a larger mean placebo improvement of 0.75 (point Q on line A), compared with a lower drug improvement of 0.19 for trials showing worsening in the placebo arm (point G on line A). However, the size of the drug-placebo difference (represented by vertical lines F-G and P-Q) was not the same for all levels of placebo response. A larger drug-placebo difference (0.19+0.75=0.94 for F-G) was found for trials with a worsening placebo response (−0.75), compared with a smaller drug-placebo difference (1.3–0.75=0.55, for P-Q) for trials with a larger placebo mean improvement (0.75). Line B in the figure represents the identity line with a slope equal to 1, where the size of the drug response (vertical axis) is equal to the placebo response (horizontal axis). Vertical deviation from this identity line indicates a drug-placebo difference.
FIGURE 2. Impact of Placebo Response Size on Drug-Placebo Differencea
a Mean improvement is defined as −1 × standardized mean change (SMC) from baseline in symptom score, so a positive value indicates improvement and a negative value indicates worsening in this figure. A significant positive association was observed between placebo response and active-drug response (t=9.24, df=58, p<0.001). Line A shows that drug improvement is 1.30 for trials with larger mean placebo improvement (0.75), compared with a lower drug improvement, 0.19, for trials showing worsening in the placebo arm (−0.75). Line B represents the identity line with the slope equal to 1, where the size of drug response (vertical axis) is equal to the placebo response (horizontal axis); vertical deviation from this identity line shows the drug-placebo difference. For fixed multiple-dose studies involving second-generation antipsychotics, we selected the treatment arm based on the optimum dosages as reported in the literature (aripiprazole, 10–30 mg/day; olanzapine, 10–20 mg/day; quetiapine, >250 mg/day; risperidone, 4–6 mg/day; sertindole, 16–24 mg/day; and ziprasidone, 120–160 mg/day) (11). If several arms of a drug fell within its optimum dosage ranges as reported in the literature (e.g., an aripiprazole study with 10 mg/day and 30 mg/day arms), the treatment arm representing the highest dosage was selected. This applies to iloperidone, 12–24 mg/day; sertindole, 20 mg/day; and bifeprunox, 20 mg/day. Eligible studies of lurasidone (80 mg/day compared with placebo), paliperidone (12 mg/day compared with placebo), and asenapine (10 mg/day) were single, fixed-dosage designs.

Study Publication Year

We found that placebo response increased over time, with a SMC of −0.17 (SE=0.15) in the period 1970–1989, −0.28 (SE=0.11) in the period 1990–1999, and −0.39 in the period 2000–2010 (SE=0.11) (regression coefficient=−0.01; χ2=4.30, p=0.038) (see Figure S3 in the online data supplement).

Individual Patient Factors or Study Characteristics

Demographic characteristics.

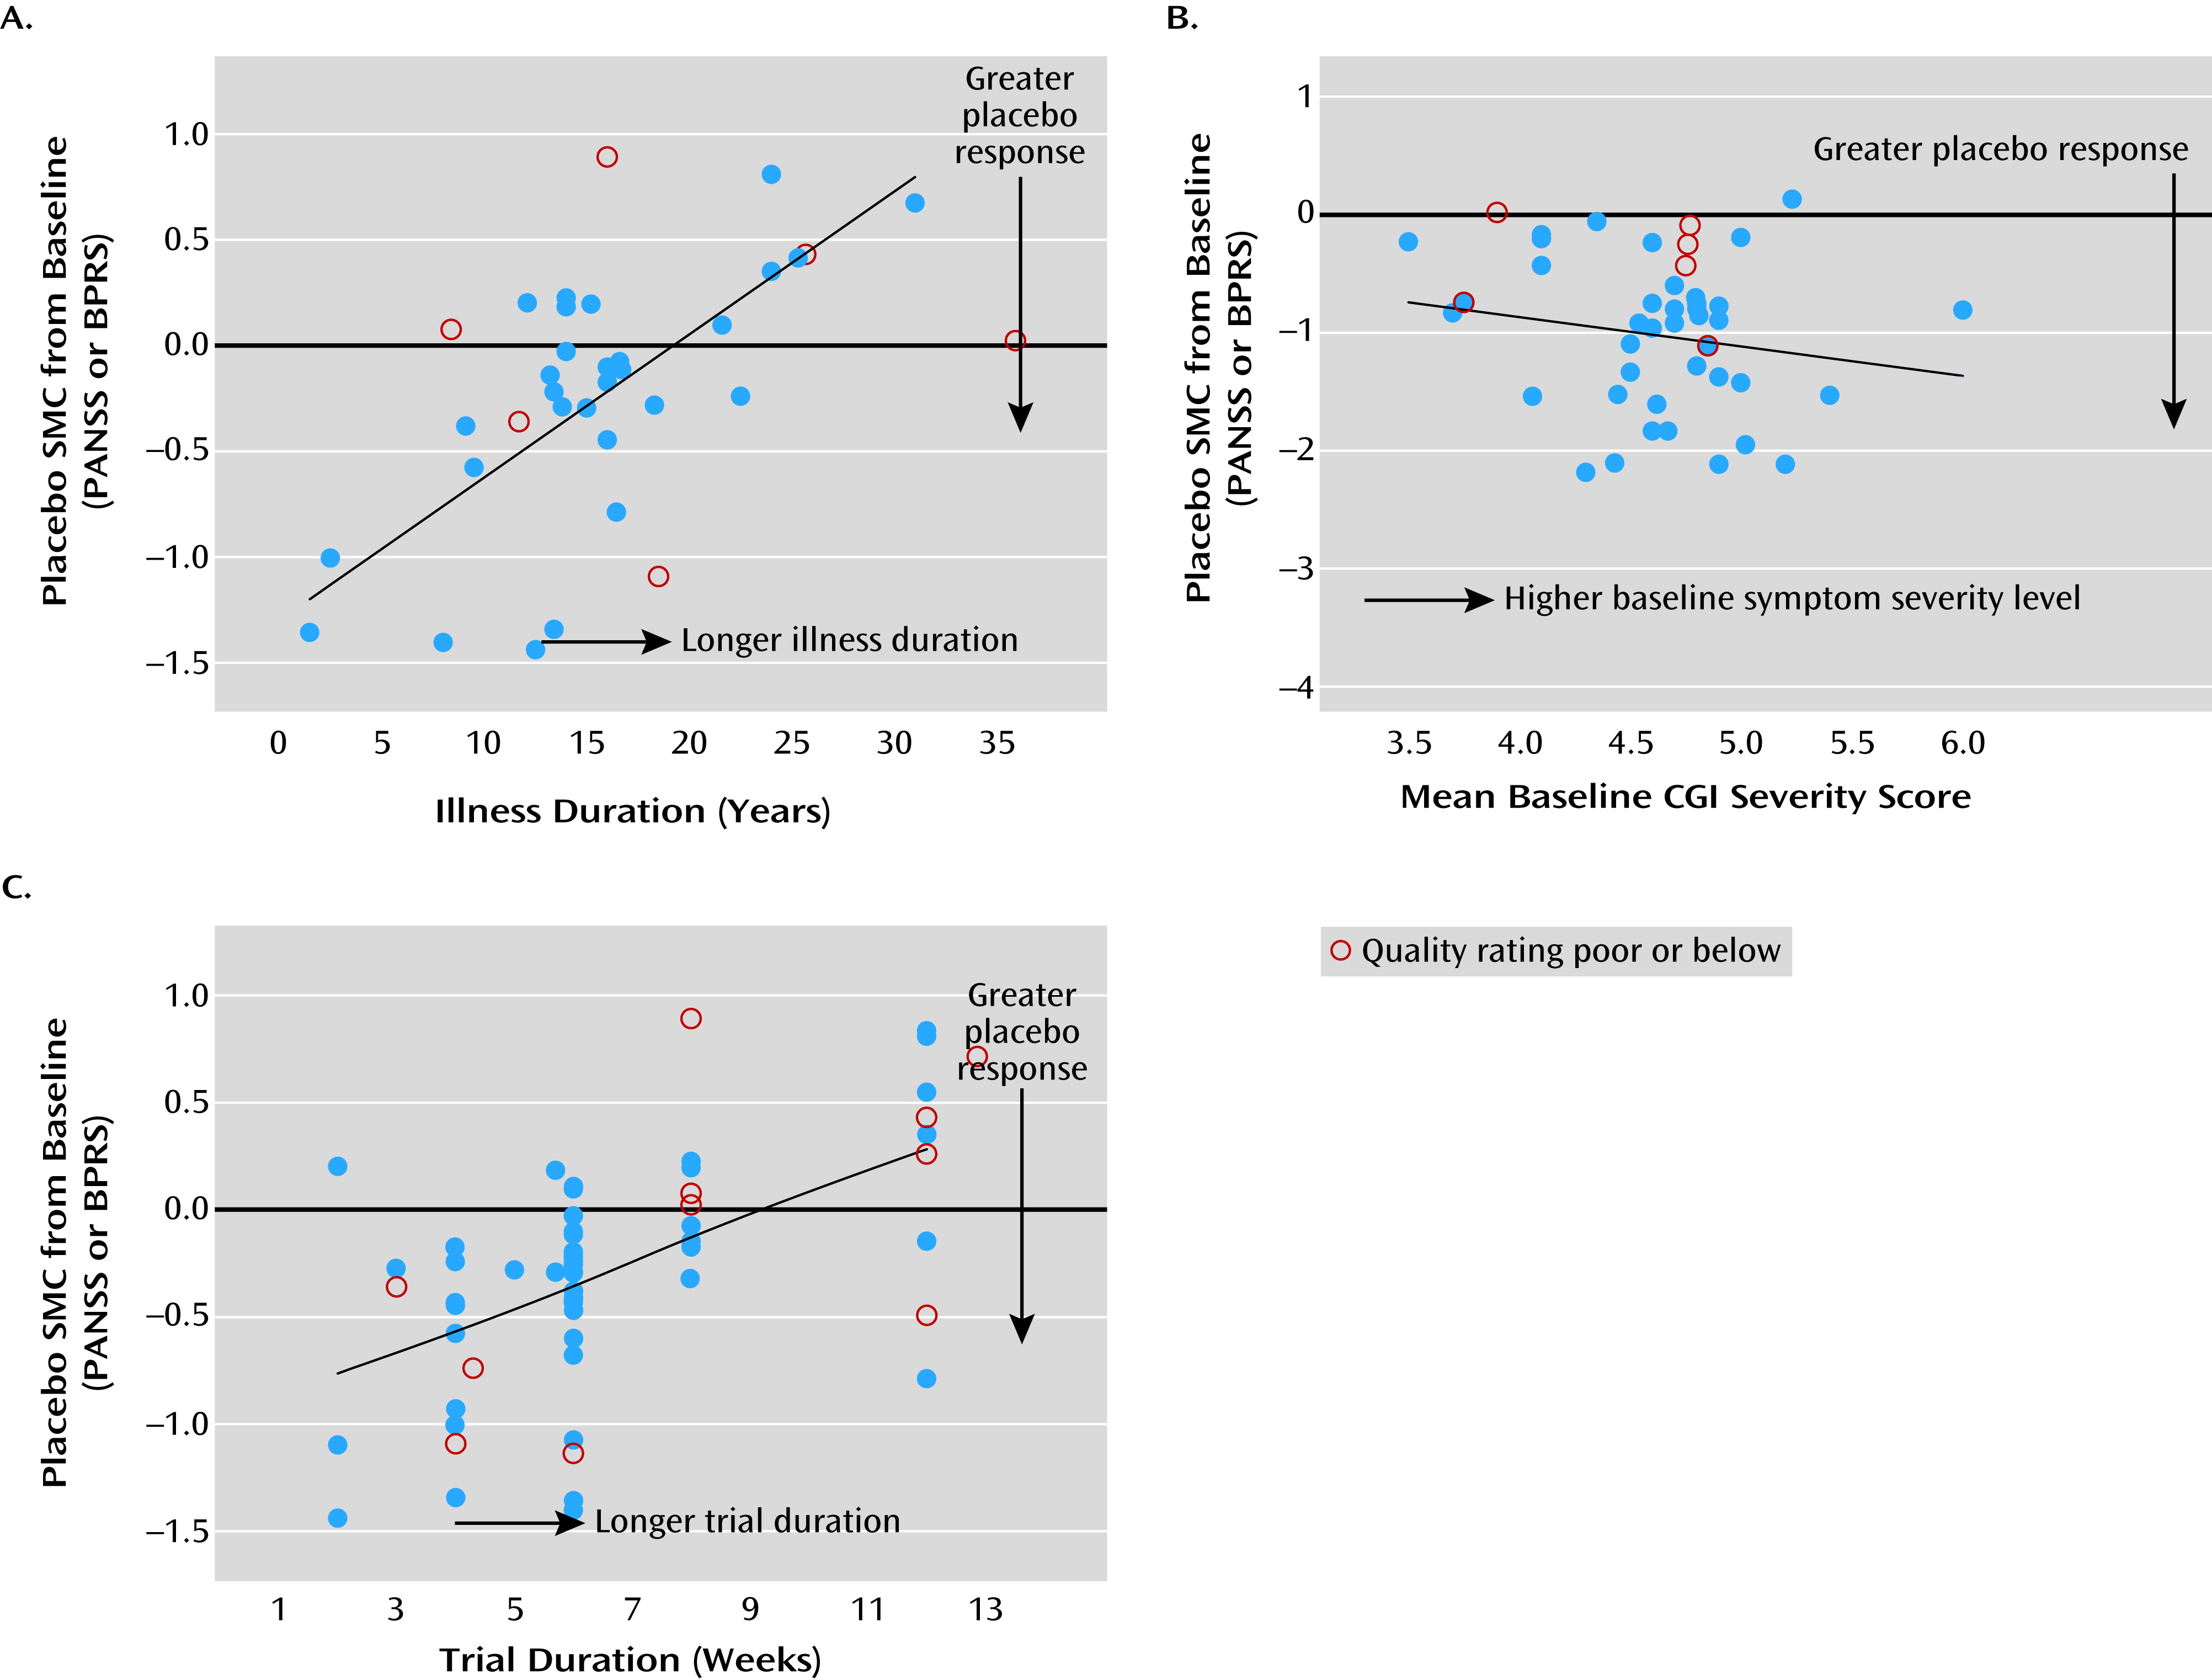
Age and illness duration (as derived from age minus age at onset of illness) (Figure 3A) had significant effects on placebo response (reduction in symptom scores) (Table 1). Greater placebo response was observed in studies with younger patients (regression coefficient=0.04, SE=0.02; χ2=4.36, p=0.037) and shorter illness duration (regression coefficient=0.07, SE=0.02; χ2=14.66, p<0.001). The percentage of male participants assigned to receive placebo, however, was not a significant contributor to placebo response. These results were consistent after accounting for the influence of study year.
FIGURE 3. Placebo Response Compared With Patient Characteristics and Trial Design Factorsa
a In panel A, greater placebo response was observed in studies with shorter illness duration (χ2=14.66, p<0.001). In panel B, greater placebo response was observed in studies with higher baseline Clinical Global Impressions Scale (CGI) severity scores (χ2=10.53, p=0.001). In panel C, greater placebo response was observed in studies with shorter trial duration (slope=0.081; χ2=8.07, p<0.005).

Baseline symptom severity.

Figure 3B shows a greater placebo response (reduction in symptom scores) in studies with higher baseline Clinical Global Impressions Scale (CGI) severity scores (regression coefficient=−0.51, SE=0.15; χ2=10.53, p=0.001) (Table 1), with mean SMC of −0.49 (SE=0.11) for a CGI severity score cutoff at ≥4.75, compared with −0.78 (SE=0.17) for a more extreme cutoff at ≥5.0.

Trial design factors.

Figure 3C shows greater placebo response (reduction in symptom scores) in studies of shorter trial duration, with mean SMC values of −0.55 (SE=0.13), −0.33 (SE=0.08), and 0.08 (SE=0.20), respectively, for trial durations of 2–4 weeks, 5–8 weeks, and 9–12 weeks. Trial duration had a significant independent effect on placebo SMC, above and beyond effects due to study year (regression coefficient=0.08; χ2=8.07, p<0.005) (Table 1). Similar results were obtained when study year was replaced with two other confounders (number of study sites and treatment setting; regression coefficient=0.08; χ2=9.39, p=0.002) found to have changed notably over time and to be highly correlated with study year effect.
In contrast, the number of study sites and treatment setting also showed significant effects on placebo response, but their effects were not independent of study year (Table 1). Greater placebo improvement was found in studies with a larger number of study sites (regression coefficient=−0.01; χ2=5.61, p=0.018) (see Figure S4 in the online data supplement); notably, the number of sites also increased over the years, from a median of two sites before 1990 (range=1–9) to 38 sites in the period 2005–2010 (range=21–101). Lower placebo response was observed for university hospital or Veterans Affairs (VA) sites (one VA site) (SMC=−0.15, 95% CI=−0.46, −0.16, N=11) compared with other treatment settings (community hospital or “not mentioned”) (p=0.016; SMC=−0.69, 95% CI=−0.94, −0.43, N=10), but not when compared with “mixed setting.” Treatment setting was significantly associated with placebo SMC (χ2=8.22, p=0.016). Of note, the percentage of university or VA treatment centers also decreased over time, from 40% before 1997 to 10% from 1997 onward. The effects of the treatment setting and number of study sites on placebo response were not independent of the study year effect.
We also found a lower placebo response in studies with a significantly higher percentage of participants assigned to receive placebo when these were limited to studies from 1998 onward (regression coefficient=0.02; χ2=4.61, p=0.032; see line B in Figure S5 in the online data supplement). For studies published before 1998, a nonlinear trend was observed (see line A in Figure S5 in the data supplement). Placebo response rates and their relationships to the percentage of subjects randomized to placebo were therefore dependent on study year. As shown in Table 1, these results were consistent with the association observed between greater number of treatment arms and greater placebo response (regression coefficient=−0.14; χ2=4.49, p=0.034).
Other trial design factors showed no significant effects on placebo response, with or without accounting for influences of study year. These included the length of the washout period and country (United States compared with other countries) (Table 1).

Study quality.

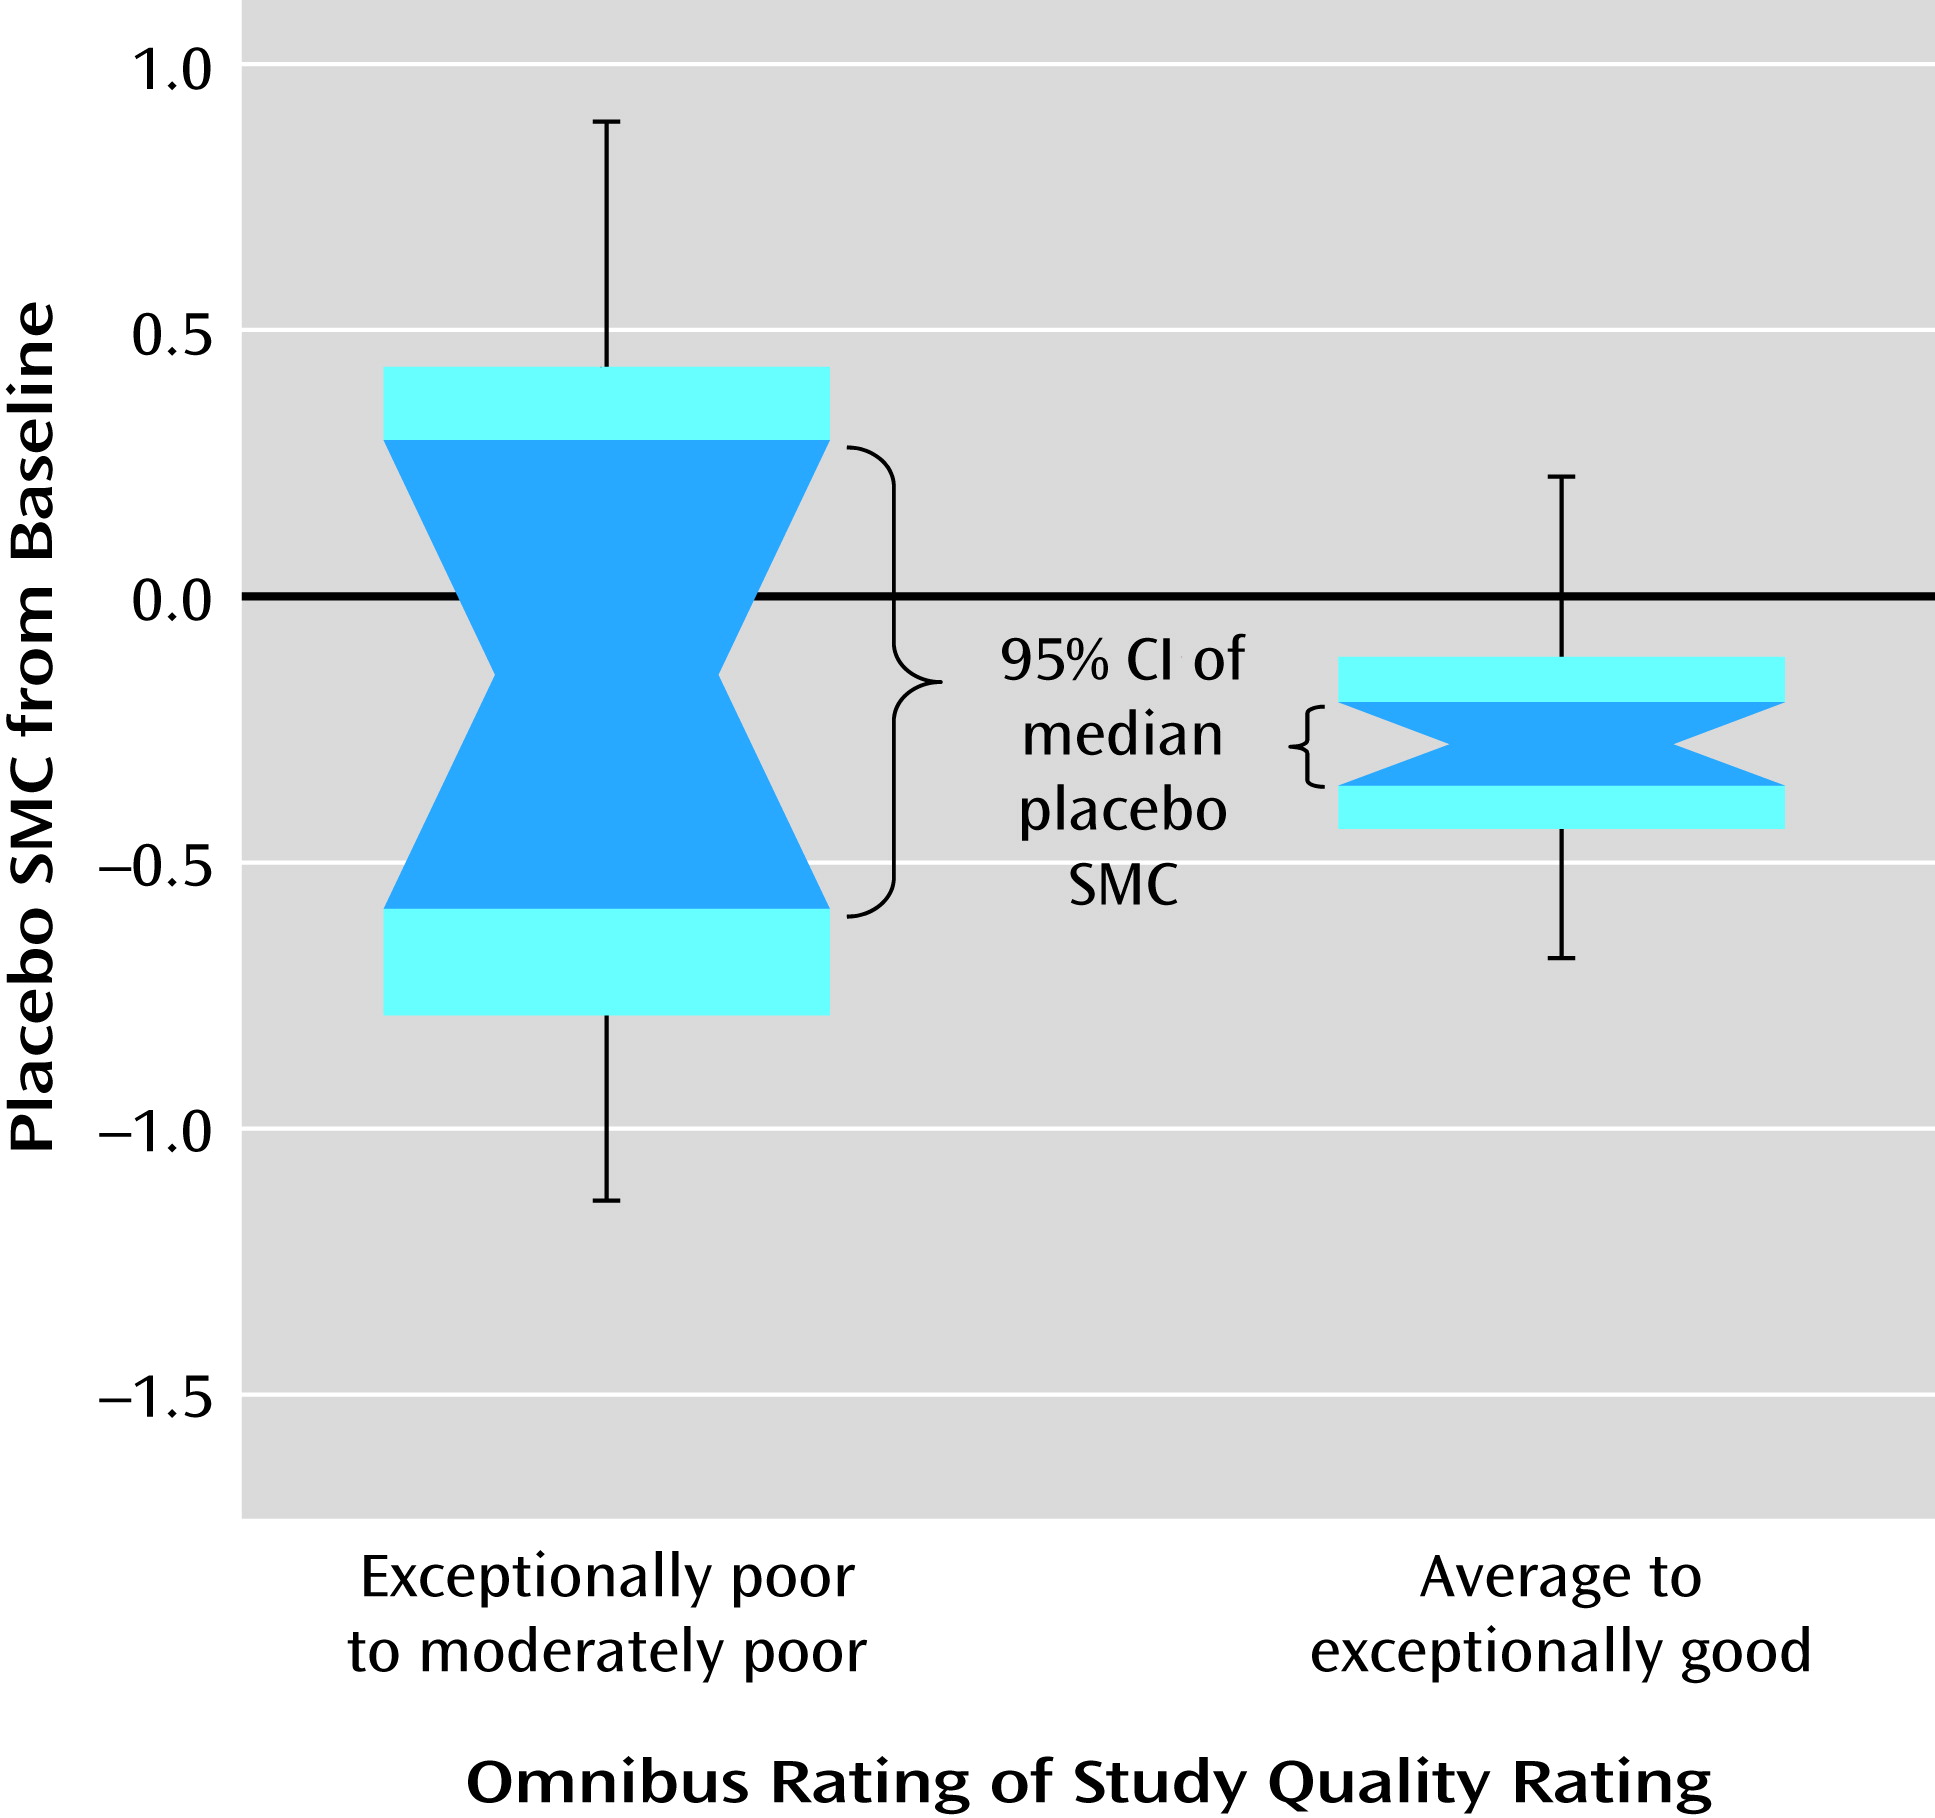
The omnibus rating for overall quality of an entire study (t=7.75, df=60, p<0.001) increased significantly over time. We categorized the 61 studies into lower (exceptionally poor, very poor, or moderately poor) or higher (average, moderately good, very good, or exceptionally good) study quality groups, based on the omnibus rating of overall quality for an entire study. As shown in Figure 4, the lower study quality group had significantly greater variations and hence less consistency in SMC across studies (a larger confidence interval) compared with the higher study quality group (F=9.2, df=1, 59, p=0.004; Brown and Forsythe’s test for equal SMC variance).
FIGURE 4. Placebo Response and Omnibus Rating of Study Quality: Variability Comparisonsa
a The group of lower-quality studies had significantly greater variations and hence less consistency in standardized mean change (SMC) in score on the Positive and Negative Syndrome Scale or the Brief Psychiatric Rating Scale (from baseline) compared with the group with higher-quality studies (F=9.2, df=1, 59, p=0.004; Brown and Forsythe’s test for equal SMC variance as assessed by absolute deviation from the group median). All studies with exceptionally poor to moderately poor ratings were published in the period 1966–1970.
The influence of study quality on mean placebo SMC was not significant after accounting for unequal variability (standard deviation) of SMC in a comparison of the higher and lower study quality groups. The overall mean omnibus rating for study quality was 4.5 (SE=0.2; range=1–7). Both placebo response and study quality increased with study year; the median quality rating was 3 (interquartile range=2–3) for the period 1960–1990, increasing to 6 (interquartile range=5–6) for the period 2000–2010.

Potential contributing factors to the study year influence.

We found that the study year effect on placebo response was explained in part by study design factors, especially with a dramatic increase in the number of study sites and/or a decrease in the percentage of university or VA sites (treatment setting) over time. Because strong collinearity existed between study year and these two design factors, the effects of study year could almost totally be predicted by either of these variables. Study year effect on placebo response was found to be independent of trial duration and patient characteristics (Table 1).

Discussion

Our findings showed significant mean placebo improvement from baseline to endpoint (2 to 12 weeks), with a mean SMC of −0.33 (95% CI=−0.44, −0.22; N=50 studies). Smaller drug-placebo difference was associated with greater level of placebo response, and drug and placebo responses were positively correlated. Given the modest efficacy and tolerability issues associated with antipsychotics, a placebo improvement effect size of about 0.3 would make detecting drug efficacy signal challenging.
We also found a smaller drug-placebo difference in studies with greater placebo response (Figure 2). There were significant heterogeneities in the magnitude of placebo response and study quality across studies. Both placebo response and study quality increased significantly over time. A number of significant factors not previously empirically documented that affect placebo improvement effect size were identified. Lower age, shorter duration of illness, greater baseline symptom severity, and shorter trial duration were significantly associated with greater placebo response, while country (United States compared with others) did not, with or without statistical adjustment for study year influence. More study sites, fewer university or VA treatment settings, a lower percentage of participants assigned to receive placebo, or more study arms (if limited to studies since 1998) were associated with greater placebo response, but these were not independent of publication year. Study quality affected the variability but not mean levels of placebo response, thus affecting the reproducibility of effect size. To our knowledge, this is the first study to systematically evaluate the impact of study quality on the mean level as well as the variability of placebo response across trials.
We corroborated the previous observations that studies of shorter trial duration, lower age, or shorter duration of illness are vulnerable to substantial placebo response (5, 7, 13). We also confirmed earlier findings that placebo response increased over the study years from 1993 to 2010 (4, 5, 7, 21), and a greater placebo improvement was observed in studies with more study sites (14, 16), fewer academic treatment settings (18), and more study arms in studies since 1998 (14). Greater placebo response was associated with higher mean baseline symptom scores (5, 13), possibly as a result of a regression-to-mean effect (32, 33). Interestingly, Chen et al. (5) reported a significant association between change in score on the PANSS from baseline in both placebo and treated groups, with correlations at least two to three times higher in the treated groups. Improvement in study quality over time might reflect better trial methodologies or better reporting of randomized controlled trials, as evidenced by a reduction in the variability of the SMC from baseline. This could potentially improve the reproducibility of effect sizes across independent studies.
Our findings highlight the complex nature of the current trend of a rising placebo response, its association with various intrinsic factors, and correlated changes over time. The influence of study publication year and related period effects (before or after 1993–1997) on placebo response and study quality were significant, possibly reflecting a shift in patient population, trial methodology, trial execution, or reporting of psychiatric trials over the years. Because these constituted important sources of potential confounding effects, the identification of contributors to placebo response should be adjusted for study year and related period effects for less biased and more generalizable results across time. As shown in Figure S3 in the online data supplement, observed placebo response patterns may be dependent on the time period and study year. Leucht et al. (7), for example, included study publication year as a moderator in a meta-regression analysis of atypical antipsychotics compared with placebo and reported diminished drug-placebo differences in the reduction of symptom scores.
Because potential contributors to placebo response are generally not independent of one another, the choice of explanatory variables as determined by the usual stepwise method is generally unstable and can vary across samples and subsamples (34). Furthermore, the stepwise method runs the inflated risk of detecting chance features in the data and can frequently lead to the selection of different predictors when applied to new data samples. This could especially be the case when the ratio of number of studies to number of predictors is small (35), as is common in meta-regression analyses of aggregate data. In this study, we applied a covariate-adjusted regression approach to determine effect for individual predictor on placebo response, which remained stable even with different selections of correlated confounders (equation 2).
As shown in our analysis, the effect of trial duration was found to be consistent with four different sets of confounders. The regression coefficient for trial duration was 0.081 after accounting for study year as the only confounder in a parsimonious model; 0.079 after replacing study year with treatment setting and number of study sites as confounders; and 0.133 in the full model after accounting for study year plus all six other potential confounders. Notably, the estimated effect of trial duration on placebo response remained the same after dropping study year from the full model.
While study year can be considered a common marker associated with many important factors affecting placebo response, it is important to identify additional predictors above and beyond those influenced by study year. This meta-regression analysis found that age, duration of illness, baseline symptom severity, and trial duration had significant effects on placebo response, independent of the effect of study year.
Various intrinsic factors may influence the trend of rising placebo response. For example, the more noticeable extrapyramidal symptoms associated with conventional antipsychotics conceivably could make it easier for investigators or study participants to guess treatment assignment, thus attenuating placebo response. Patients with a shorter duration of illness may be more susceptible to placebo response because of heightened expectations based on treatment earlier in the course of illness. Greater placebo response among those with higher baseline positive or total symptom severity may reflect the nonspecific benefits of receiving more frequent assessments and attention in a trial (36) or the immediate stabilization effect of hospitalization, as required in many studies (37).
Limitations of our analysis include the use of response data from the placebo group alone in the meta-regression analysis. Although drug-placebo difference constitutes the direct measure of efficacy signals, placebo response has been shown to be the major cause underlying the diminished differences between drug and placebo responses (21). This in turn contributes to the rising failures of randomized controlled trials in schizophrenia (410, 21). Our findings showed the magnitude of placebo response to be positively associated with the magnitude of drug response, but the magnitude of drug-placebo differences were not the same for all placebo response levels. While there have been many thorough reviews of mean drug-placebo difference, only limited data are available on the evaluation of placebo response itself, and with inconclusive results. There is a tremendous need for a thorough review of placebo response without confounding by active drug effects. Because the mechanisms of action, tolerability, and side effect profiles differ markedly among antipsychotic agents, drug response is a major determinant of the magnitude of drug-placebo differences. This analysis incorporated studies involving 23 different antipsychotic agents. Investigations of their respective contributions to the efficacy signals are useful but need to be addressed by a patient-level meta-analysis (38). Finally, the use of a pooled active drug arm (from 146 active treatment arms on 23 antipsychotic agents in this database) as one control group would add substantial noise to the analysis of drug-placebo response.
In summary, this meta-analysis identified a broader range of study design parameters as potential contributors to placebo response in clinical trials of antipsychotic drugs in schizophrenia, and perhaps in psychopharmacology trials in general. Our findings argue for trials to be longer in duration, with a minimum period of 6 weeks, as well as for caution when expanding the number of investigative sites beyond 40, especially in nonacademic settings with limited clinical research experience or when incorporating unusually high baseline severity in study inclusion criteria (CGI severity score >5) (33). Our results also suggest that greater consideration be given to study design factors, such as the number of treatment arms, features of investigative sites, and treatment settings, as well as to patient characteristics, such as illness duration.
Footnotes

Dr. Agid was a principal investigator for a Pfizer-sponsored study of ziprasidone and risk factors for metabolic syndrome; he has also received grant support or funding from or has served as a consultant for Janssen-Ortho (Johnson & Johnson), Eli Lilly U.S., Eli Lilly Canada, Novartis, Sepracor U.S., and Sunovion U.S. Dr. Siu has served as a consultant for Pfizer, Sunovion U.S. (Dainippon Sumitomo Pharma/Sepracor), Memory Pharmaceutical (Roche Laboratories), and Wyeth (Pfizer). Dr. Potkin has received grant support, funding, or honoraria or served as a consultant for the American Psychiatric Association, the Alzheimer’s Association, Baxter, Baylor College of Medicine, Bioline, Bristol-Myers Squibb, Cephalon, Cortex, Eisai, Eli Lilly, Forest Laboratories, Genentech, Janssen Pharmaceutical, Lundbeck, Merck, National Institute on Alcohol Abuse and Alcoholism, National Institute of Biomedical Imaging and Bioengineering, NIH National Center for Research Resources, Novartis, Organon, Otsuka, Pfizer Wyeth, Shire Development, Solvay, Sunovion, Roche, Takeda Pharmaceuticals International, Takeda Global Research and Development, University of Southern California, University of California San Francisco, and University of California San Diego. Dr. Kapur has received grant support from or served as consultant or speaker for AstraZeneca, Bioline, Bristol-Myers Squibb, Eli Lilly, GlaxoSmithKline, Janssen (Johnson & Johnson), Lundbeck, NeuroSearch, Otsuka, Pfizer, Roche, Servier, and Solvay Wyeth. Dr. Watsky and Dr. Vanderburg are full-time employees of Pfizer, Inc. Dr. Zipursky has served as a consultant to Roche, served on advisory panels for Amgen, Roche, and Sunovion, and received research contract support from Roche. Dr. Remington has received research support from the Canadian Diabetes Association, the Canadian Institutes of Health Research, Medicure, Neurocrine Biosciences, Novartis Canada, Research Hospital Fund–Canada Foundation for Innovation, and the Schizophrenia Society of Ontario and has served as a consultant or speaker for Novartis, Laboratorios Farmacéuticos Rovi, and Roche.
Editorial support was provided by Cynthia O. Siu, Ph.D., and Cecilia Rosenblatt, B.Pharm., of Data Power, Inc., and was funded by Pfizer, Inc.
Pfizer was not involved in the design and conduct of the meta-analysis, or in the systematic review, collection, management, and analysis of the data.

Supplementary Material

Supplementary Material (1335_ds001.pdf)

References

1.
Zipursky RB, Darby P: Placebo-controlled studies in schizophrenia: ethical and scientific perspectives: an overview of conference proceedings. Schizophr Res 1999; 35:189–200
2.
Temple RJ: When are clinical trials of a given agent vs placebo no longer appropriate or feasible? Control Clin Trials 1997; 18:613–620
3.
Laughren TP: The scientific and ethical basis for placebo-controlled trials in depression and schizophrenia: an FDA perspective. Eur Psychiatry 2001; 16:418–423
4.
Kemp AS, Schooler NR, Kalali AH, Alphs L, Anand R, Awad G, Davidson M, Dubé S, Ereshefsky L, Gharabawi G, Leon AC, Lepine JP, Potkin SG, Vermeulen A: What is causing the reduced drug-placebo difference in recent schizophrenia clinical trials and what can be done about it? Schizophr Bull 2010; 36:504–509
5.
Chen YF, Wang SJ, Khin NA, Hung HMJ, Laughren TP: Trial design issues and treatment effect modeling in multi-regional schizophrenia trials. Pharm Stat 2010; 9:217–229
6.
Kinon BJ, Potts AJ, Watson SB: Placebo response in clinical trials with schizophrenia patients. Curr Opin Psychiatry 2011; 24:107–113
7.
Leucht S, Arbter D, Engel RR, Kissling W, Davis JM: How effective are second-generation antipsychotic drugs? A meta-analysis of placebo-controlled trials. Mol Psychiatry 2009; 14:429–447
8.
Laporte JR, Figueras A: Placebo effects in psychiatry. Lancet 1994; 344:1206–1209
9.
Cressey D: Traditional drug-discovery model ripe for reform. Nature 2011; 471:17–18
10.
Nutt D, Goodwin G: ECNP Summit on the future of CNS drug research in Europe 2011: report prepared for ECNP by David Nutt and Guy Goodwin. Eur Neuropsychopharmacol 2011; 21:495–499
11.
Leucht S, Corves C, Arbter D, Engel RR, Li C, Davis JM: Second-generation versus first-generation antipsychotic drugs for schizophrenia: a meta-analysis. Lancet 2009; 373:31–41
12.
Pilla Reddy V, Kozielska M, Johnson M, Vermeulen A, de Greef R, Liu J, Groothuis GMM, Danhof M, Proost JH: Structural models describing placebo treatment effects in schizophrenia and other neuropsychiatric disorders. Clin Pharmacokinet 2011; 50:429–450
13.
Welge JA, Keck PE: Moderators of placebo response to antipsychotic treatment in patients with schizophrenia: a meta-regression. Psychopharmacology (Berl) 2003; 166:1–10
14.
Mallinckrodt CH, Zhang L, Prucka WR, Millen BA: Signal detection and placebo response in schizophrenia: parallels with depression. Psychopharmacol Bull 2010; 43:53–72
15.
Leucht S, Wahlbeck K, Hamann J, Kissling W: New generation antipsychotics versus low-potency conventional antipsychotics: a systematic review and meta-analysis. Lancet 2003; 361:1581–1589
16.
McMahon RP, Kelly DL, Boggs DL, Li L, Hu Q, Davis JM, Carpenter WT: Feasibility of reducing the duration of placebo-controlled trials in schizophrenia research. Schizophr Bull 2008; 34:292–301
17.
Kane JM, Leucht S: Unanswered questions in schizophrenia clinical trials. Schizophr Bull 2008; 34:302–309
18.
Dunlop BW, Thase ME, Wun CC, Fayyad R, Guico-Pabia CJ, Musgnung J, Ninan PT: A meta-analysis of factors impacting detection of antidepressant efficacy in clinical trials: the importance of academic sites. Neuropsychopharmacology 2012; 37:2830–2836
19.
Leucht S, Heres S, Hamann J, Kane JM: Methodological issues in current antipsychotic drug trials. Schizophr Bull 2008; 34:275–285
20.
Potkin S, Agid O, Siu C, Watsky E, Vanderburg D, Remington G: Placebo response trajectories in short-term and long-term antipsychotic trials in schizophrenia. Schizophr Res 2011; 132:108–113
21.
Merlo-Pich E, Alexander RC, Fava M, Gomeni R: A new population-enrichment strategy to improve efficiency of placebo-controlled clinical trials of antidepressant drugs. Clin Pharmacol Ther 2010; 88:634–642
22.
Kocsis JH, Gerber AJ, Milrod B, Roose SP, Barber J, Thase ME, Perkins P, Leon AC: A new scale for assessing the quality of randomized clinical trials of psychotherapy. Compr Psychiatry 2010; 51:319–324
23.
Becker BJ: Synthesizing standardized mean-change measures. Br J Math Stat Psychol 1988; 41:257–278
24.
Dunlap WP, Cortina JM, Vaslow JB, Burke MJ: Meta-analysis of experiments with matched groups or repeated measures designs. Psychol Methods 1996; 1:170–177
25.
Morris SB: Distribution of the standardized mean change effect size for meta-analysis on repeated measures. Br J Math Stat Psychol 2000; 53:17–29
26.
Glass GV: Integrating findings: the meta-analysis of research, in Review of Research in Education, vol 5. Edited by, Schulman LS. Itasca, Ill, FE Peacock, 1977
27.
Cohen J: Statistical Power Analysis for the Behavioral Sciences, 2nd ed. Hillsdale, NJ, Lawrence Erlbaum Associates, 1988
28.
DerSimonian R, Laird N: Meta-analysis in clinical trials. Control Clin Trials 1986; 7:177–188
29.
Higgins JPT, Green S: Cochrane Handbook for Systematic Reviews of Interventions 4.2.6, in The Cochrane Library. Chichester, UK, Wiley & Sons, 2006
30.
Cleveland WS, Devlin SJ: Locally-weighted regression: an approach to regression analysis by local fitting. J Am Stat Assoc 1988; 83:596–610
31.
West S, King V, Carey TS, Lohr KN, McKoy N, Sutton SF, Lux L: Systems to Rate the Strength of Scientific Evidence (Evidence Report/Technology Assessment No 47, AHRQ Publication No 02-E016). Rockville, Md, Agency for Healthcare Research and Quality, April 2002
32.
Allison DB, Loebel AD, Lombardo I, Romano SJ, Siu CO: Understanding the relationship between baseline BMI and subsequent weight change in antipsychotic trials: effect modification or regression to the mean? Psychiatry Res 2009; 170:172–176
33.
Yudkin PL, Stratton IM: How to deal with regression to the mean in intervention studies. Lancet 1996; 347:241–243
34.
Altman DG, Andersen PK: Bootstrap investigation of the stability of a Cox regression model. Stat Med 1989; 8:771–783
35.
Derksen S, Keselman HJ: Backward, forward, and stepwise automated subset selection algorithms: frequency of obtaining authentic and noise variables. Br J Math Stat Psychol 1992; 45:265–282
36.
Patel NC, Crismon ML, Miller AL, Johnsrud MT: Drug adherence: effects of decreased visit frequency on adherence to clozapine therapy. Pharmacotherapy 2005; 25:1242–1247
37.
Taiminen T, Syvalahti E, Saarijarvi S, Niemi H, Lehto H, Ahola V, Salokangas RKR: Prediction of positive placebo response among chronic schizophrenic outpatients. J Nerv Ment Dis 1996; 184:109–113
38.
Fournier JC, DeRubeis RJ, Hollon SD, Dimidjian S, Amsterdam JD, Shelton RC, Fawcett J: Antidepressant drug effects and depression severity: a patient-level meta-analysis. JAMA 2010; 303:47–53

Information & Authors

Information

Published In

Go to American Journal of Psychiatry
American Journal of Psychiatry
Pages: 1335 - 1344
PubMed: 23896810

History

Received: 8 March 2012
Revision received: 10 October 2012
Revision received: 21 January 2013
Accepted: 11 March 2013
Published online: 1 November 2013
Published in print: November 2013

Authors

Details

Ofer Agid, M.D.
From the Centre for Addiction and Mental Health, Toronto; the Department of Quantitative Methodology, Data Power, Inc., Ringoes, N.J.; UCI Medical Center–UCI Brain Imaging Center, Orange, Calif.; Institute of Psychiatry, London; Pfizer Neuroscience, New York; and the Department of Psychiatry, McMaster University, Hamilton, Ontario.
Cynthia O. Siu, Ph.D.
From the Centre for Addiction and Mental Health, Toronto; the Department of Quantitative Methodology, Data Power, Inc., Ringoes, N.J.; UCI Medical Center–UCI Brain Imaging Center, Orange, Calif.; Institute of Psychiatry, London; Pfizer Neuroscience, New York; and the Department of Psychiatry, McMaster University, Hamilton, Ontario.
Steven G. Potkin, M.D.
From the Centre for Addiction and Mental Health, Toronto; the Department of Quantitative Methodology, Data Power, Inc., Ringoes, N.J.; UCI Medical Center–UCI Brain Imaging Center, Orange, Calif.; Institute of Psychiatry, London; Pfizer Neuroscience, New York; and the Department of Psychiatry, McMaster University, Hamilton, Ontario.
Shitij Kapur, M.B.B.S., Ph.D.
From the Centre for Addiction and Mental Health, Toronto; the Department of Quantitative Methodology, Data Power, Inc., Ringoes, N.J.; UCI Medical Center–UCI Brain Imaging Center, Orange, Calif.; Institute of Psychiatry, London; Pfizer Neuroscience, New York; and the Department of Psychiatry, McMaster University, Hamilton, Ontario.
Eric Watsky, M.D.
From the Centre for Addiction and Mental Health, Toronto; the Department of Quantitative Methodology, Data Power, Inc., Ringoes, N.J.; UCI Medical Center–UCI Brain Imaging Center, Orange, Calif.; Institute of Psychiatry, London; Pfizer Neuroscience, New York; and the Department of Psychiatry, McMaster University, Hamilton, Ontario.
Douglas Vanderburg, M.D., M.P.H.
From the Centre for Addiction and Mental Health, Toronto; the Department of Quantitative Methodology, Data Power, Inc., Ringoes, N.J.; UCI Medical Center–UCI Brain Imaging Center, Orange, Calif.; Institute of Psychiatry, London; Pfizer Neuroscience, New York; and the Department of Psychiatry, McMaster University, Hamilton, Ontario.
Robert B. Zipursky, M.D.
From the Centre for Addiction and Mental Health, Toronto; the Department of Quantitative Methodology, Data Power, Inc., Ringoes, N.J.; UCI Medical Center–UCI Brain Imaging Center, Orange, Calif.; Institute of Psychiatry, London; Pfizer Neuroscience, New York; and the Department of Psychiatry, McMaster University, Hamilton, Ontario.
Gary Remington, M.D., Ph.D.
From the Centre for Addiction and Mental Health, Toronto; the Department of Quantitative Methodology, Data Power, Inc., Ringoes, N.J.; UCI Medical Center–UCI Brain Imaging Center, Orange, Calif.; Institute of Psychiatry, London; Pfizer Neuroscience, New York; and the Department of Psychiatry, McMaster University, Hamilton, Ontario.

Notes

Presented at the 48th annual meeting of the American College of Neuropsychopharmacology, Hollywood, Fla., Dec. 6–10, 2009; and at the 163rd annual meeting of the American Psychiatric Association, New Orleans, May 22–26, 2010.
Address correspondence to Dr. Agid ([email protected]).

Metrics & Citations

Metrics

Citations

Export Citations

If you have the appropriate software installed, you can download article citation data to the citation manager of your choice. Simply select your manager software from the list below and click Download.

For more information or tips please see 'Downloading to a citation manager' in the Help menu.

Format
Citation style
Style
Copy to clipboard

View Options

View options

PDF/EPUB

View PDF/EPUB

Login options

Already a subscriber? Access your subscription through your login credentials or your institution for full access to this article.

Personal login Institutional Login Open Athens login
Purchase Options

Purchase this article to access the full text.

PPV Articles - American Journal of Psychiatry

PPV Articles - American Journal of Psychiatry

Not a subscriber?

Subscribe Now / Learn More

PsychiatryOnline subscription options offer access to the DSM-5-TR® library, books, journals, CME, and patient resources. This all-in-one virtual library provides psychiatrists and mental health professionals with key resources for diagnosis, treatment, research, and professional development.

Need more help? PsychiatryOnline Customer Service may be reached by emailing [email protected] or by calling 800-368-5777 (in the U.S.) or 703-907-7322 (outside the U.S.).

Media

Figures

Other

Tables

Share

Share

Share article link

Share