Major depressive disorder is a common psychiatric disorder characterized by both affective and cognitive symptoms. A core symptom of major depression that represents the depressive trait is an impairment in mood regulation (
1,
2), which can be operationally defined as a vulnerability to develop a depressive state and an inability to disengage from that state (
3). Investigation of structural abnormalities within the neural circuitry of mood regulation that may underlie this impairment could lead to the identification of relevant trait markers of major depression.
Mood regulation is mediated by an interaction between the paralimbic cortex (i.e., orbitofrontal, cingulate, insular, parahippocampal, and temporopolar cortices) and limbic structures, such as the amygdala (
4). Based on both functional and structural aberrations in major depression, neural models of the disorder indicate that impairment in mood regulation results from failing top-down control caused by deficient corticolimbic interactions (
1,
2,
5,
6). It remains unclear whether structural abnormalities of the paralimbic cortex may account for this mood regulation deficit. In particular, to our knowledge it has not been investigated whether potential structural differences of the paralimbic cortex are evident early in the course of the disease and whether they could serve as a trait marker of depression.
Histological postmortem research in major depression indicates that structural abnormalities in the paralimbic cortex may appear in the form of differences in cortical thickness, as shown by less than normal thickness within the orbitofrontal (
7,
8) and anterior cingulate cortices (
9,
10). However, postmortem studies leave open whether these differences in cortical thickness are a cause or a consequence of major depression, or treatment effects, and whether they reflect the acute state of depression or an underlying neurobiological trait of depression (
11). Recent neuroimaging techniques, which allow the analysis of cortical thickness in vivo, might be able to answer these questions, but studies on cortical thickness in adult patients with major depression have been sparse until now.
To our knowledge, Järnum and colleagues conducted the only published study of cortical thickness within adult patients with major depression (
12). They found less than normal thickness of the orbitofrontal and insular cortices in acutely depressed patients, most of whom were taking antidepressant medication (
12). Unpublished data showed a thinner anterior midcingulate cortex in adults with remitted depression than in healthy subjects (M. Nagl, 2010). These results confirm that paralimbic regions are indeed structurally different in patients with major depression, but the design of the studies leaves the aforementioned questions still unanswered. Peterson and colleagues investigated unaffected persons at greater familial risk for developing depression and found large areas of cortical thinness at the lateral aspect of the right hemisphere and medial aspects of the left hemisphere (
13). The widespread differences in cortical thickness seem to represent a vulnerability far beyond the domain of mood regulation, however (
13), leaving the exact contribution of paralimbic regions to the depressive trait also unclear.
Results from studies in other age categories may shed light on the temporal path of cortical thickness differences over the course of the disease. Fallucca and colleagues assessed cortical thickness in children and adolescents with major depression and found some regions of greater than normal thickness and some regions with less thickness (
14). Within the paralimbic cortex, the differences were limited to greater thickness of the temporal poles (
14). This study compared only relatively large, predefined anatomical parcellations, however, and so it may have missed smaller regions of the paralimbic cortex showing thickness differences. Regardless, that study illustrates that cortical differences in major depression may appear in the form of greater than normal thickness and not only thinness, suggesting different neurobiological mechanisms (
14). Three studies investigated cortical thickness in elderly depressed patients (
15–
17). Only depressed elderly patients with late-onset depression, which likely represents a group with different underlying pathology, showed significant differences in cortical thickness, having thinner than normal areas in the anterior and posterior cingulate cortices and the medial orbitofrontal cortex (
16).
In sum, a limited number of studies have identified differences in cortical thickness in areas of the paralimbic cortex of patients with major depression, but the results are far from consistent. This may be due to differences in methods, study group size, and patient characteristics. Further, it is also unclear whether these differences reflect trait-related abnormalities, as most studies investigated patients during the depressed state.
Therefore, we investigated cortical thickness measurements obtained with magnetic resonance imaging (MRI) in a medication-free group of 40 adult patients with major depressive disorder early in the course of depression, so that the findings would not be confounded by either neurotoxic effects of prolonged disease or neuroprotective effects of ongoing medication. The group consisted of both currently depressed patients and patients in remission, in order to allow a direct evaluation of potential state- and trait-related abnormalities in depression (
18). On the basis of previous literature, we hypothesized that the patients would have regions of both greater and less than normal thickness of the paralimbic cortex, as a trait characteristic of depression.
Method
Subjects
The study participants were 40 first-episode patients with major depressive disorder and 31 matched healthy comparison subjects. Of the 40 patients with depression, 20 were medication naive and were currently experiencing their first depressive episode, and 20 were medication-free patients recovered from their first episode. The mean age of the patients with depression was 35.0 years (SD=11.5, range=18–56), and the mean age of the comparison group was 34.7 years (SD=12.0, range=18–53). Major depressive disorder was diagnosed by administration of the Structured Clinical Interview for DSM-IV (SCID) (
19) by a trained psychiatrist (P.v.E.). The inclusion criterion for the currently depressed group was moderate to severe depression as defined by a score of at least 18 on the 17-item Hamilton Depression Rating Scale (
20) (HAM-D). The inclusion criteria for the recovered group were the absence of clinically relevant symptoms over the preceding 6 to 24 months, defined as a score of 7 or less on the HAM-D (
21), and discontinuation of antidepressant therapy for at least 2 months. Patients with other current or lifetime DSM-IV axis I disorders, as assessed with the Mini International Neuropsychiatric Interview (MINI) (
22), were excluded. The inclusion criteria for the healthy comparison subjects were no lifetime DSM-IV axis I disorder, as assessed with the MINI, and no history of psychiatric disorders in first-degree relatives. All participants were otherwise healthy and did not use any medication other than hormonal contraceptives. Other exclusion criteria were a history of substance abuse or dependence, a history of traumatic brain injury, claustrophobia, metal implants, and for women, postpartum depression, pregnancy, lactation, or menopause.
The study was approved by the local ethics committee (CMO region Arnhem-Nijmegen, the Netherlands). Participants were recruited through the outpatient clinic of the department of psychiatry and by local newspaper advertisements. All participants gave written informed consent prior to participation.
Assessment
We assessed psychopathology through a clinical interview and administration of the SCID, MINI, HAM-D, Beck Depression Inventory (BDI) (
23), and trait and state measures of the State-Trait Anxiety Inventory (
24). Handedness was tested with the Edinburgh Handedness Inventory (
25). A standard neuropsychological test battery was administered to compare neuropsychological functioning in the depressed and comparison groups: The Dutch version of the National Adult Reading Test (
26) was administered as a measure of general intelligence (
27). The Rey-Osterrieth Complex Figure Test (
28) was used as a measure of nonverbal memory, the Dutch modified version of the Rey Auditory Verbal Learning Test (
29) as a measure of immediate and delayed verbal recall and delayed recognition, the Digit Symbol Substitution Test (
30) and Trail Making Test A (
31) as measures of attention and psychomotor speed, and the Wisconsin Card Sorting Test (
32) and the Trail Making Test interference rating as measures of executive function.
MRI Data Acquisition and Cortical Reconstruction
High-resolution anatomical images (voxel size=1 mm3) of the whole brain were acquired on a 1.5-T Siemens Sonata whole-body scanner (Siemens, Erlangen, Germany) using a three-dimensional T1-weighted magnetization prepared rapid acquisition gradient echo sequence (MPRAGE) (176 contiguous sagittal slices, volume TR=2250 ms, TE=3.93 ms, TI=850 ms, 15° flip angle, slice matrix=256×256, slice thickness=1.0 mm, no gap, field of view=256 mm) with isotropic voxels (1×1×1 mm).
The MRI data were analyzed by using FreeSurfer software (
http://surfer.nmr.mgh.harvard.edu). The software package is almost completely automated and reliably computes cortical thickness. The reliability and accuracy of this method have been validated by within-subject test-retest studies, direct comparisons with manual measures on postmortem brains (
33), and comparison of cross-subject regional thickness measures with published values (
34–
36). The data were motion corrected and intensity normalized. We performed segmentation of white matter and tessellation of the gray-white matter junction. Topological defects in the gray-white estimate were fixed. Then a deformable surface algorithm was applied to find the pial surface. We visually inspected the entire cortex in each individual subject and corrected any inaccuracies in segmentation manually. The reconstructed cortical surfaces were inflated to normalize interindividual differences in gyral or sulcal depth. Each reconstructed brain was morphed and registered to an average spherical surface representation so that sulci and gyri were optimally aligned and cortical thickness difference maps could be constructed on a common spherical coordinate system.
Statistical Analysis
After smoothing (full width at half maximum, 10 mm), the cortical thickness data were averaged across participants in the spherical coordinate system, so that surface areas with significant differences of mean cortical thickness between the patients with major depressive disorder and healthy comparison subjects could be overlaid in statistical difference maps (using t statistics). First, we addressed differences between the whole group of patients and the comparison group with the general linear model functionality within QDEC, FreeSurfer’s graphical interface for analyzing group data. We estimated for the whole brain (in vertex-wise statistical difference maps) the main effect of participant group (using the FreeSurfer question “Does the average cortical thickness, accounting for sex, differ between the patients with major depression and healthy controls?” and including the nuisance factors age and total intracranial volume). On the basis of the previous literature, we a priori hypothesized that we would find both regions of greater thickness and regions of less thickness in the paralimbic cortex, as a trait characteristic of depression. We therefore report differences as significant below an uncorrected p value of 0.001 (two-tailed), which is considered an appropriate threshold when an a priori hypothesis is present (
16,
37,
38). In addition, we added a correction for multiple comparisons that constrains the total number of comparisons. We created a label for the entire paralimbic cortex for each hemisphere and applied a false discovery rate (FDR) correction (p<0.05) in the FreeSurfer TK Surfer program. This label was created on the basis of the definition of paralimbic cortex by Mesulam (
4) and included the following predefined cortical parcellations in FreeSurfer in the search territory: orbitofrontal, cingulate, insular, parahippocampal, and temporopolar cortices.
In addition to these, we also report all other loci beyond the a priori search territory that met the a priori statistical threshold, to allow comparison with results in other studies and to illustrate the specificity of the results (
39).
Subsequently, we performed an analysis to address differences between the subgroups. In the first step, labels were created by manually aligning the differences between the total group of patients and the comparison group at p<0.001. Next, these labels were mapped back from the average to all the individual subjects in order to extract mean values of the cortical thickness for all subjects in the three subgroups (20 acutely ill patients, 20 recovered patients, and 31 healthy comparison subjects). State and trait effects on the mean cortical thickness of the regions of interest were addressed by analysis of covariance (ANCOVA), with sex, age, and total intracranial volume as covariates, among the subgroups by using SPSS software (SPSS, Chicago), and pairwise comparisons of the groups were adjusted for multiple comparisons by using Bonferroni correction. Finally, we explored the association of mean cortical thickness values for the regions of interest with scores for trait anxiety as a measure of mood regulation. We used partial correlation tests, in which we controlled for the effects of grouping by adding the BDI score as covariate.
Results
Subject Characteristics
Table 1 shows the demographic and clinical variables of the subjects, along with the results of the neuropsychological assessment. There were no significant differences between the groups on any of the demographic variables, and so potential differences in cortical thickness cannot be attributed to these measures. As expected, the patients with major depression scored higher than the healthy individuals on the self-report measures of negative mood (BDI) and state and trait anxiety. Within the group of patients, the acutely ill and recovered patients also differed on these measures and on variables related to the course of illness: HAM-D score, duration of episode, time since onset, and duration of medication use. No significant differences among the groups were observed on any of the neuropsychological tests, including measures of IQ, visual and declarative memory, attention, psychomotor speed, and executive function (see
Table 1). These results show that this medication-free group of patients with first-episode depression had no apparent impairments in neuropsychological functioning.
Cortical Thickness Analysis
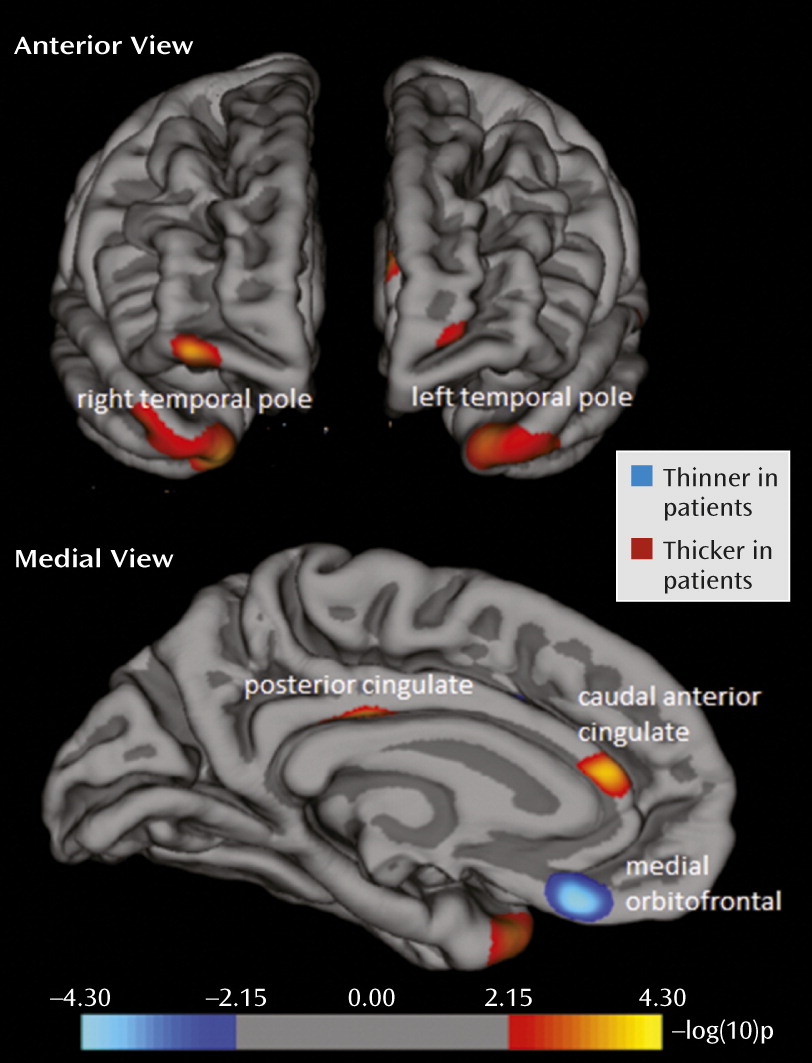
In line with our hypothesis, the vertex-by-vertex analysis showed significant differences between the patients with major depression and the healthy subjects in several regions within the paralimbic cortex (p<0.001, uncorrected; adjusted for age, sex, and intracranial volume; see
Figure 1 and
Table 2). In the left hemisphere, the patients had significantly less thickness than the comparison subjects in the medial orbitofrontal cortex (BA 11). In addition, there were areas of greater cortical thickness in the posterior cingulate cortex (BA 23), caudal anterior cingulate cortex (BA 33), and temporal pole (BA 38). These results stayed significant when FDR correction (p<0.05) for the paralimbic cortex was applied. In the right hemisphere, the only significant difference was greater cortical thickness in the temporal pole (BA 38) of the patients with depression, but this did not remain significant after FDR correction. There were no areas of significantly less thickness in the right hemisphere. Post hoc inspection of the entire brain showed that only one area outside the a priori search territory met the statistical threshold, the right rostral middle frontal cortex (BA 10; x=32.0, y=56.4, z=−9.4; p=0.0005), which indeed illustrates the relative specificity of findings within the paralimbic cortex (
39).
Regions with significant differences between the groups were subsequently defined as regions of interest. Five regions of interest (left medial orbitofrontal cortex, left posterior cingulate cortex, left caudal anterior cingulate, and bilateral temporal pole) were used for subgroup analyses (ANCOVA) and correlations with clinical variables.
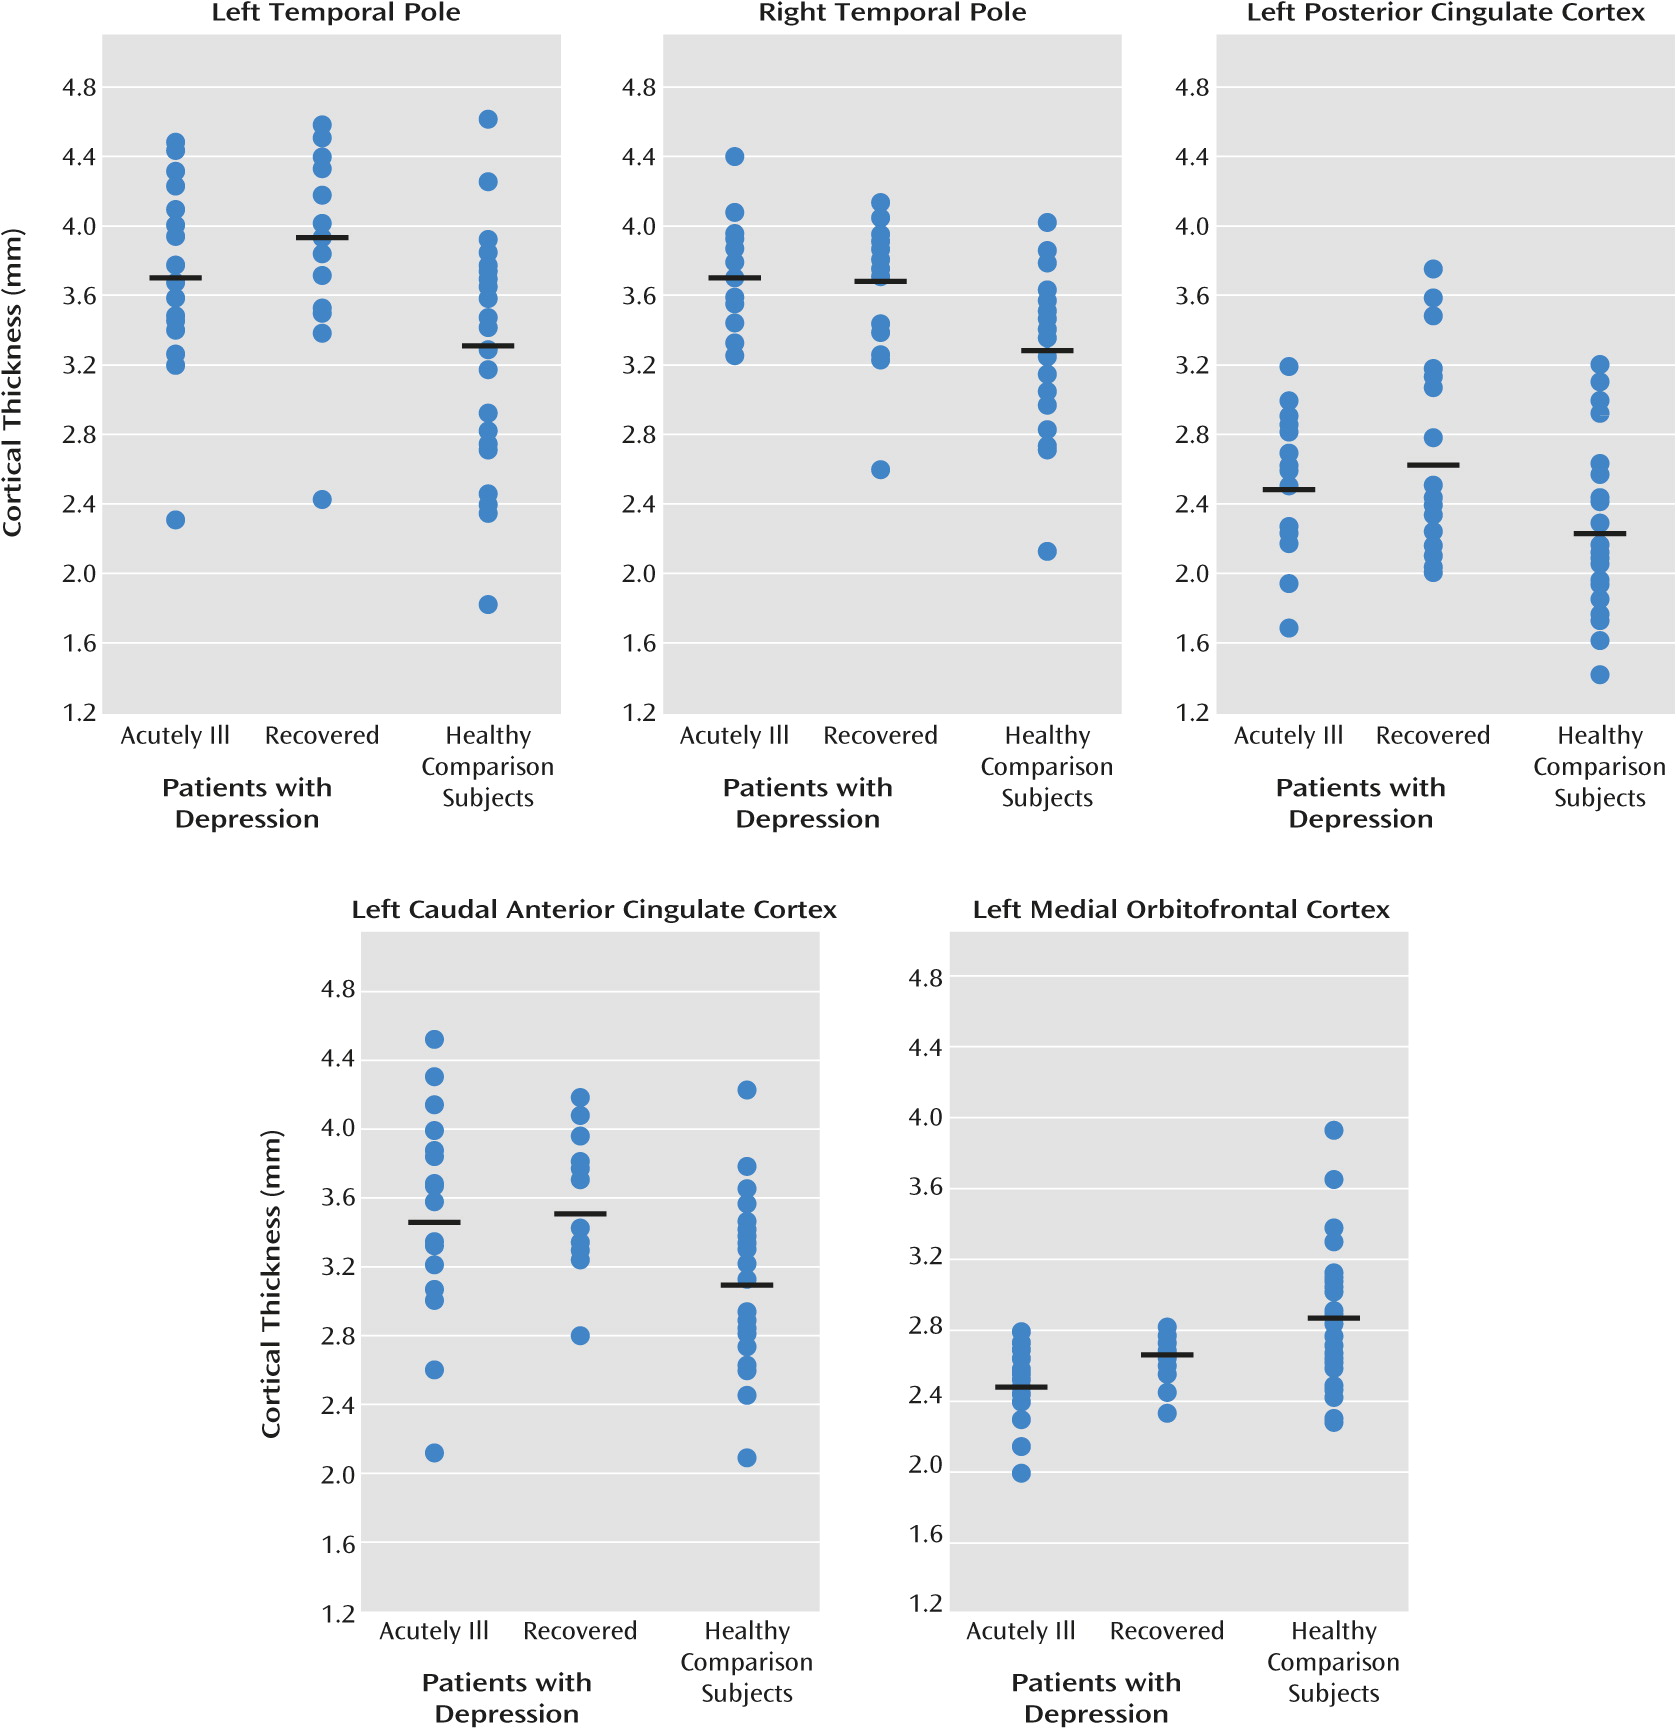
To further explore our hypothesis that differences in cortical thickness are due to trait effects and not to state effects, we used the mean cortical thickness of the regions of interest to perform a secondary analysis to test differences between the subgroups of acutely ill patients (N=20) and recovered patients (N=20) and between each patient subgroup and the healthy comparison subjects (N=31) (see
Table 3 and visual presentation in
Figure 2). These analyses showed that mean cortical thickness for the regions of interest differed from the healthy comparison subjects in both the acutely ill and recovered patients, although the difference between the acutely ill patients and comparison group for the left temporal pole fell short of significance. There were no significant differences between the acutely ill and recovered patients, confirming the trait character of the differences in cortical thickness.
Correlation With Mood Regulation
Given our hypothesis that differences in cortical thickness of the paralimbic cortex would be related to differences in mood regulation, we correlated scores for trait anxiety, as a measure of mood regulation, with cortical thickness in the aforementioned regions of interest. As this relation could mediate a vulnerability effect that may also be evident in healthy subjects, we computed the partial correlations across all subjects, controlling for BDI score to account for the effects of grouping. In the total group of subjects, the thickness of the left medial orbitofrontal cortex was inversely correlated with the score for trait anxiety when the BDI score was controlled for (r=−0.48, N=71, p<0.001).
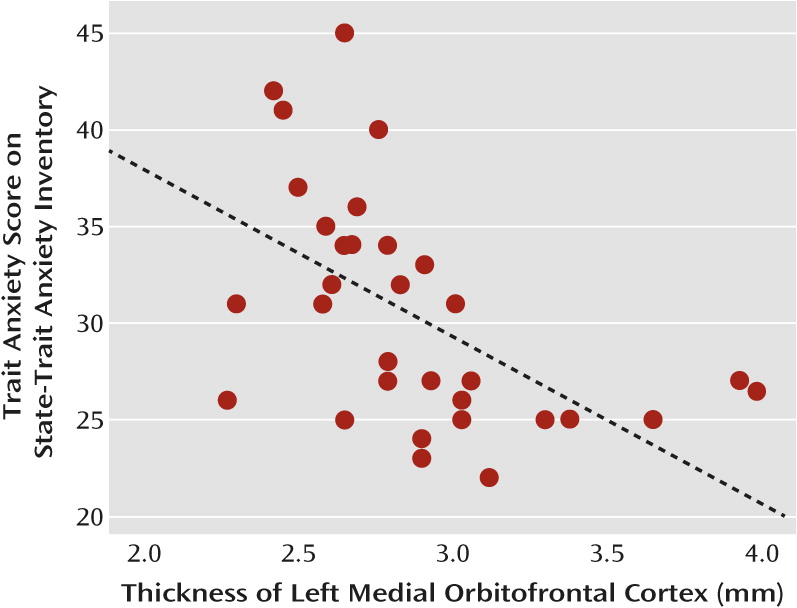
To further explore possible state and trait effects of this correlation, we analyzed correlations between the thickness of the left medial orbitofrontal cortex and the BDI-controlled trait anxiety score within the separate subgroups (acutely ill, recovered, and comparison). There was no significant correlation with trait anxiety in either depression subgroup, but in the group of healthy subjects the thickness of the left orbitofrontal cortex correlated inversely with trait anxiety (r=−0.59, N=31, p=0.003; see
Figure 3). There were no significant correlations between trait anxiety and the cortical thickness of the other regions of interest.
Discussion
In this study we found trait-related differences in the thickness of the paralimbic cortex between medication-free first-episode patients with major depressive disorder and healthy comparison subjects. Prominent thinness was found within the medial orbitofrontal cortex of the left hemisphere in patients with major depressive disorder. An interesting finding was a correlation between the thickness of this region and a clinical variable indicating depression vulnerability in the comparison group. The patients had greater thickness than the comparison subjects in the bilateral temporal poles, left posterior cingulate cortex, and left rostral anterior cingulate cortex. Patterns of thickness in the mood-regulating paralimbic cortex (
4) may therefore reveal key pathophysiological mechanisms of major depressive disorder.
Areas of Less Cortical Thickness
Our results revealed a trait-related thinness of the left medial orbitofrontal cortex. A large body of evidence supports involvement of the medial orbitofrontal cortex in mood disorders (
42–
44), implicating both lower volume and functional abnormalities in this region, with a tendency toward the left hemisphere (for a review see reference
45). Indeed, thinness in the left medial orbitofrontal cortex was recently shown in multiepisode patients with major depression (
12) and elderly patients with late-onset depression (
16). Our data indicate that this regional thinness, rather than being the result of prolonged disease, is already present in the early course of depression. This finding has several implications.
First, our data suggest that the observed thinness constitutes a trait factor in depression, as differences were present in both the acutely depressed and recovered subgroups of patients with major depression. These conclusions are supported by a finding of thinness of the left medial orbitofrontal cortex in individuals at risk for familial depression (
13). Second, our correlational analysis across both patients and comparison subjects revealed that a higher score for trait anxiety, indicating impaired mood regulation, is associated with a thinner cortex in this specific area. Although we controlled for BDI score, grouping effects may influence this correlation in the total study group. The correlation with trait anxiety seems to indicate a genuine vulnerability aspect, however, as the thickness of this area in the healthy subjects was inversely correlated with trait anxiety, replicating a recent finding by Kühn and colleagues (
46). High trait anxiety is considered a risk factor for major depression (
47,
48), corresponding to neuroticism, that is inversely correlated with thickness of the medial orbitofrontal cortex (
49). Therefore, thinness of the medial orbitofrontal cortex could reflect a cause rather than a consequence of major depression.
Fundamental, postmortem research revealed that a thinner medial orbitofrontal cortex in major depression is caused by cytoarchitectural abnormalities involving neurons and glial cells (
7,
8). It is likely that the vulnerability for depression is mediated by lower inhibitory control over limbic structures, such as the amygdala (
45). Less thickness leads to a lower capacity to limit emotional responses and autonomic reactions (
50). Our results did not show a significant difference in thickness between the acutely ill and recovered patients, although it remains possible that thinness may be partly reversible and might respond to neurotrophic effects of antidepressant medication. One study found an increase of orbitofrontal thickness in patients with major depression at follow-up (
12). Further study is certainly needed to investigate the effect of treatment on thickness of the medial orbitofrontal cortex.
Areas of Greater Cortical Thickness
Our study also revealed trait-related greater thickness of the bilateral temporal poles, left rostral anterior cingulate, and posterior cingulate cortex. Greater thickness of the temporal poles was recently reported in children with major depression (
14). The temporal pole couples emotional responses to highly processed sensory information, and this integration is critical for the evaluation of emotional states (
51,
52). Damage of the temporal pole can lead to unstable mood states (
53,
54), and previous neuroimaging studies in major depression have detected both lower than normal gray matter density (
55) and high activation (
56) within this region.
The rostral anterior cingulate cortex and the posterior cingulate cortex are involved in several aspects of emotion regulation, such as appraisal and expression of negative emotion (
57), voluntary suppression of negative affect (
6,
58), and self-referential functions (
59). Low volume and greater than normal activation in major depression have been consistently shown for both regions (for an overview see reference
5). A recent coordinate-based meta-analysis of 23 voxel-based morphometry studies in major depression identified one single, bilateral cluster of low gray matter volume in the rostral anterior cingulate cortex (
60), in the exact location where our study detected greater than normal thickness. Of note is that this lower volume was not observed in study groups that included only first-episode patients. Hence, our findings do not per se contradict later thinning as a function of progressive neurotoxic effects on the anterior cingulate cortex (
60).
It is still unclear what this greater cortical thickness means. One speculative explanation could be that these regions are recruited to a greater degree because of dysfunction of the orbitofrontal cortex. Deficient inhibitory control over limbic structures leads to the activation of other regions involved in mood regulation (
5,
6). Greater cortical thickness in paralimbic regions may reflect a compensatory mechanism to cope with less efficient self-regulation in major depression. Such a mechanism is consistent with greater posterior cingulate thickness in patients with remitted major depression than in patients without remission (
12). Increased thickness due to compensatory activity could well reflect an altered developmental trajectory during childhood or adolescence, in line with the work of Fallucca and colleagues (
14). Alternatively, the greater thickness may be the first evidence of an underlying pathological process, which eventually leads to volumetric reduction, as evidenced by the correspondence of the locations of greater thickness in our study and progressive gray matter reduction in the rostral anterior cingulate cortex in the recent meta-analysis (
60).This process may be related to glutamate-related toxicity, which is known to affect glial function (
61). According to Rajkowska and colleagues, the early stages of major depressive disorder are characterized by glial pathology, which includes hypertrophy of glial cells through compensatory mechanisms. These compensatory mechanisms are unable to prevent the accumulation of extracellular glutamate in the longer run, however, leading to damage and loss of neurons in the advanced stages of major depression (
11).
We can only speculate about cellular changes underlying cortical thickening, such as increased gliagenesis or neurogenesis. Emerging evidence indicates that neurogenesis can also occur in the adult neocortex of mammals (
62–
64). Whatever the causes, greater thickness of these paralimbic areas may induce overrecruitment of this circuitry through kindling mechanisms, which could lead to heightened sensitivity to emotional triggers. Of note is that the areas of greater thickness observed in our study are all part of the default mode system (
5). Previous research has shown that depressed patients have particular problems with deactivation of the default mode system (
65), and there is evidence for greater than normal functional connectivity within the default mode network, both during acute episodes and after recovery (
66). Possibly, greater functional connectivity between regions implicated in the default mode network and the lack of deactivation of these regions may be related to greater cortical thickness in these particular areas, although the causal relationship remains to be elucidated.
Limitations
The limitations of this study include the use of a cross-sectional design and potential indirect medication effects. Although all participants were currently free of medication, the recovered patients had received pharmacotherapy prior to investigation. Longitudinal studies are required to conclusively identify trait effects and investigate the temporal course of thickness in the paralimbic cortex. It would be informative to include patients with familial depression and their unaffected offspring to disentangle environmental and genetic effects and to determine whether trait effects are already present premorbidly. Future studies would benefit from higher-resolution imaging and could be combined with magnetic resonance spectroscopy and resting-state functional MRI to relate cortical thickness to levels of glutamate and default mode network activity.
In sum, our data show that the depressive trait is associated, on a group level, with differences in the thickness of the paralimbic cortex. In particular, thinness of the medial orbitofrontal cortex may serve as a potential neurobiological endophenotype of major depressive disorder, behaviorally corresponding to impaired mood regulation. Although our measurements are from fairly homogeneous medication-free groups, the results are limited by the study’s cross-sectional nature and should be replicated in a study with a longitudinal design.