Impairment in social functioning is a core feature of schizophrenia. It is characterized by difficulties in achieving social milestones and establishing relationships, such as social network involvement and marriage or family life (
1–
4). Real-world indices of functioning have gained increasing importance in investigations into recovery (
5,
6), and social functioning, defined as involvement in social interactions and social activities, has been recognized as a key outcome measure for determining treatment success (
7,
8).
In contrast to the growing awareness about the importance of social functioning for tracking outcome, previous reports have left several issues unresolved. First, it has been shown that social outcomes in schizophrenia are poor (
9), but prospective evaluations reported mixed findings, with improving (
10–
12), stable (
13,
14), and declining (
15) social functioning after illness onset. In addition, studies generally examined group averages without taking differences between individuals within psychotic disorders into account. Averages can mask functional recovery or deterioration present in subgroups of patients. It is important to explicate the different long-term trajectories of social functioning in order to identify critical periods and specific trajectories that warrant intervention.
While considerable research has been done in schizophrenia, social outcomes in other psychotic illnesses have been less studied (
15–
17). It is generally assumed that schizophrenia is associated with worse social functional outcomes compared with other psychotic disorders, but the few studies that directly tested this assumption by comparing the longitudinal courses of social functioning in affective and nonaffective psychoses have yielded conflicting findings. The pioneering work of Harrow and colleagues found evidence that social impairment was more severe in schizophrenia than other psychotic disorders at 7.5- and 15-year follow-up (
10,
18). However, two other studies reported comparable levels of social functioning in schizophrenia and affective psychosis. The first, a cross-sectional study, compared individuals with schizophrenia and bipolar disorder (
19), and the second study compared affective disorders and schizophrenia 6 months after hospitalization (
17). Thus, the evidence for diagnosis-specific differences in psychosocial functioning is inconsistent.
The current study aimed to address these questions by examining differences in the trajectories of social functioning over 20 years across and within diagnostic groups in a large, countywide sample of first-admission individuals with affective and nonaffective psychosis (
21). We also sought to 1) examine associations of these trajectories with premorbid social functioning and 2) evaluate their associations with other areas of functioning at 20-year follow-up. Finally, we examined the severity of impairment of social functioning 20 years postadmission by comparing the trajectory groups to a never-psychotic comparison group that was matched on demographic characteristics and neighborhood.
Method
Sample
Participants came from the Suffolk County Mental Health Project, a longitudinal countywide study of first-admission patients with a psychotic disorder (
21,
22). They were recruited from the 12 psychiatric inpatient units in Suffolk County, N.Y., between September 1989 and December 1995. Patients first hospitalized outside of Suffolk County or in nonpsychiatric units were not sampled unless they were rehospitalized within 6 months in one of the 12 study sites. Inclusion criteria were age 15–60, first admission either current or within 6 months, clinical evidence of psychosis, the ability to understand assessment procedures in English, IQ higher than 70, and the capacity to provide written informed consent. The study was approved annually by the Stony Brook institutional review board and the institutional review boards of participating hospitals. Written informed consent was obtained. For participants aged 15–17, written consent was obtained from parents and verbal consent was obtained from participants. The response rate for individuals approached for baseline assessment during the recruitment period was 72%.
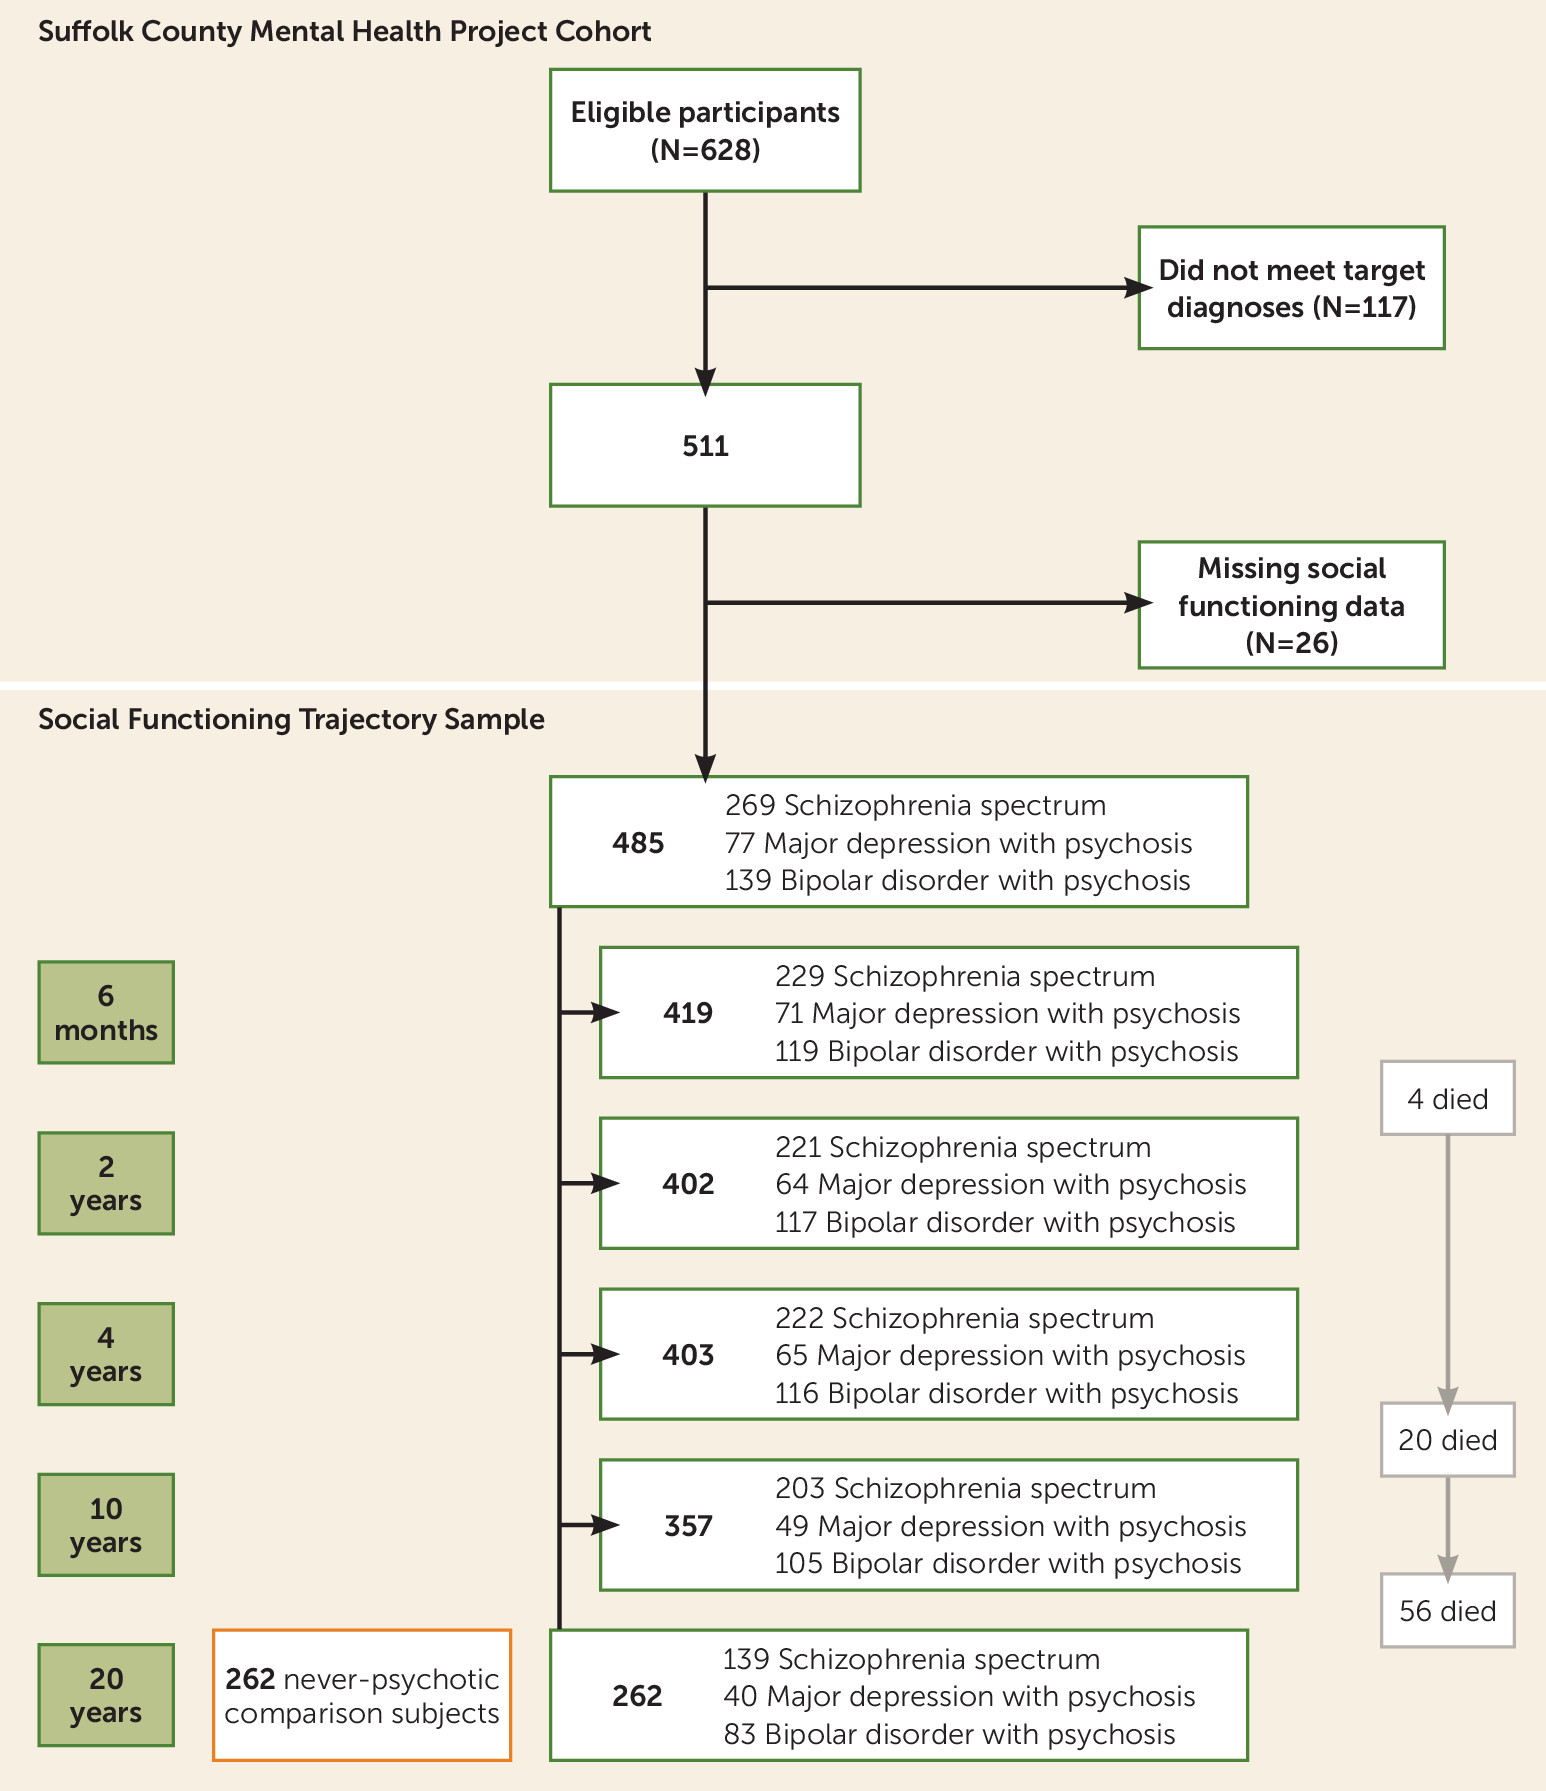
Initially, the Suffolk County Mental Health Project interviewed 675 individuals. Of these, 628 met the eligibility criteria (
22).
Figure 1 provides a flow chart of the analysis sample. Among the 628 eligible participants, 511 had one of the three target diagnoses included in this article: schizophrenia spectrum disorder (schizophrenia, schizoaffective disorder, schizophreniform disorder), major depressive disorder with psychosis, and bipolar disorder with psychosis. Seventy-one patients with psychosis not otherwise specified and 46 individuals with drug-related psychoses were excluded from the current study. Further, 66 individuals did not complete any social functioning assessment, resulting in a final analysis sample of 485 individuals with at least one data point. The 66 dropouts did not differ from the analysis sample in terms of sex, age, or diagnosis (all p>0.05). At the 20-year point, of the 485 included participants, 262 were assessed and 56 had died. Nonresponse was primarily accounted for by refusal to participate and loss to follow-up. Overall, 40.6% of the 485 participants who took part in our study completed all five assessments, 21.2% four, 21.7% three, 10.5% two, and 6.0% one assessment. Attrition within the analysis sample seemed random, that is, the number of assessments was not associated with age, sex, negative symptoms, positive symptoms, employment, public assistance, independent living, homelessness, or baseline diagnosis.
Respondents completed face-to-face interviews at baseline, 6 months, 2 years, 4 years, 10 years, and 20 years. The initial social functioning assessment was taken at 6 months, when the participants were no longer in the hospital. Thus, the 6-month assessment was used as the starting point for the functional trajectories.
To obtain a benchmark for social functioning, a never-psychotic comparison group was recruited at the 20-year time point for respondents living within a 50-mile radius of Stony Brook University. We used a two-step procedure approved by the Stony Brook institutional review board. Step 1, performed by the Stony Brook University Center for Survey Research, involved random digit dialing within zip codes selected in proportion to cases residing there. The goal was to obtain a sample with a similar age and sex distribution and no history of psychosis. The initial number of randomly generated telephone numbers was 12,388. Of these, 2,594 numbers were inactive, 4,321 calls went unanswered, and 4,291 people were ineligible (outside the age/sex target for the zip code or had a psychosis diagnosis or psychiatric hospitalization). Of the eligible households (N=1,182), 750 refused participation and 432 agreed to consider participating in the study and provided a time when they could best be recontacted by study staff.
Step 2, conducted by trained study staff, involved telephone rescreening of the 432 potentially eligible participants. The rescreen included an adaptation of the six-item psychosis screening questionnaire (
23) covering visual and auditory hallucinations, thought insertion, paranoia, strange experiences, and diagnosis of schizophrenia or schizoaffective disorder. Twenty individuals could not be reached or were unavailable for rescreening. Of the remaining 412, 58 refused participation, 49 could not be scheduled, and 35 disclosed psychotic symptoms. Of the remaining 270 who participated in the study, eight endorsed psychotic symptoms on the Structured Clinical Interview for DSM-IV and were removed from the sample. The final comparison group was composed of 262 participants and was closely matched to the cases on sex (55.9% versus 56.7% male) and age (mean: 50.46 years [SD=9.02] versus 48.14 years [SD=9.14]).
Measures of Social Functioning
The social functioning index was based on a composite of three items relating to relationships and activities with other people from the Heinrichs-Carpenter Quality of Life Scale (
24). The scores ranged from 0 (extremely poor) to 6 (satisfactory) for social activity and social sexual relationships and from 1 to 5 for relationships with friends. The Quality of Life Scale is a semistructured interview with multiple probes providing information for each interviewer rating. For example, questions in the “relationships with friends” domain include “Do you have friends with whom you are especially close other than your immediate family or the people you live with?”, “How many friends do you have?”, and “How often have you spoken with them recently, in person or by phone?” Ratings were based on information from the participant, as well as significant others and medical records when available. Information from significant others was available for 66.8% of participants who completed the 6-month assessment and 48.1% of participants who completed the assessment at 20 years. The availability of this information did not differ between classes at any of the time points. Medical records were available for 82.6% of participants at 6 months and 55.3% of participants at 20-year follow-up. At baseline, significantly more records were available for lower-functioning individuals (class 1=92.0%, class 2=84.5%, class 3=83.1%, and class 4=73.1%). There was no difference between classes at 20-year follow-up. The composite score ranged from 1 to 17 and showed acceptable internal reliability at each assessment (α ranged from 0.79 to 0.88).
Premorbid social functioning.
The Premorbid Adjustment Scale (
25) was administered at the 6-month follow-up. Ratings were based on a semistructured interview developed to match the Premorbid Adjustment Scale criteria, as well as information obtained from significant others, which was available for 79.6% of participants, and school records, which were available for 63.0% of participants. Overall, 88.5% had additional information to complement scores on the Premorbid Adjustment Scale. Items were rated on a 7-point scale, with 6 reflecting lowest and 0 reflecting highest social functioning. To compare scores on the Premorbid Adjustment Scale and the Quality of Life Scale, items were rescaled so that higher scores indicated better functioning. Three subscales relevant to social contact were included: sociability and social withdrawal (frequency of and interest in social contact), peer relationships (quality of relationships with people of own age), and sociosexual relationships (sexual interest). Here we report the Premorbid Adjustment Scale social functioning scores in childhood (up to age 11), early adolescence (age 12 to 15), and late adolescence (age 15 to 18). Childhood ratings did not include sociosexual relationships. For comparability, we multiplied the childhood score by 1.5.
To equate the metrics of pre- and postadmission functioning, we compared distributions of the late adolescent Premorbid Adjustment Scale scores (ages 15–18) with the Quality of Life Scale scores of participants first assessed before age 19 (N=29), where the scores should be identical if they indeed reflected the same outcome. Distributions of the two composites were largely parallel, but the Premorbid Adjustment Scale scores (mean=13.38; SD=3.35; median=14; 10th percentile=8; 25th percentile=11.5; 75th percentile=16; 90th percentile=18) were around three points higher than the Quality of Life Scale scores (mean=10.78; SD=3.70; median=11; 10th percentile=5; 25th percentile=9; 75th percentile=13; 90th percentile=15). To make the scores on the two scales comparable, we therefore applied a transformation whereby we adjusted the Premorbid Adjustment Scale scores by subtracting 3 points. To avoid confounding of premorbid and postadmission social functioning at 6 months, the Premorbid Adjustment Scale data for those whose age of first admission was <19 years (N=29) were not included in the analyses.
Diagnosis
Face-to-face assessments were conducted by master’s-level mental health professionals at each time point, including the Structured Clinical Interview for DSM-IV (SCID) (
26). The assessors were blind to participants’ research diagnoses. However, out of respect to the sample and to maximize the accuracy of information gathered in the interview, raters were asked to review past interview material. Thus, they were aware of the SCID diagnoses (which did not always correspond with the research diagnosis). Primary DSM-IV diagnosis was formulated by consensus of four or more psychiatrists using all available longitudinal information, including SCID interviews, medical records, and information from significant others. We used the last available diagnosis to select the study sample. For the majority of individuals, this was the 10-year follow-up consensus diagnosis. For 91 individuals without a 10-year diagnosis, we substituted the temporally most proximal prior diagnosis.
Symptom Measures
At each time point, symptoms were assessed with the Scale for the Assessment of Positive Symptoms (SAPS) (
27) and the Scale for the Assessment of Negative Symptoms (SANS) (
28), which rate the presence of symptoms on a 6-point scale from absent (score=0) to severe (score=5). The SAPS assesses hallucinations, delusions, bizarre behavior, and thought disorder. We were interested in the SAPS psychosis subscale, a composite of 16 ratings measuring hallucinations and delusions (range=0–80; α internal consistency ranged from 0.81 to 0.89). Factor analysis identified two dimensions within the SANS: inexpressivity and avolition/asociality, which parallel prior findings (
29). We were particularly interested in the SANS inexpressivity subscale, a composite of nine items measuring blunted affect and alogia (range=0–45; α ranged from 0.89 to 0.91), because avolition/asociality is conceptually overlapping with social functioning.
Other Functional Outcomes
Other functional outcomes that were assessed in the 20-year follow-up interview were having a high school diploma (yes/no), employment status (being employed, yes/no), homelessness in past 10 years (yes/no), financial independence (receiving public assistance, yes/no), and living independently (own household or not).
Data Analyses
Analyses were conducted in STATA 13 (
30) and MPlus version 7.2 (
31). Demographic characteristics were compared using regression analyses or chi-square tests.
Functional trajectories.
To examine the trajectories of participant functioning, we conducted latent class growth analyses, a method used to discover subgroups (classes) of individuals following distinct patterns of change over time. In our case, individual class membership was assigned on the basis of social functioning scores from 6 months to 20 years, making use of all available data with maximum likelihood estimation and robust standard errors to account for missing data (i.e., full information maximum likelihood) (
31,
32). To determine the appropriate number of latent classes, the analysis is run from a one-class model to increasing numbers of classes. To compare models with the different numbers of classes and determine the optimum model fit, we examined the recommended fit indices: entropy, Akaike’s information criterion, and Bayesian information criterion. Highest entropy and lowest Akaike’s information criterion and Bayesian information criterion suggest the best fit and parsimony of the model (
31). Values of 0.4, 0.6, and 0.8 represent low, medium, and high entropy (
33). To assess model fit we also consulted the Vuong-Lo-Mendell-Rubin test (in which a significant p value indicates that this model fits significantly better than a model with a lower number of classes [
34,
35]). Two piecewise multilevel regression analyses accounting for multiple observations within individuals were conducted to compare the slopes of the four different trajectories from 6 months to 4 years and from 10 to 20 years between classes.
Functional trajectories and diagnosis.
To determine how functional trajectories map onto the current diagnostic classification, we calculated the distribution of schizophrenia spectrum disorder, major depressive disorder with psychosis, and bipolar disorder with psychosis diagnoses across the resulting latent class growth analysis trajectories.
Functional trajectories and premorbid functioning.
Regression analyses and paired t tests were used to examine how the latent class growth analysis trajectories were associated with premorbid functioning (childhood, early and late adolescence), with other 20-year functional outcomes, and with change from premorbid functioning in late adolescence to functioning after illness onset. Overall differences in social functioning at 20-year follow-up between the latent trajectory groups and the comparison group were evaluated with regression and chi-square analyses.
Discussion
Psychotic disorders are associated with profound social impairments (
32,
33). It is often implicitly assumed that these impairments fluctuate and that the course of social functioning is worse in schizophrenia compared with affective psychotic disorders (
34). However, only limited research had directly addressed cross-diagnostic and individual variation in patients’ social outcomes over time.
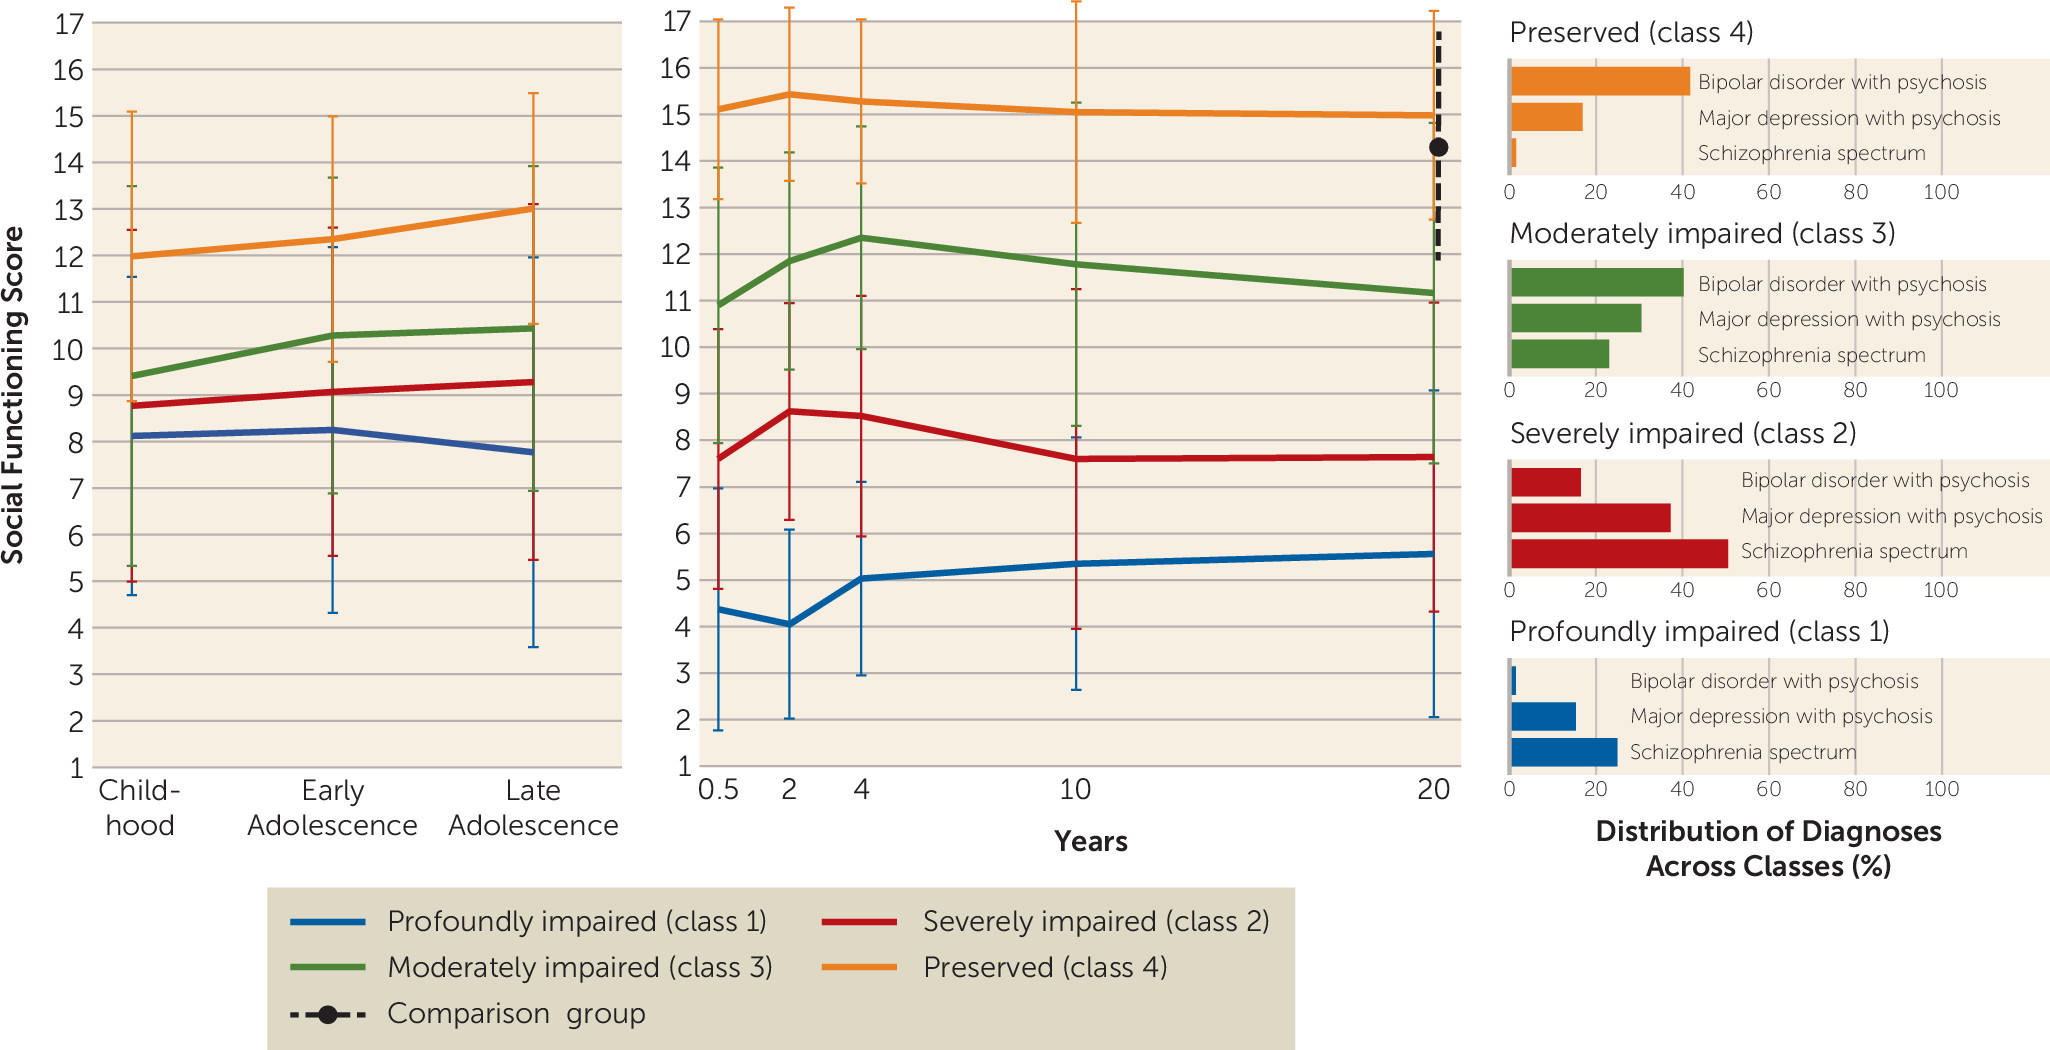
Our study went beyond investigations that considered individual disorders by examining latent trajectories in the 20-year course of social functioning across three broad psychotic disorder groups. Using latent growth curve modeling, we detected four remarkably stable trajectories of preserved, moderately, severely, and profoundly impaired social functioning. Interestingly, our findings reveal that more than one of these classes were found in schizophrenia spectrum disorders, psychotic bipolar disorder, and psychotic depression.
In addition, our findings suggest that differences in the level of social functioning among these 20-year trajectories are already evident in childhood. The years between early adolescence and first hospitalization appear to be a period in which a substantial number of individuals who later develop a psychotic disorder display a steep decline in social functioning. This extends the findings of earlier research that investigated social functioning within diagnostic categories by showing not only that premorbid adjustment is a strong predictor of social functioning over the 3 years following illness onset in schizophrenia spectrum disorders (
35), but that premorbid adjustment also predicts social outcome for patients with bipolar disorder with psychosis and major depressive disorder with psychosis. Besides, the level of social functioning after the acute illness phase in schizophrenia spectrum disorders, bipolar disorder with psychosis, and major depressive disorder with psychosis turned out to be relatively stable (
12,
15,
36,
37).
Particularly the two lower social functioning trajectories were associated with other unfavorable psychosocial outcomes at 20-year follow-up. This suggests that social functioning is a valuable indicator of long-term outcome and that it may be an important treatment target in psychotic disorders that could lead to improvements in other areas of functioning. It also shows the value of a recovery-oriented perspective of mental health services, in the sense of helping patients to formulate adjusted but meaningful (social) goals (
38).
In sum, the current findings expand existing knowledge on social functioning in psychotic disorders by showing that severe and persistent social impairment preceded by a drop in social functioning in adolescence is common in schizophrenia spectrum disorders (75%), but it is not limited to the schizophrenia spectrum, because it is also present in about 35% of participants with major depressive disorder with psychosis and about 18% of those having bipolar disorder with psychosis. On the other hand, a substantial number of individuals with bipolar disorder with psychosis (42%) and major depressive disorder with psychosis (26%), but hardly any individuals with schizophrenia spectrum disorders (1.5%), achieved levels of social functioning after illness onset that were similar to that of the comparison group. Our results suggest that, at the group level, the trajectories of social functioning do not exhibit marked changes after illness onset (e.g., showing improvement or deterioration), as previously suggested (
39,
40). Whereas small improvements in social functioning are visible in all classes in the first years after onset, the overall trajectories follow comparable, rather stable courses, which are mostly characterized by differences in severity. These differences are also reflected by differences in medication intake: the more severe the social impairment, the higher the antipsychotic medication intake. This finding, of course, does not imply causality (arguably, it may be that both antipsychotic use and social impairment are the direct consequences of symptom severity), yet it would be interesting to investigate the effect of prolonged medication on real-life outcomes.
Our findings are in line with those of the FUNCAP study, wherein real-world outcomes and their determinants were examined in individuals with schizophrenia and bipolar disorder. Also, social impairment was found to be more prominent but not limited to schizophrenia (
41,
42). Those results also provided important etiological clues, suggesting that social functioning in both schizophrenia and bipolar disorder seems largely driven by performance on functional capacity measures (measuring the capacity to perform everyday tasks, such as communication skills needed in daily interactions). Although this hypothesis needs further testing, it may explain at least part of our findings and suggests that similar pathways to poor social functioning apply across mental disorders.
Of interest is our finding that, in contrast to research that compared patients diagnosed with major depression versus bipolar disorder without psychosis (
43), Suffolk County participants with bipolar disorder had consistently better outcomes than individuals with psychotic depression. A potential explanation is that psychotic depression is a more severe illness than major depressive disorder without psychosis, which is the majority of what was examined in prior comparisons.
Our results should be interpreted in light of the following limitations. First, the Suffolk County project provided a unique opportunity to prospectively follow up a large sample for two decades; however, the gaps between the later follow-up assessments were large (6 and 10 years, respectively) and may have overlooked short-term changes in social functioning. Second, premorbid functioning was assessed retrospectively, which may limit the reliability of these data. We sought to mitigate this issue by integrating participant data with information from family members and school records. Third, critical data on factors that might more directly influence unfavorable social outcomes in people with psychosis, such as social-cognitive ability; effects of early social modeling from parents, relatives, and friends; and idiographic experiences (early social reinforcement and social rejection), was not available, and we were therefore not able to perform analyses of the potential determinants of poor functional outcome. Fourth, raters were aware of previous SCID diagnoses, which might be a source of bias. However, raters were unaware of both the study diagnosis (decided by study psychiatrists) and hypotheses of the current study, and social functioning was not a primary target of the study. Fifth, our focus was to investigate associations of social functioning trajectories with other 20-year outcomes; however, in order to assess the value of social functioning in relation to other real-world outcomes, it will be important to establish experimentally whether improvement in social functioning (e.g., with treatment) can indeed lead to other favorable outcomes and to determine whether trajectories of functioning in other domains (e.g., employment, life satisfaction) are parallel to the social functioning trajectories. The current sample had no systematic treatment aimed at social functioning, and future studies should examine how specific treatment might influence social functioning in the long run. Finally, latent class growth curve analysis offers a powerful method for studying between-person differences in longitudinal change. However, because it models a single trajectory for all members of a class (
35), we may have missed patterns where a few individuals show greater change than the rest of the class. Importantly, our results show large individual variation within groups (as indicated by the error bars in
Figure 2) and do not allow for conclusions about individual outcomes.
Clinical Implications
Persistent impairments observed in approximately half of the sample emphasize the need for targeted, long-term care aimed at improving social inclusion for those with low social functioning at illness onset. Our findings indicate that 53% of the patients decline markedly in their social functioning between late adolescence and first hospitalization, a finding that has been supported by two other studies using latent class growth curve analysis (
44,
45). This and the high temporal stability of the trajectories extend previous findings suggesting that the level of social functioning may be determined in adolescence. Consequently, our findings are consistent with recent programs of research focused on adolescence as the critical intervention window and support current early intervention strategies for high-risk individuals (
46) and those that offer intensive treatment to first-admission patients (
47) aimed to prevent social withdrawal in severe psychotic illnesses.


