Early Variations in White Matter Microstructure and Depression Outcome in Adolescents With Subthreshold Depression
Abstract
Objective:
Method:
Results:
Conclusions:
Method
Participants
Baseline Assessment
Follow-Up Assessment
| Baseline | Follow-Up | |||||||||||
|---|---|---|---|---|---|---|---|---|---|---|---|---|
| Characteristic | Subthreshold Depression Group (N=96) | Control Group (N=336) | Testa | Subthreshold Depression Group (N=81) | Control Group (N=284) | Testa | ||||||
| Mean | SD | Mean | SD | F | p | Mean | SD | Mean | SD | F | p | |
| Age (years) | 14.47 | 0.38 | 14.41 | 0.40 | 2.26 | 0.13 | 16.47 | 0.49 | 16.43 | 0.52 | 0.42 | 0.52 |
| Pubertal Development Scale (0–5) | 3.03 | 0.52 | 2.95 | 0.54 | 0.90 | 0.34 | 3.45 | 0.40 | 3.41 | 0.40 | 0.34 | 0.56 |
| N | % | N | % | χ2 | p | N | % | N | % | χ2 | p | |
| Female | 62 | 64.58 | 217 | 64.58 | 0.00 | 1 | 52 | 64.20 | 182 | 64.08 | 0.00 | 1 |
| Right-handed | 80 | 83.33 | 298 | 88.69 | 1.50 | 0.22 | 67 | 82.72 | 253 | 89.08 | 1.81 | 0.18 |
| Parental history of depression | 8 | 8.33 | 24 | 7.14 | 0.03 | 0.86 | 6 | 7.41 | 19 | 6.69 | 0.00 | 0.98 |
| Any parental psychiatric history | 15 | 15.63 | 46 | 13.69 | 0.12 | 0.73 | 12 | 13.38 | 38 | 14.81 | 0.02 | 0.88 |
| Non-Caucasian ethnicity | 21 | 21.88 | 27 | 8.04 | 13.11 | <0.001 | 13 | 16.05 | 68 | 5.28 | 8.85 | 0.003 |
| Adverse childhood experienceb | 12 | 12.50 | 30 | 8.93 | 0.77 | 0.38 | 4 | 4.94 | 28 | 9.86 | 1.34 | 0.25 |
| Familial financial difficulties | 36 | 37.50 | 82 | 24.40 | 5.81 | 0.02 | 29 | 35.80 | 73 | 25.70 | 2.71 | 0.10 |
| Subthreshold depression at age 16 | 22 | 27.16 | 29 | 10.21 | 13.69 | <0.001 | ||||||
| Depression at age 16 | 8 | 9.88 | 7 | 2.46 | 7.01 | 0.008 | ||||||
| Self-harm since age 14 | 24 | 29.63 | 24 | 8.51 | 22.65 | <0.001 | ||||||
| Anxiety disorder at age 16c | 1 | 1.23 | 5 | 1.76 | 1 | |||||||
| Externalizing disorder at age 16d | 1 | 1.23 | 1 | 0.35 | 0.40 | |||||||
| Psychosis at age 16 | 0 | 0 | 0 | 0 | ||||||||
| Mania at age 16 | 0 | 0 | 1 | 0.35 | 1 | |||||||
| Monthly cannabis use at age 16 | 6 | 7.41 | 18 | 6.33 | 0.01 | 0.93 | ||||||
| Alcohol abuse at age 16e | 15 | 23.81 | 26 | 12.38 | 4.10 | 0.04 | ||||||
| Mean | SD | Mean | SD | U | p | Mean | SD | Mean | SD | U | p | |
| NEO Five-Factor Inventory | ||||||||||||
| Neuroticism | 29.11 | 7.46 | 20.97 | 6.76 | 6,802 | <0.001 | 27.16 | 6.42 | 20.67 | 7.28 | 5,483 | <0.001 |
| Extraversion | 27.83 | 6.68 | 30.75 | 5.30 | 19,924 | <0.001 | 27.58 | 6.33 | 30.26 | 5.59 | 13,961 | <0.001 |
| Openness | 26.47 | 6.55 | 26.30 | 5.57 | 16,070 | 0.96 | 28.21 | 6.47 | 27.46 | 6.03 | 10,610 | 0.47 |
| Agreeableness | 26.44 | 5.67 | 30.91 | 5.07 | 23,380 | <0.001 | 27.31 | 5.11 | 31.03 | 5.55 | 15,633 | <0.001 |
| Conscientiousness | 26.57 | 7.35 | 29.19 | 6.45 | 19,572 | 0.001 | 26.73 | 7.62 | 29.65 | 6.79 | 13,635 | 0.003 |
| Substance Use Risk Profile Scale | ||||||||||||
| Hopelessness | 14.89 | 3.93 | 12.42 | 2.54 | 10,079 | <0.001 | 14.18 | 3.98 | 12.44 | 3.06 | 8,174 | <0.001 |
| Anxiety-sensitivity | 11.86 | 2.43 | 11.05 | 2.24 | 13,320 | 0.009 | 11.35 | 2.53 | 10.95 | 2.38 | 9,920 | 0.14 |
| Impulsivity | 13.04 | 2.37 | 11.42 | 2.01 | 9,924 | <0.001 | 12.03 | 2.06 | 10.95 | 2.11 | 7,815 | <0.001 |
| Sensation seeking | 16.21 | 3.03 | 15.58 | 3.13 | 14,362 | 0.10 | 13.83 | 2.61 | 13.80 | 2.80 | 11,306 | 0.82 |
| Life Events Questionnaire score (−78 to +78) | –1.90 | 4.75 | –0.23 | 4.44 | 19,319 | 0.003 | 0.61 | 5.45 | 2.11 | 4.33 | 12,526 | 0.045 |
Diffusion MRI Acquisition and Preprocessing
Tract-Based Spatial Statistic
Probabilistic Diffusion Tractography
Statistical Analysis
Cross-sectional analyses.
Longitudinal analyses.
Post hoc analyses.
Results
Demographic and Clinical Characteristics
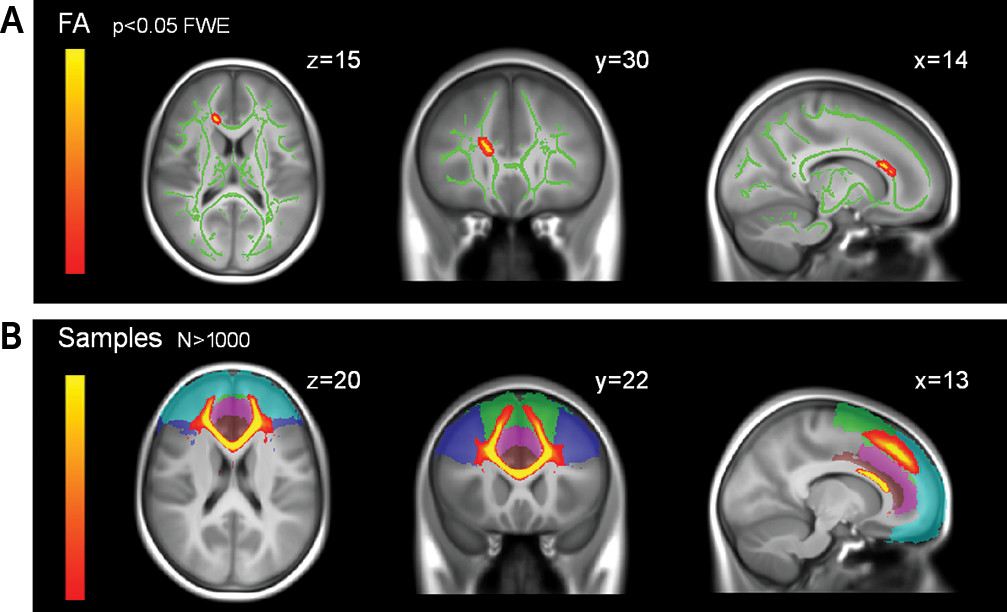
DTI Whole Brain Analyses
| Subthreshold Depression Group (N=96) | Control Group (N=336) | Test | ||||
|---|---|---|---|---|---|---|
| Characteristic | Mean | SD | Mean | SD | F (df=1, 425) | p |
| DTI global measures | ||||||
| Global FA values (×10–1) | 4.47 | 0.17 | 4.50 | 0.20 | 3.96 | 0.047 |
| Global MD values (×10–4) | 7.35 | 0.24 | 7.26 | 0.20 | 2.38 | 0.12 |
| Global AD values (×10–3) | 1.13 | 0.34 | 1.12 | 0.29 | 0.28 | 0.60 |
| Global RD values (×10–4) | 5.40 | 0.23 | 5.31 | 0.22 | 3.89 | 0.049 |
| DTI measures within the cluster region identified in voxel-wise comparisonb | ||||||
| FA values (×10–1) | 6.23 | 0.38 | 6.39 | 0.39 | 19.41 | <0.001 |
| RD values (×10–4) | 5.38 | 0.24 | 5.20 | 0.24 | 30.84 | <0.001 |
| Tractography analysesc | ||||||
| Tracts spanning from the anterior corpus callosum cluster to the anterior cingulate cortex | ||||||
| FA values (×10–1) | 4.51 | 0.31 | 4.60 | 0.34 | 10.06 | 0.01 |
| MD values (×10–4) | 8.04 | 0.46 | 7.85 | 0.36 | 8.56 | 0.03 |
| AD values (×10–3) | 1.24 | 0.06 | 1.22 | 0.05 | 1.58 | 0.21 |
| RD values (×10–4) | 5.85 | 0.49 | 5.66 | 0.42 | 10.93 | 0.001 |
| Right cingulum bundle | ||||||
| FA values (×10–1) | 3.45 | 0.34 | 3.59 | 0.39 | 9.13 | 0.03 |
| MD values (×10–4) | 8.16 | 0.54 | 7.98 | 0.45 | 0.01 | 1 |
| AD values (×10–3) | 1.13 | 0.07 | 1.12 | 0.06 | 0.02 | 0.88 |
| RD values (×10–4) | 6.60 | 0.54 | 6.40 | 0.48 | 7.29 | 0.007 |
| Left cingulum bundle | ||||||
| FA values (×10–1) | 3.71 | 0.39 | 3.80 | 0.41 | 5.17 | 0.24 |
| MD values (×10–4) | 8.24 | 0.54 | 8.08 | 0.45 | 2.39 | 1 |
| Right uncinate bundle | ||||||
| FA values (×10–1) | 3.99 | 0.39 | 3.99 | 0.35 | 0.02 | 1 |
| MD values (×10–4) | 7.85 | 0.40 | 7.73 | 0.29 | 0.45 | 1 |
| Left uncinate bundle | ||||||
| FA values (×10–1) | 4.01 | 0.49 | 3.99 | 0.48 | 0.42 | 1 |
| MD values (×10–4) | 8.01 | 0.47 | 7.88 | 0.29 | 0.12 | 1 |

Tractography Analysis
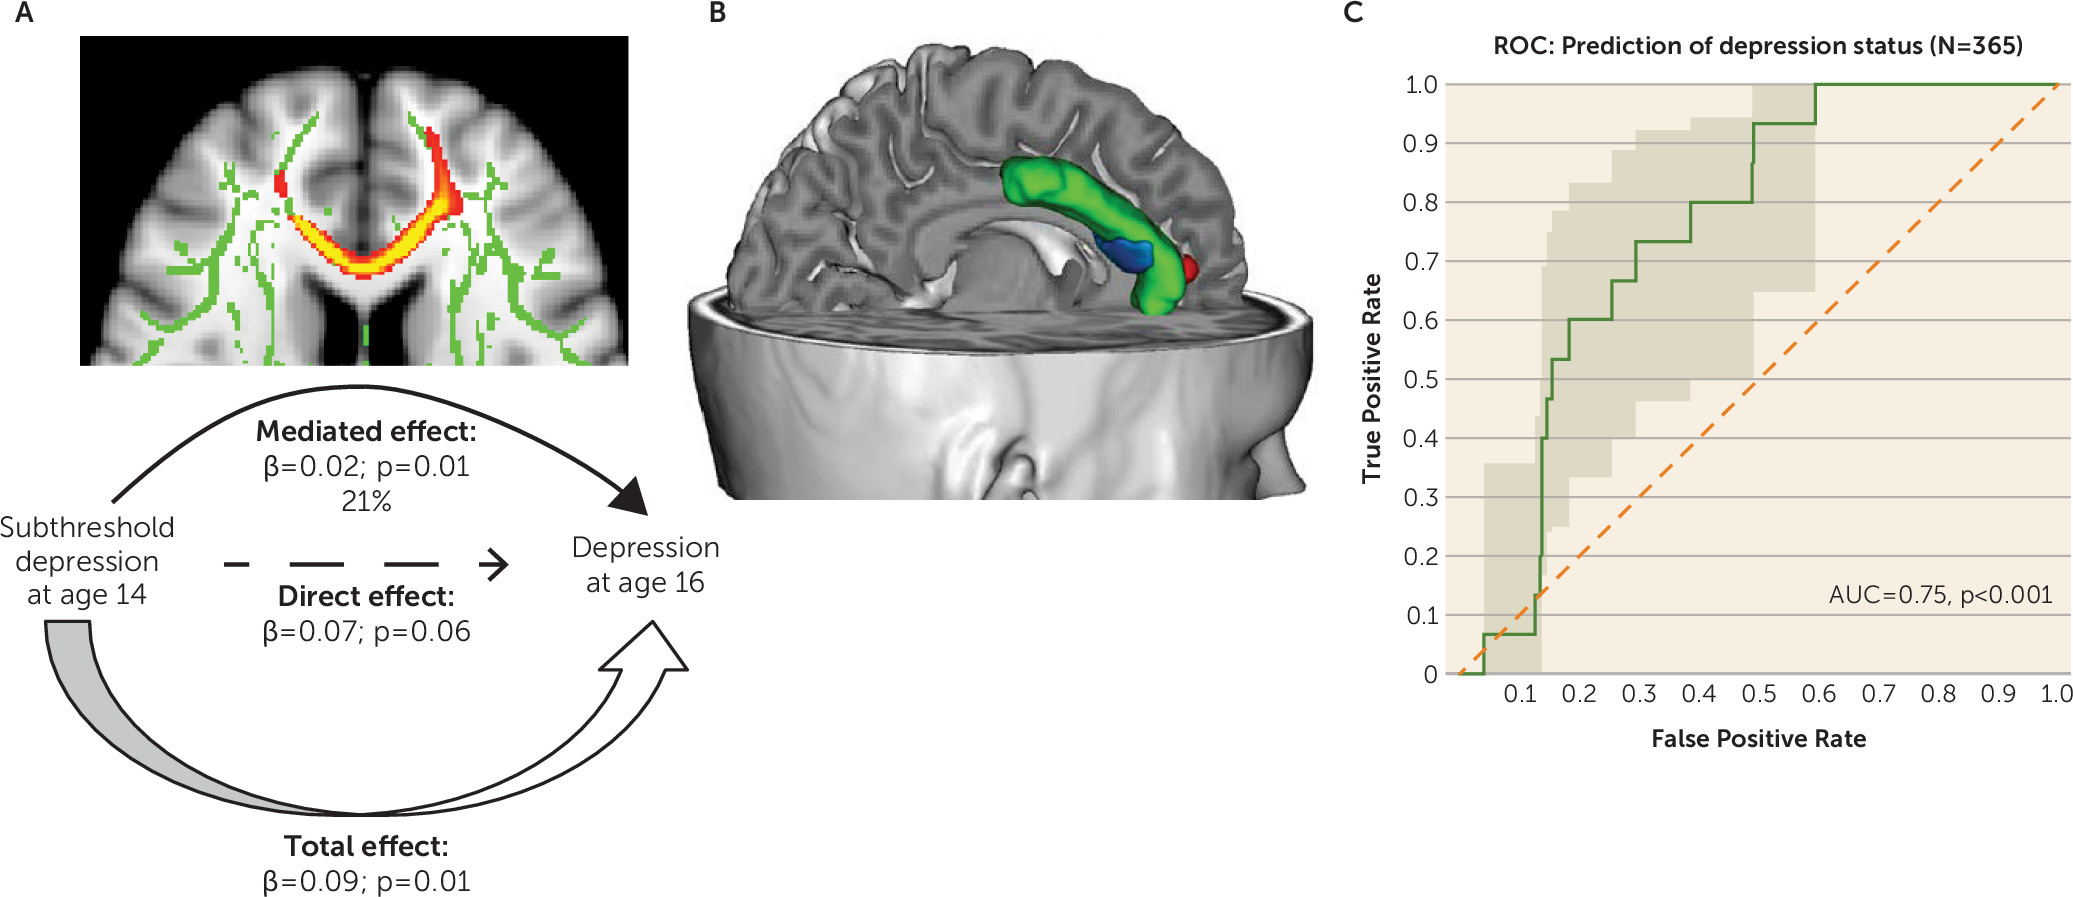
Longitudinal Analyses
| Effect Type | Point Estimate | 95% CI | p |
|---|---|---|---|
| Mediator variable: FA values | |||
| Mediation effect (subthreshold depression at age 14–FA–depression at age 16) | 0.018 | 0.004, 0.044 | 0.01 |
| Direct effect (subthreshold depression at age 14–depression at age 16) | 0.067 | –0.001, 0.162 | 0.06 |
| Total effect | 0.085 | 0.016, 0.184 | 0.01 |
| Proportion of total effect via mediation | 0.206 | 0.042, 0.902 | |
| Mediator variable: MD values | |||
| Mediation effect (subthreshold depression at age 14–MD–depression at age 16) | 0.010 | 0.000,0.027 | 0.06 |
| Direct effect (subthreshold depression at age 14–depression at age 16) | 0.073 | 0.008, 0.016 | 0.02 |
| Total effect | 0.083 | 0.016, 0.177 | 0.01 |
| Proportion of total effect via mediation | 0.017 | –0.002, 0.512 |

Post Hoc Analyses
Discussion
Acknowledgments
Footnotes
Supplementary Material
- View/Download
- 275.39 KB
References
Information & Authors
Information
Published In
History
Keywords
Authors
Funding Information
Metrics & Citations
Metrics
Citations
Export Citations
If you have the appropriate software installed, you can download article citation data to the citation manager of your choice. Simply select your manager software from the list below and click Download.
For more information or tips please see 'Downloading to a citation manager' in the Help menu.
View Options
View options
PDF/EPUB
View PDF/EPUBLogin options
Already a subscriber? Access your subscription through your login credentials or your institution for full access to this article.
Personal login Institutional Login Open Athens loginNot a subscriber?
PsychiatryOnline subscription options offer access to the DSM-5-TR® library, books, journals, CME, and patient resources. This all-in-one virtual library provides psychiatrists and mental health professionals with key resources for diagnosis, treatment, research, and professional development.
Need more help? PsychiatryOnline Customer Service may be reached by emailing [email protected] or by calling 800-368-5777 (in the U.S.) or 703-907-7322 (outside the U.S.).

