CT Findings
Of the 142 patients in this study, 48 had single lesions restricted to cortical or subcortical structures as assessed by CT scan. In all cases, brain lesions were found by a neurologist to be compatible with findings on neurologic examination. Cortical lesions were found in 13 of 27 patients (48.1%) in the control group, 0 of 4 patients (0%) in the MDD-only group, and 4 of 5 patients (80%) in the MDD plus GAD group. These were statistically significant intergroup differences in the frequency of cortical lesions (χ2=7.4, df=2, P=0.03).
Relationship to Diagnostic Outcome
We next examined diagnostic outcome among groups. There were significant intergroup differences in the frequency of major depression at short-term follow-up (control: 5 of 73; MDD only: 0 of 8; MDD+GAD: 9 of 14; χ2=24.7, df=2, P<0.0001). Most patients with MDD plus GAD remained depressed at short-term follow-up, whereas none of the MDD-alone patients remained depressed (MDD only vs. MDD+GAD, χ2=6.3, P=0.02). There were no significant intergroup differences, however, in the persistence of major depression at long-term follow-up (control: 12 of 78; MDD only: 1 of 4; MDD+GAD: 0 of 9; χ2=3.2, df=2, P>0.1).
We also examined changes in the severity of depression (Ham-D scores) during the follow-up evaluation. A one-way ANOVA of Ham-D scores for the patients with 3- to 6-month follow-up showed that patients who had MDD plus GAD in-hospital had significantly higher depression scale scores at both time evaluations than did patients with MDD only or control subjects (initial: F=87.8, df=2,86, P<0.0001; short-term follow-up: F=15.4, df=2,86, P<0.0001). Post hoc test (Scheffé) demonstrated that patients with MDD plus GAD had significantly higher depression scale scores at both time evaluations than did patients with MDD only (initial: P<0.001; short-term follow-up: P<0.05). In contrast, one-way ANOVA of Ham-D scores for the patients with 12- to 24-month follow-up showed significantly higher in-hospital depression scores for the MDD plus GAD patients than for patients with MDD only or control subjects, but there were no significant differences among the groups at long-term follow-up (initial: F=48.4, df=2,86, P<0.0001; long-term follow-up: F=1.6, df=2,86, P>0.1).
Effect of MDD and GAD on Impairment and Recovery
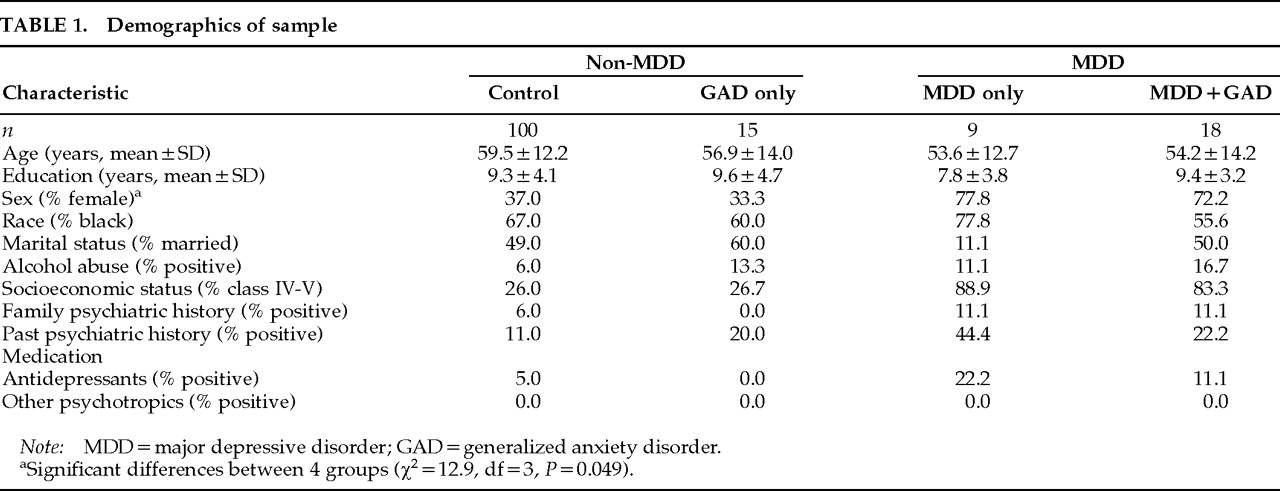
We found that non-MDD patients tended to be older than patients with MDD (non-MDD, 59.2±12.4, vs. MDD, 54.0±13.0: t=1.93, df=140, P=0.056), and non-GAD patients tended to have larger lesion volumes than patients with GAD (non-GAD, 7.4±7.3, vs. GAD, 3.4±2.8: t=1.97, df=65, P=0.054). Values are reported as means and standard deviations.
For the purpose of excluding factors other than MDD or GAD that were known to effect stroke outcome, the following analyses were done, using patients who were matched for age (±2 years), education (±2 years), and lesion volume (±2% of total brain volume).
Relationship to Cognitive Impairment and Recovery:
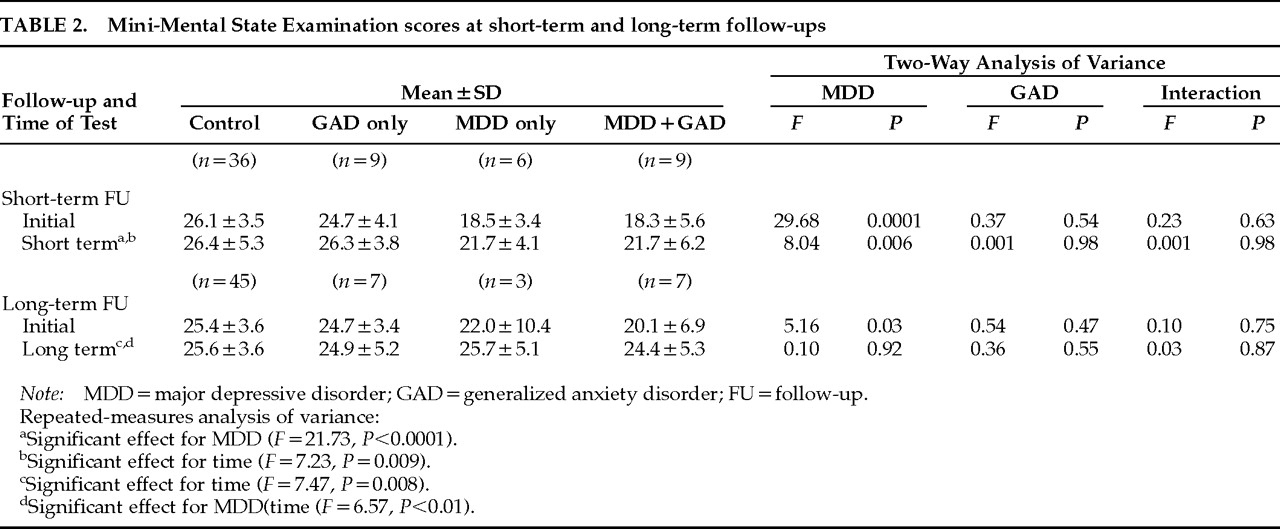
In short-term follow-up, repeated-measures ANOVA of MMSE scores (factor 1: presence or absence of MDD; factor 2: presence or absence of GAD) showed significant effects for MDD (
F=21.7, df=1,56,
P<0.0001) and time (
F=7.23, df=1,56,
P=0.009), but no significant effect for an MDD×time interaction and no significant effect for GAD (
Table 2). A two-way ANOVA at each time showed a significant effect for MDD at both initial and short-term follow-up (initial:
F=29.68, df=1,56,
P<0.0001; short-term:
F=8.04, df=1,56,
P=0.006), but no effect for GAD and no MDD×GAD interaction. Similarly, in long-term follow-up, repeated-measures ANOVA of MMSE scores showed a significant effect of MDD×time interaction (
F=6.57, df=1,58,
P<0.01), but not of GAD or other interaction. A two-way ANOVA at each time showed a significant effect of MDD at initial evaluation (
F=5.16, df=1,58,
P=0.03), but not at long-term follow-up (
F=0.10, df=1,58,
P=0.8). In contrast, there was no significant effect of GAD, and there were no significant interaction effects at either time.
Relationship to Physical Impairment and Recovery:
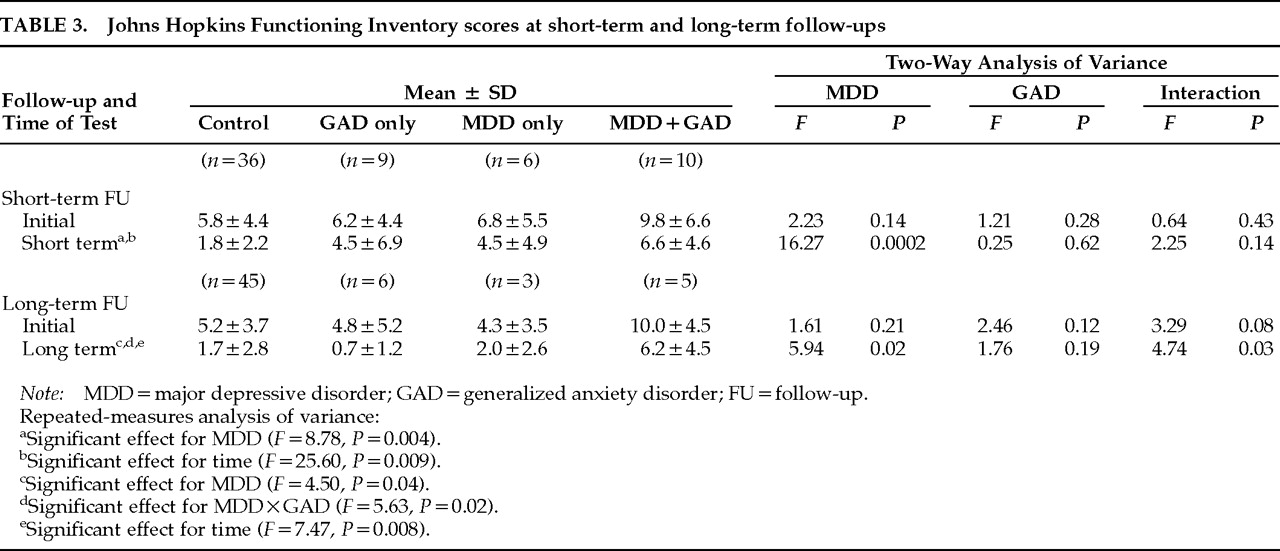
Repeated-measures ANOVA of JHFI scores for the patients with 3- to 6-month follow-up showed a significant effect for MDD (
F=8.78, df=1,57,
P=0.004) and time (
F=25.60, df=1,57,
P<0.0001), but no significant effect for GAD or MDD×GAD interaction (
Table 3). A two-way ANOVA at each time showed no significant effect at the initial evaluation. In contrast, however, patients with major depression had significantly lower JHFI scores at short-term follow-up than those who were not depressed (MDD:
F=16.27, df=1,57,
P=0.0002).
Repeated-measures ANOVA of JHFI scores for patients with 12- to 24-month follow-up showed significant effects for MDD (F=4.50, df=1,55, P=0.04) and MDD×GAD interaction (F=5.63, df=1,55, P=0.02), but no significant effect for GAD or other interaction. A two-way ANOVA at each time showed significant effects for MDD and an interaction with GAD at long-term follow-up (MDD: F=5.94, df=1,55, P=0.02; MDD×GAD: F=4.45, df=1,40, P=0.04). Thus, patients who had both MDD and GAD in-hospital were more impaired in their activities of daily living at long-term follow-up than were control patients or patients with GAD alone.
Relationship to Social Functioning:
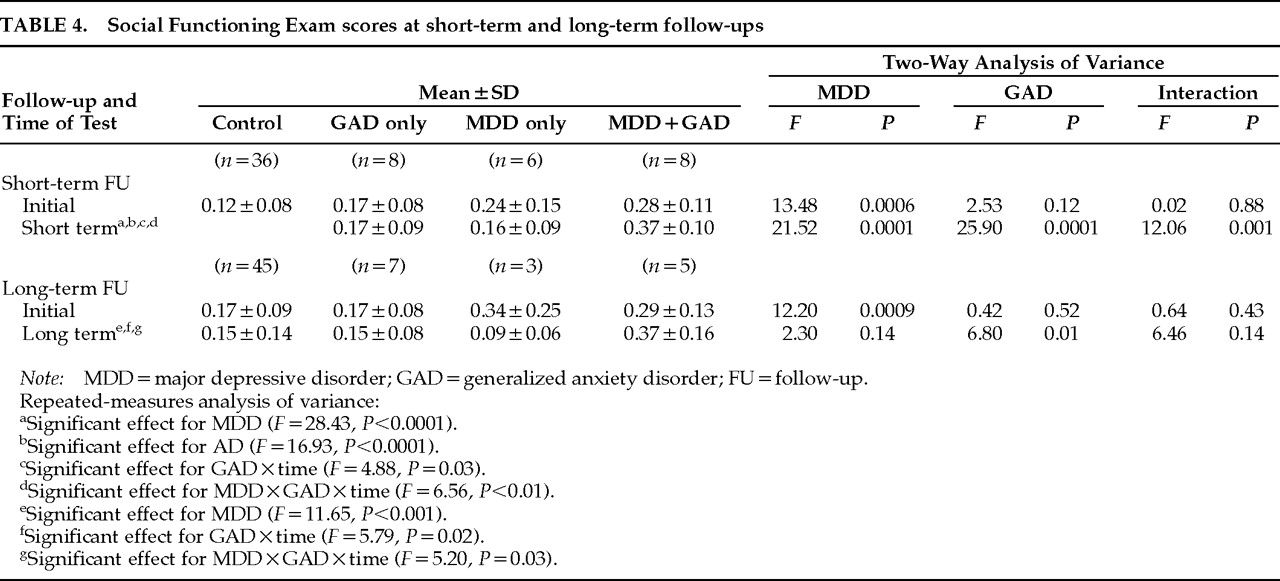
Repeated-measures ANOVA of SFE scores for the patients with 3- to 6-month follow-up showed significant effects for MDD (
F=28.43, df=1,54,
P<0.0001), GAD (
F=16.93, df=1,54,
P<0.0001), GAD×time interaction (GAD×time:
F=4.88, df=1,54,
P=0.03) and MDD×GAD×time interaction (MDD×GAD×time:
F=6.56, df=1,54,
P<0.01), but no significant effect for MDD×GAD interaction (
Table 4). A two-way ANOVA at each time showed a significant effect for MDD at both times (initial:
F=13.48, df=1,54,
P<0.001; short-term:
F=21.52, df=1,54,
P<0.0001). There were significant effects for GAD and interaction with MDD at short-term follow-up (GAD:
F=25.90, df=1,54,
P<0.0001; MDD×GAD:
F=12.06, df=1,54,
P<0.001).
Repeated-measures ANOVA of SFE scores for patients with 12- to 24-month follow-up showed significant effects for MDD (F=11.65, df=1,56, P<0.001), GAD×time (F=5.79, df=1,56, P=0.02), and MDD×GAD×time interaction (F=5.20, df=1,56, P=0.03). A two-way ANOVA at each time showed a significant effect for MDD at initial evaluation (F=12.20, df=1,56, P=0.0009). In contrast, there were significant effects for GAD (F=6.80, df=1,56, P<0.01) and MDD×GAD interaction (F=6.46, df=1,56, P<0.01) at long-term follow-up, but not at initial evaluation. Thus, patients with MDD plus GAD in the hospital were more socially impaired at long-term follow-up than control patients or patients with MDD alone.
