Obsessive-compulsive disorder (OCD) is a prevalent, serious neuropsychiatric disorder
(1) of unknown etiology. Several lines of investigation into the cause(s) of OCD have suggested that it is characterized by dysfunction within a basal ganglia-thalamocortical neuronal circuit
(2, 3). In particular, the corpus striatum has shown abnormalities in patients with OCD compared with normal subjects in several imaging studies
(4–6). Positron emission tomography (PET) and functional magnetic resonance imaging (MRI) studies during symptom provocation have revealed activation within the corpus striatum (specifically in the caudate) along with other brain regions (medial orbitofrontal cortex, anterior cingulate, amygdala)
(7–8). Studies of OCD patients following treatment with either pharmacotherapy or behavioral therapy indicate that functional abnormalities in the corpus striatum normalize as a correlate of symptom reduction
(5, 6). Additional support for the involvement of the basal ganglia-thalamocortical neuronal circuit in OCD comes from the finding of neurosensory “gating” abnormalities in patients with OCD. These gating deficits are consistent with dysfunction within this neuronal circuit
(9, 10).
Several investigators have attempted to delineate a neuroanatomic abnormality in OCD by measuring the size or assessing the structural integrity of presumably critical CNS structures. In particular, the corpus striatum has been the focus of a series of computerized tomographic (CT) and, more recently, structural MRI studies
(11–16). These studies have been remarkably inconsistent, with some finding reduced caudate size
(13, 16), another finding increased caudate size
(12), and some finding no differences
(14, 15).
Short echo proton magnetic resonance spectroscopy (
1H-MRS) can be used to obtain information about several metabolites that are highly relevant to our understanding of the mechanisms of dysfunction within neuronal circuits in OCD and other neuropsychiatric disorders
(17, 18).
N-Acetylaspartate (NAA), which is readily measured with the use of
1H-MRS, has become a well-accepted neuronal marker
(17–20). In fact, it is believed that
N-acetylaspartate may decline in neuronal tissue before neuronal loss is detectable by conventional MRI morphometric methods
(21, 22). Glutamate and glutamine, which are also reliably measured with the use of short echo
1H-MRS, are involved in the cycle of excitatory neurotransmission
(17, 18) and thus may yield additional information regarding OCD.
METHOD
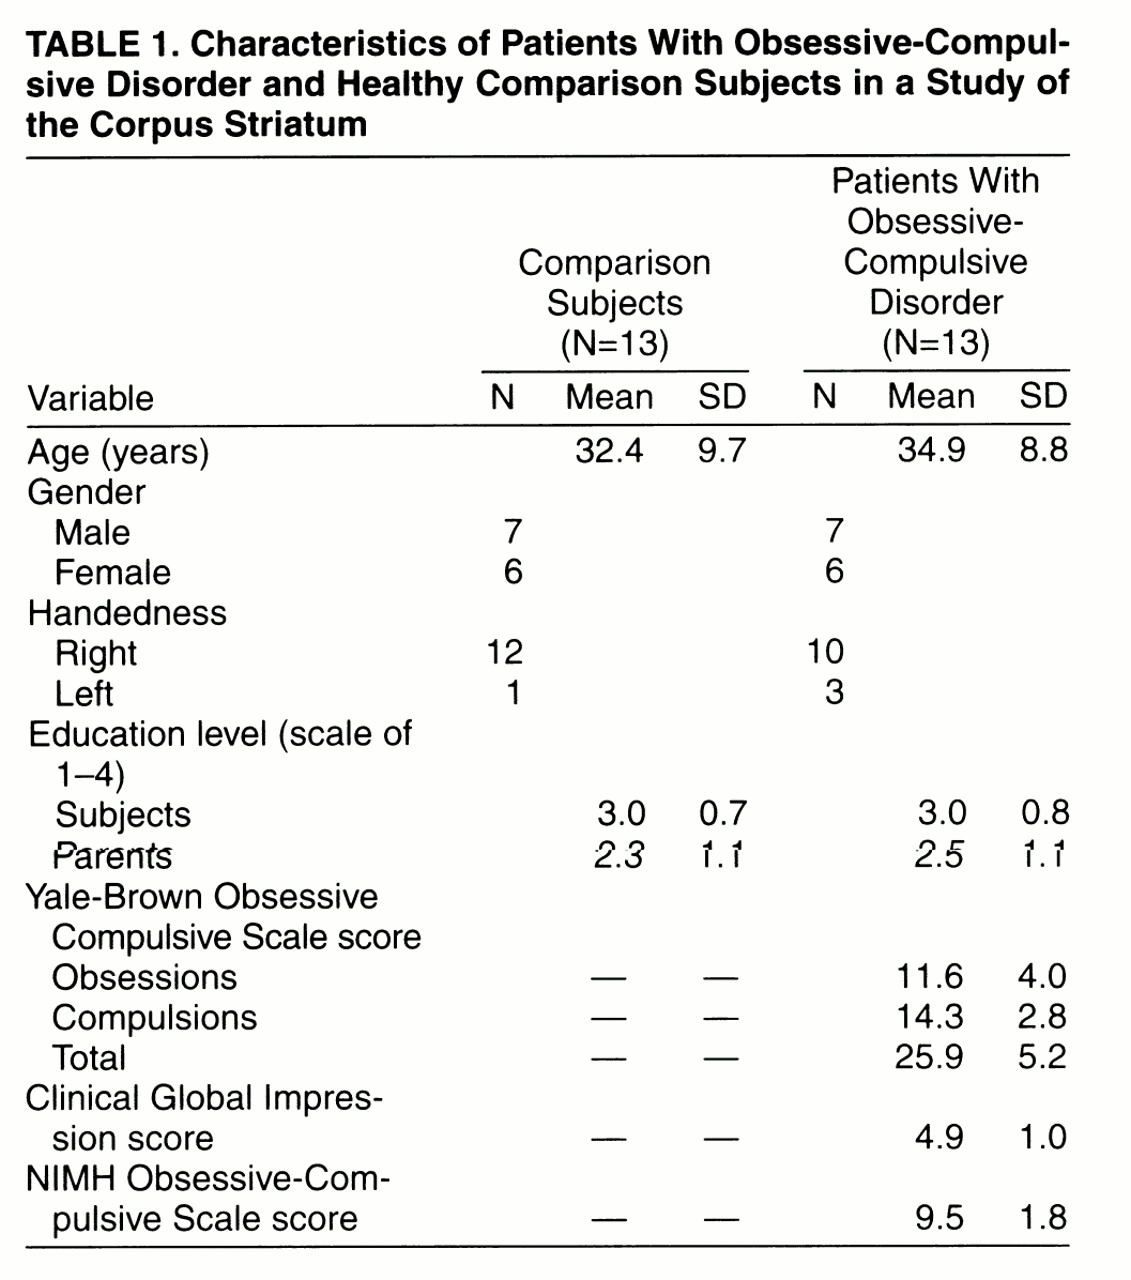
Thirteen patients diagnosed with OCD according to the DSM-IV criteria and 13 healthy comparison subjects were studied. The OCD patients were recruited from among persons seeking treatment at either the Department of Psychiatry, St. Boniface General Hospital, Winnipeg, Canada (N=10), or the Department of Psychiatry, London Health Sciences Centre, London, Canada (N=3). Comparison subjects were chosen from a pool of subjects recruited from the London area by advertisement. Subjects were chosen in such a way as to minimize demographic differences (gender, age, education, parental education, and handedness) between the patient and comparison groups (
table 1).
Subjects with OCD were diagnosed by an experienced clinician-researcher (M.B.S.) using a semistructured interview (the Structured Clinical Interview for DSM-IV Axis I Disorders, Patient Edition [SCID-P]
[23]). Comorbidity, family history, and other illness parameters (e.g., age at onset) were assessed at this time as part of the clinical interview, as was the patient’s medical and prior treatment history. The same experienced interviewer (M.B.S.) determined the severity of OCD symptoms using the Yale-Brown Obsessive Compulsive Scale
(24, 25), the Clinical Global Impression (CGI) scale
(26), and the National Institute of Mental Health (NIMH) Obsessive-Compulsive Scale
(27). One patient had clinical depression at the time of the study. All OCD subjects were outpatients and had no other current comorbidity including tics.
The subjects with OCD and the healthy comparison subjects were required to have been medication free for a minimum of 6 weeks before the day of scanning (nine patients had never received antidepressant medication), to be otherwise in good physical health, and to have no history of significant head injury or seizures. One subject had a history of neuroleptic exposure 2 years before this study. None of the OCD subjects was participating in formal behavioral or cognitive therapy during the time of the study, nor were they involved in any form of self-help cognitive or behavioral therapy for their condition. As part of the magnetic resonance study, routine clinical images were collected for each subject and viewed by a radiologist (T.J.C.), who detected no gross abnormalities on any scans. In addition to the aforementioned criteria, the healthy comparison subjects underwent a routine clinical interview and were screened with the SCID-P by another experienced clinician-researcher (P.C.W.) to ensure that they did not meet criteria for any axis I or axis II psychiatric disorders.
The education level of each subject was rated on a 4-point scale (1=grade 10 or lower; 2=grades 11–13; 3=1–3 years of college or university; 4=4 or more years of college or university). Parental education ratings were also evaluated as above for the most highly educated parent. The handedness of each subject was defined by a handedness questionnaire
(28). The height and weight of each subject were also recorded so that these characteristics could be used as covariates in the statistical analysis of the volumetric data.
After complete description of the study to each subject, written informed consent was obtained. The study was approved by the Faculty of Medicine Human Subjects Committee of the University of Manitoba and the Review Board for Health Sciences Research Involving Human Subjects of the University of Western Ontario.
1H-MRS
Spectroscopy data were acquired as described in detail elsewhere
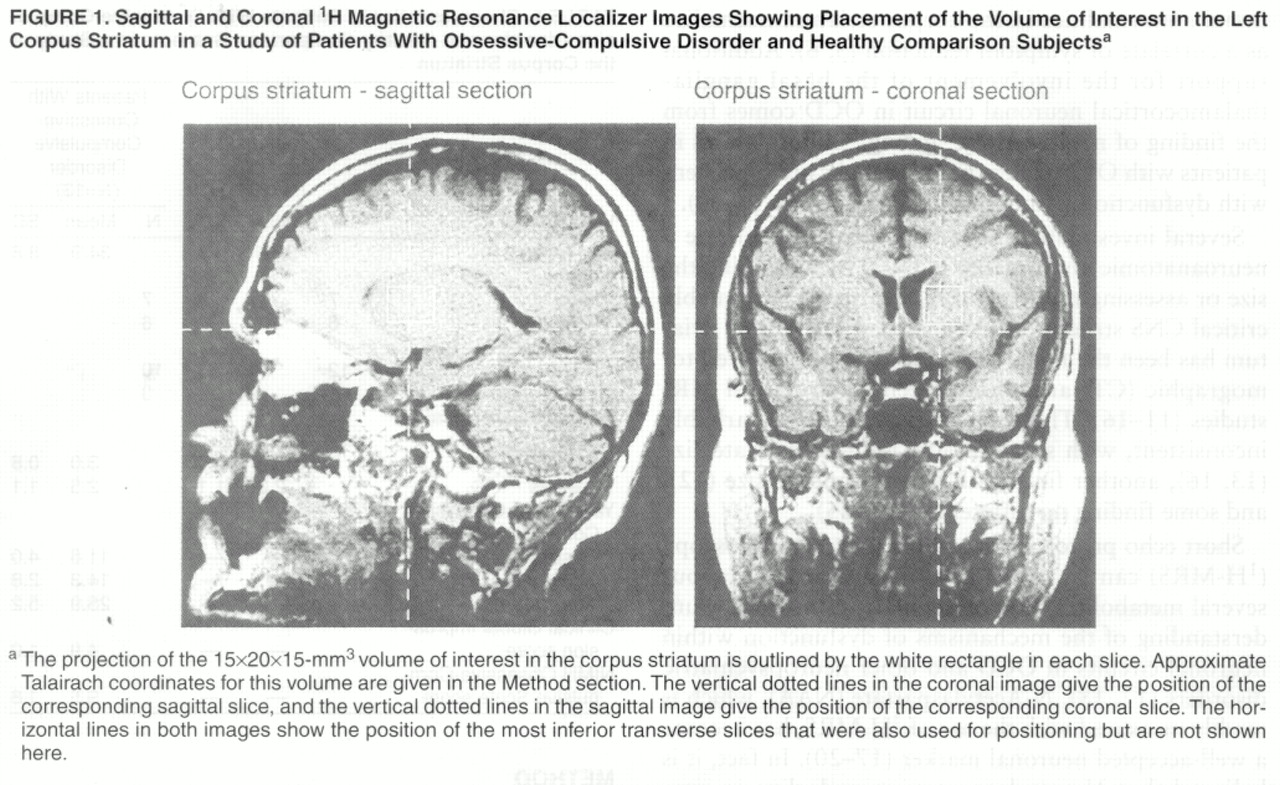
(29). Spectra were acquired from a 15×20×15-mm
3 volume of interest in the left corpus striatum (
figure 1). Although the images used to position the volume of interest were not transformed to Talairach space
(30), the volume of interest studied was approximately positioned within the volume defined by the following Talairach coordinates: x=0 to –15, y=–10 to 20, and z=0 to 15. Both water suppressed
(31) and water unsuppressed spectra were acquired with the use of a stimulated echo acquisition mode
(32) sequence (TR=1500 msec, TE=20 msec, mixing time=30 msec, 4096 complex points, 250 µsec dwell time, 550 and 30 data acquisitions, respectively).
Spectral Processing
Spectral processing is also described in detail elsewhere
(29, 33). Each spectrum was fitted to a complete spectrum model composed of 12 metabolites
(19, 24, 34–
36) and three macromolecules
(37) with resonances between 1.9 ppm and 3.5 ppm (NAA
CH3 was referenced to 2.01 ppm). The footnote to
figure 2 contains a complete list of the metabolites and macromolecules included in the spectrum model.
Metabolite levels were normalized to the unsuppressed water signal following correction for the partial volume effect
(29, 35) of the ratio of CSF, gray matter, and white matter (estimated as 1%/60%/39%). Therefore, metabolite levels represent the average metabolite level (and standard deviation) in the volume studied, uncorrected for the nuclear magnetic resonance relaxation parameters T
1 and T
2 (since accurate values were unavailable for each metabolite).
Volumetric Imaging
The entire brain of each subject was imaged on the same magnetic resonance scanner and on the same day that the
1H-MRS data were acquired. Volumetric images consisted of 128 contiguous 1.56-mm-thick coronal slices (0.94×0.94-mm in-plane resolution) acquired with the use of a three-dimensional fast low-angle shot
(38) sequence (TR=30 msec, TE=10 msec). To measure consistent volumes of the head of the caudate nucleus, ANALYZE software
(39) was used to reformat the coronal slices into slices perpendicular to a plane joining the most inferior margin of the splenium with the most inferior margin of the genu of the corpus callosum. The head of the caudate nucleus, bordered by a plane parallel to the anterior portion of the pons
(13), a plane parallel to the anterior commissure, the frontal horn of the lateral ventricle, and the anterior limb of the internal capsule
(14), was segmented by means of a semiautomated histogram technique in Xstatpack (a multipurpose image quantification utility for use by medical imagers, J. Davis, 1990–1998; for more information, contact the third author). The volumes of 10 subjects were calculated twice on the same scan to determine test-retest reliability. All volume measurements were performed by the same rater (M.D.) without knowledge of diagnosis or MRS measures.
Statistical Analysis
All statistical tests were performed with SPSS release 6.0
(40). The age, education level, parental education level, height, and weight of the subjects were comparable in the two groups (t<0.5, df=24, p>0.50, two-tailed test). The use of these variables as covariates therefore allowed for the reduction of extraneous variance in error terms without risking removal of genuine group effects
(41, 42).
Although 12 metabolites and three macromolecules were modeled for each spectrum, only metabolites quantified with a coefficient of variation less than 75% were considered reliable and were included in between-group comparisons. Since N-acetylaspartate was the focus of hypothesized differences, values of this metabolite were submitted to analysis of covariance (ANCOVA); the remaining measures were analyzed by multivariate analysis of covariance (MANCOVA). Age, education, and parental education were used as covariates in these tests. A p value of ≤0.05 (two-tailed) was considered statistically significant.
Caudate volume repeated measure stability was assessed with intraclass correlation coefficients (ICCs)
(43). Caudate volumes of OCD patients and comparison subjects were compared by ANCOVA, with age, height, and weight as covariates. A p value of ≤0.05 (two-tailed) was considered statistically significant in these analyses also.
To establish whether estimated metabolite levels were related (because of physiology or quantification artifact), we did bivariate correlations between reliably quantified metabolites (coefficient of variation less than 75%). We also did bivariate correlations between metabolites that showed group differences and caudate volumes, and between these metabolites and symptom scores (Yale-Brown Obsessive Compulsive Scale, CGI, and NIMH Obsessive-Compulsive Scale). Correlations were done independently for each subject group. Values for significance (p) for all correlations were determined on the basis of a Bonferroni correction
(44), since there were no prior hypotheses.
RESULTS
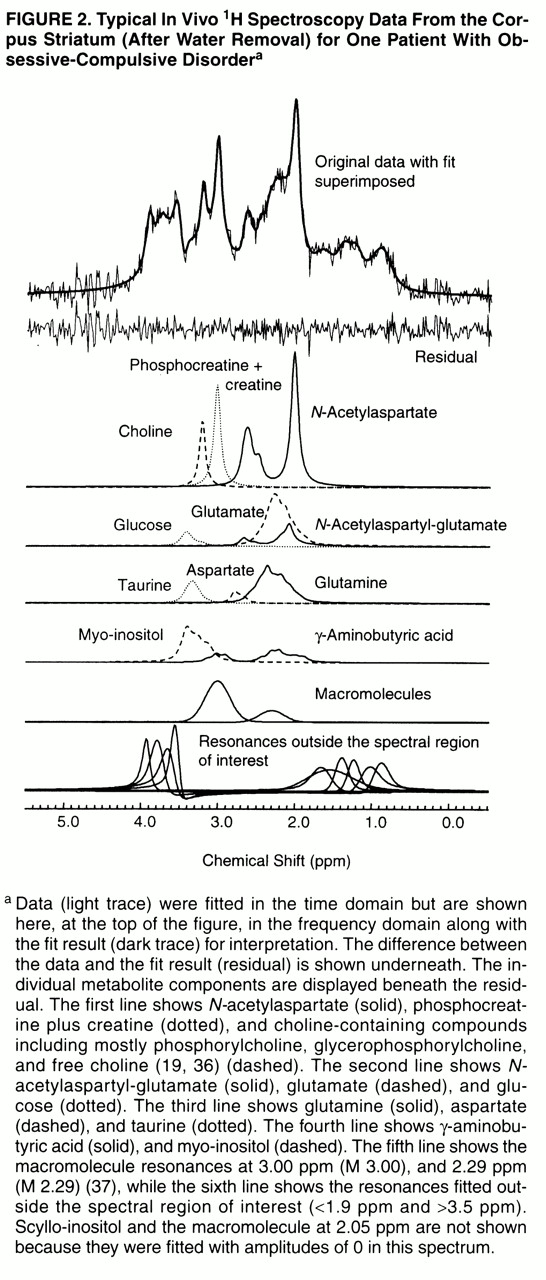
Spectra from all 13 OCD patients and all 13 comparison subjects were quantified. A typical spectrum (after water removal) acquired from the left corpus striatum of one OCD patient is shown in
figure 2. It is displayed in the frequency domain after Fourier transformation
(45), although all quantification was done in the time domain. The average signal-to-noise ratio, measured as the
N-acetylaspartate area divided by the root-mean-square of the noise level in the time domain, was 8.6:1 (SD=1.2:1) for the 13 comparison subject spectra and 8.0:1 (SD=1.6:1) for the 13 OCD patient spectra. The average full width at half maximum of the unsuppressed water spectra was 6.2 Hz (SD=0.7) for the comparison subjects and 6.7 Hz (SD=0.5) for the OCD patients.
Spectroscopy Results
Seven of the 12 quantified metabolites and two macromolecules had coefficients of variation less than 75% and were included in the statistical analysis. These included
N-acetylaspartate, glutamate, glutamine,
N-acetylaspartyl-glutamate, taurine, choline-containing compounds, and phosphocreatine plus creatine, as well as the macromolecules at 2.29 ppm and 3.00 ppm. The metabolites γ-aminobutyric acid, aspartate, glucose, scyllo-inositol, and myo-inositol and the macromolecule at 2.05 ppm were quantified with coefficients of variation greater than 75% and were therefore considered unreliable and excluded from the statistical analysis.
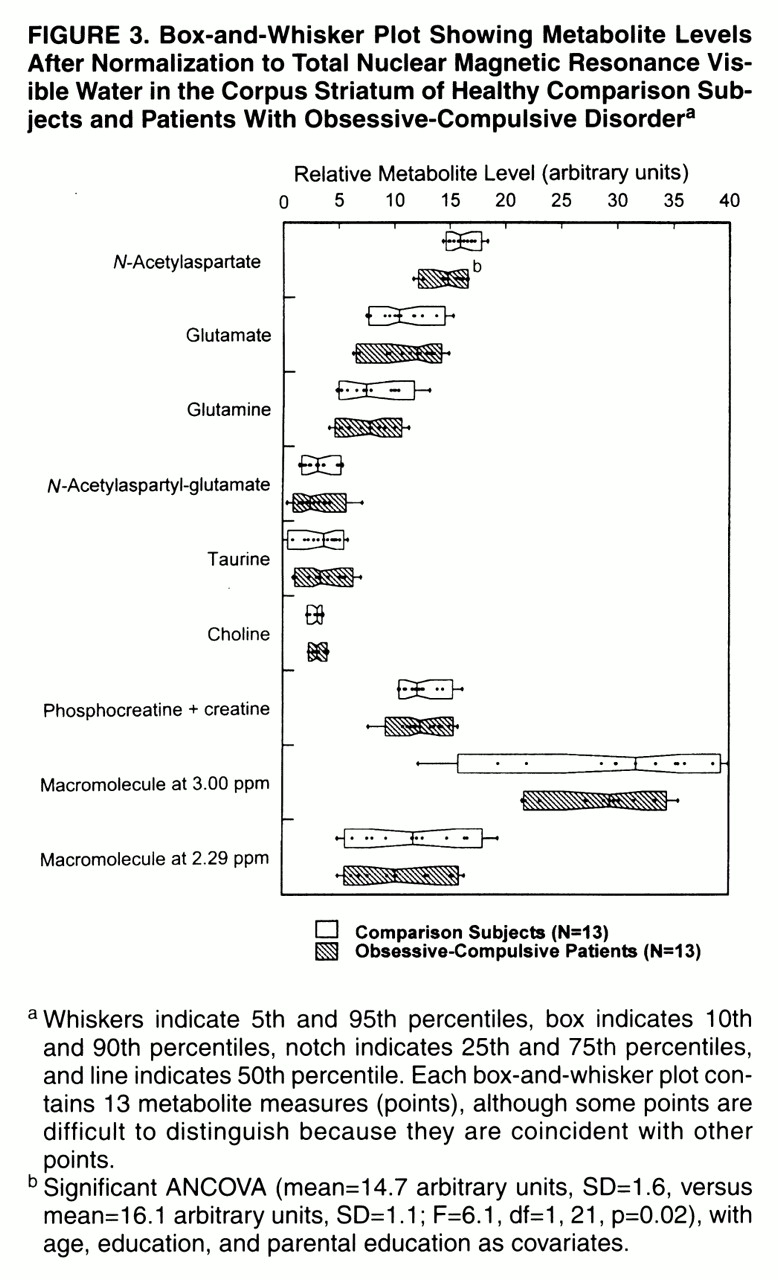
Figure 3 shows the estimated metabolite and macromolecule levels of the metabolites included in the statistical analysis for each subject group. The groups differed with respect to
N-acetylaspartate, which was significantly lower in the OCD patients than in the comparison subjects. The MANCOVA for the remaining six metabolites and two macromolecules listed above did not show an overall statistically significant difference between the OCD patients and comparison subjects (F=0.22, df=8, 14, p=0.98).
Volumetric Imaging Results
The ICCs for test-retest reliability were 0.86 and 0.90 for left and right caudate volumes, respectively. ANCOVA showed no differences between the patients with OCD and the comparison subjects in left caudate volume (mean=4.6 cm3, SD=0.7, and mean=4.4 cm3, SD=0.5, respectively; F=1.76, df=1, 21, p=0.20) or right caudate volume (mean=4.8 cm3, SD=0.7, and mean=4.6 cm3, SD=0.4, respectively; F=0.95, df=1, 21, p=0.34).
Bivariate Correlations
Plots of each correlation (available on request from the third author) were visually inspected and showed no evidence of outliers or anomalies that could give rise to false correlations. The correlations reported here were significant after Bonferroni correction
(44). Metabolite correlations in the comparison group showed that glutamate was inversely correlated with glutamine (r=–0.70, df=11, p=0.007), and phosphocreatine plus creatine was positively correlated with the macromolecule at 2.29 ppm (r=0.76, df=11, p=0.003). In the OCD group,
N-acetylaspartate was positively correlated with glutamate (r=0.75, df=11, p=0.003), and phosphocreatine plus creatine was positively correlated with choline (r=0.83, df=11, p<0.001) and with the macromolecule at 2.29 ppm (r=0.76, df=11, p=0.002). There were no significant correlations between
N-acetylaspartate levels and symptom scores or left and right caudate volumes.
DISCUSSION
We found decreased levels of
N-acetylaspartate in the left corpus striatum of OCD patients compared with healthy subjects, without a corresponding decrease in caudate volume. Recently, Ebert et al.
(46) also independently reported decreased
N-acetylaspartate levels in the right striatum of OCD patients compared with healthy subjects. Reduced
N-acetylaspartate levels are often reported in disorders such as Alzheimer’s disease
(47) that are associated with neuronal loss. In the absence of differences in caudate volume between groups in this study, the lower
N-acetylaspartate levels in the OCD patients may indicate a greater sensitivity of this metabolite, compared with measurement of tissue volume, for the detection of neuronal loss
(21). Our finding would be consistent with this interpretation and might explain the discrepancy among prior studies in the detection of differences in caudate volume in patients with OCD, since small-scale volume loss might not have been detectable. It remains to be determined whether age at onset, severity and duration of illness, or etiology might explain this apparent heterogeneity in caudate volumes among subjects. However, if replicated, our findings would support the notion that reduced neuronal density in the corpus striatum—albeit of a magnitude that is not readily detectable with the use of conventional imaging techniques—is a feature of many cases of OCD.
Since
N-acetylaspartate is found primarily within neurons in the brain
(20), reduced
N-acetylaspartate levels suggest decreased neuronal density within the volume studied. What pathophysiologic processes might lead to this state? One attractive hypothesis is that neuronal loss leading to reduced
N-acetylaspartate levels could result from an excitotoxic process caused by an increase in activity of afferent glutamatergic neurons from the prefrontal cortex. A recent functional MRI study
(8) showed increased activation in the corpus striatum during symptom provocation of patients with OCD, suggesting that increased afferent input to this region—much of which is glutamatergic
(48)—may be an important factor in the pathophysiology of OCD symptoms. However, previous PET and single photon emission computed tomography neutral-state studies have not consistently shown increased activity in the corpus striatum
(4, 5). In interpreting the literature on brain function in OCD, however, one must consider that the interpretation of relative differences in either blood flow or glucose utilization in the corpus striatum might be confounded by actual differences in neuronal density between patients and comparison subjects. In fact, if reduced corpus striatum
N-acetylaspartate is replicated in other studies of patients with OCD, an argument could be made in favor of correcting for neuronal density in functional studies of the corpus striatum in OCD.
There are undoubtedly several alternatives to a glutamatergic excitotoxic explanation for reduced corpus striatum neuronal density in OCD. Most promising among these explanations is the possibility that OCD may be caused by an autoimmune process
(49–52). Antibodies directed against β-hemolytic streptococcus cross-react with corpus striatum neurons
(53, 54). Damage to the corpus striatum caused by such a process could lead to decreased neuronal density and decreased
N-acetylaspartate levels as were observed in this study. This damage, unless extensive, would not necessarily lead to volume changes that could be detected with conventional magnetic resonance morphometry.
There are a number of alternative explanations for our findings, as well as a number of unanswered questions. It is possible, for example, that changes in OCD occur selectively or predominantly in particular striatal structures (e.g., the caudate, the putamen)
(16, 55, 56) rather than generally throughout the corpus striatum. Our voxel size and positioning were such that both the caudate and putamen were sampled, perhaps to differing degrees in different patients, leaving us unable to discern whether low
N-acetylaspartate levels were confined to one or both of these structures. This possibility warrants more careful scrutiny in future studies.
Another possible explanation for the variability in caudate findings across the literature, and for the reduction of
N-acetylaspartate in our particular patient group, may be that our patients lacked tic symptoms
(55, 57). As others have suggested
(15), heterogeneity within and among samples for the presence of tic symptoms may lie at the heart of the inconsistent caudate volume findings in OCD. This issue could be resolved by conducting a study where two groups of patients with OCD—one group with and one group without substantial tic symptoms—are included.
Ramifications of technical limitations must also be considered. Although the volume studied was small (4.5 cm
3) and positioning was done with the aid of images to sample only the caudate (gray matter), all voxels contained partial volumes of the internal capsule (white matter) and putamen (gray matter). Since
N-acetylaspartate levels measured by MRS are slightly higher in gray matter than white matter, a decrease in the ratio of gray matter to white matter within a volume of interest would result in a measured decrease of
N-acetylaspartate level. Since no differences between the two groups in caudate volume were observed, it is unlikely that decreased gray matter content within the volume of interest studied in the OCD patients is the cause of observed differences in
N-acetylaspartate levels. Furthermore, assuming
N-acetylaspartate levels are 25% higher in gray matter than in white matter
(35) and that the average comparison subject volume contained 60% gray matter and 40% white matter, if partial volume were the sole reason for the observed decrease in
N-acetylaspartate levels (9%) in the OCD patients, the average OCD volume would have contained only 20% gray matter and 80% white matter, a highly unlikely scenario.
