Verbal fluency involves the generation of words from letter cues. Deficits in verbal fluency performance are associated with frontal lobe lesions (
1–
3), although functional imaging studies suggest that the task engages a distributed network of cortical areas (
4–
6). The task can be presented in a variety of forms—auditory or visual, paced or unpaced, overt or covert, and with random or constrained output. Task performance depends on multiple cognitive processes, including sensory processing of the cue, retrieval of words from memory, the selection of a word appropriate for the cue, and covert or overt articulation of the word.
Despite variability in study design, the results from verbal fluency experiments carried out with use of positron emission tomography (PET) have been reasonably consistent (
4–
6). In normal subjects, cued generation of words compared to word repetition or rest has repeatedly been associated with changes in regional cerebral blood flow (CBF) in the left prefrontal cortex and left or bilateral superior temporal gyri (
7). Some studies have also found that the pattern of blood flow change over time is negatively correlated between frontal and temporal regions; i.e., regional CBF is increased frontally during word generation but increased in the temporal cortex during word repetition (
6). However, others have found positively correlated frontal and temporal blood flow changes, with both regions showing increased regional CBF during word generation (
7). These differences in frontotemporal correlation or “functional connectivity” may reflect differences between studies in the details of experimental design; in particular, negative correlations between frontal and temporal regional CBF changes have been most consistently observed under conditions of overt vocalization.
PET has also been used to investigate CBF changes during verbal fluency tasks in patients with schizophrenia. A series of studies in acutely ill, drug-free (
8), and chronically ill patients with distinct symptom profiles (
9) has suggested that schizophrenic patients demonstrate abnormally correlated regional CBF changes in frontal and temporal regions in comparison with control subjects. Specifically, when scanned under identical conditions, schizophrenic subjects have demonstrated small, positive frontotemporal correlations in regional CBF, compared to relatively large, negative correlations in control subjects. These findings have contributed to the notion that frontotemporal dysconnectivity (or “sejunction,” to use Wernicke's term [10]) may be a central pathophysiological feature of schizophrenia (
11,
12).
It is interesting that these studies have not found differences between control subjects and schizophrenic subjects in the magnitude of frontal blood flow change during verbal fluency tasks. This is in contrast to long-standing observations of attenuated frontal (hypofrontal) blood flow response in patients with schizophrenia when they are performing other tasks, such as the Wisconsin Card Sorting Test, that reliably induce large regional CBF changes in the dorsolateral prefrontal regions of control subjects (
13). Although these two forms of abnormality (frontotemporal dysconnectivity and hypofrontality) have previously been reported separately, they need not be mutually exclusive. Indeed, if experimental variance in the frontal cortex is normally determined in large part by an effective or causal connection from the temporal cortex (
14), then it is easy to see that hypofrontality and frontotemporal dysconnectivity might coexist.
The development of echoplanar (functional) magnetic resonance imaging (MRI) provides a relatively new method for studying the neural correlates of verbal fluency. Increased activity in a brain region induces a local increase in blood flow that exceeds the metabolic demand for oxygen, increasing the ratio of oxyhemoglobin to deoxyhemoglobin and thereby increasing the apparent transverse relaxation time (T2*)-weighted magnetic resonance signal. This biophysical phenomenon (blood-oxygen-level-dependent contrast [15]) provides an indirect measure of neural activation that can be used to investigate cognitive processing. Although functional MRI has the advantages that it does not entail exposure to radioactivity and provides a theoretically greater spatial and temporal resolution than is possible with use of PET, it does have the limitation of being exquisitely sensitive to subjects' motion, both biological motion (e.g., cardiorespiratory pulsation) and head movement in response to task demands.
To our knowledge, there has only been one previous functional MRI study of paced verbal fluency in schizophrenia (
16). That study used a region of interest analysis to demonstrate decreased magnitude of left prefrontal blood flow and increased magnitude of left temporal cortical blood flow in a schizophrenic group. In common with that study, our experimental design was chosen to resemble that of previous PET studies (
17), except that it involved a covert rather than an overt articulatory response. A covert design was selected because overt speech is often associated with relatively large head movements that could confound functional MRI time series analysis. In addition, covert or subvocal designs may have particular relevance to schizophrenia, since some psychotic phenomena, such as auditory hallucinations, may be derived from the patient's own inner (as opposed to overt) speech (
18). Because previous studies have suggested that the presence of thought disorder and negative symptoms (particularly alogia) may influence verbal fluency performance of persons with schizophrenia (
19), we chose to recruit relatively high-functioning schizophrenic patients in clinical remission who had few symptoms at the time of scanning.
On the basis of the existing literature, we sought to test two hypotheses: 1) that patients with schizophrenia would demonstrate abnormally correlated (connected) responses between frontal and temporal regions and 2) that patients with schizophrenia would demonstrate reduced magnitude of prefrontal activation during word generation.
METHOD
Five male patients with schizophrenia (DSM-IV criteria) and five male volunteers were recruited from the patients and staff at the Maudsley and Bethlem Royal Hospitals, London. All subjects were right-handed according to the Annett scale (
20). The mean age of the comparison subjects was 31.6 years (SD=3.4), and that of the schizophrenic subjects was 29.6 years (SD=9.1). There was no significant difference between the groups in terms of age (t=0.4, df=8, p=0.70).
On the day of scanning, before the scan, each subject was assessed by the same rater (V.A.C.) using a standardized diagnostic interview schedule (Schedule for Affective Disorders and Schizophrenia—Lifetime Version [21]) and measures of psychopathology (Scale for the Assessment of Positive Symptoms [SAPS] [22] and Scale for the Assessment of Negative Symptoms [SANS] [23]) and verbal IQ (combined score on the National Adult Reading Test/Schonnell [24]). The patients had been unwell for a mean of 10.8 years (SD=3.6), during which time they had all been hospitalized on at least one occasion and had experienced positive symptoms. At the time of the study, the patients had low scores on standard symptom measures (SAPS mean score=20.8, SD=7.8; SANS mean score=23.2, SD=11.3) and were receiving stable doses of atypical antipsychotic medication. The mean IQ of the comparison subjects was 120.0 (SD=3.4), and that of the schizophrenic subjects was 116.8 (SD=6.8), a nonsignificant difference (t=1.4, df=8, p=0.20).
At the same assessment, all subjects performed the FAS test (
25) of verbal fluency (three 30-second epochs of unpaced word generation in response to a cue letter). There was no significant difference between the two groups in their ability to generate words: comparison group mean=38 words (SD=7); schizophrenic group mean=40 words (SD=8) (t=0.4, df=8, p=0.70).
Since training affects the neural correlates of cognitive tasks (
26,
27), the experimental procedure was explained in a standardized way. A written instruction sheet was provided on the day of scanning, and the same instructions were repeated verbally three times (during the assessment, before the subject went into the scanner, and just before the task began). All subjects clearly understood the task requirements. Permission was obtained from the ethics committee of the Bethlem and Maudsley National Health Service Trust. After complete description of the study to the subjects, written informed consent was obtained.
We used a periodic design involving presentation of a baseline condition for 30 seconds followed by an activation condition for 30 seconds. This cycle was repeated five times over the course of 5 minutes. During the activation condition, subjects were cued by auditory presentation of a letter (e.g., “F”) every 3 seconds to generate a word beginning with that letter and to internally (subvocally) articulate the word. During the baseline condition, subjects were cued by auditory presentation of the word “rest” every 3 seconds to internally articulate that word. At the end of the acquisition period, subjects were questioned about their ability to perform the task. All members of both groups reported that they were able to perform the task in the scanner without difficulty.
Image Acquisition and Motion Estimation and Correction
Functional MRI data were acquired at the Maudsley Hospital, London, on a GE Signa 1.5-T system (General Electric, Milwaukee) with an ANMR operating console (Advanced Nuclear Magnetic Resonance, Woburn, Mass.) for gradient echo echoplanar imaging. One hundred T
2*-weighted images depicting blood-oxygen-level-dependent contrast (
15) were acquired at each of 14 noncontiguous near axial planes (7 mm thick with 0.7-mm slice skip; in-plane resolution=3 mm) parallel to the anterior commissure-posterior commissure (AC-PC) line (TE=40 msec, TR=3 seconds, number of signal averages=1). To facilitate later registration of individual functional MRI data sets in standard space, a T
1-weighted echo echoplanar imaging data set was acquired during the same session at 43 contiguous near axial planes (3 mm thick with 0.3-mm slice skip; in-plane resolution=1.5 mm) parallel to the AC-PC line (TE=80 msec, TI=180 msec, TR=16 seconds, number of signal averages=8). The AC-PC line was anatomically identified on scout images in the sagittal plane before echo echoplanar imaging data acquisition.
Rigid body motion in three spatial dimensions during functional MRI data acquisition was estimated by a multidimensional search with use of the Fletcher-Davidon-Powell algorithm, and images were realigned by tricubic spline interpolation (
28–
30). The time series at each voxel of the realigned images was then regressed on the time series of concomitant and lagged positional displacements in three dimensions (
31). We did not need to discard any data because of evident motion artifact in the residuals of this regression. However, this second stage of movement correction will attenuate the periodic power in a functional MRI time series if the subject's head moves periodically at the frequency of baseline condition-activation condition alternation during data acquisition. In other words, correction of stimulus-correlated motion entails a risk of reduced power to detect activation.
Image Analysis
Periodic change in signal intensity at the angular frequency of the periodic baseline condition-activation condition input function (2π/60 radians per second in these data) was estimated by pseudogeneralized least squares fit of a sinusoidal regression model to the movement-corrected time series observed at each voxel. Pseudogeneralized least squares fitting involved modeling the residuals of an ordinary least squares fit of the sinusoidal regression model by a first-order autoregressive process (
32,
33), transforming the terms of the regression model by the estimated first-order autoregressive coefficient, and refitting the transformed model by ordinary least squares. The model included sine and cosine waves at the fundamental baseline condition-activation condition frequency of the experimental input function, parameterized by coefficients γ and δ. The power of periodic response to the input function was estimated by (γ
2+δ
2), and this fundamental power divided by its standard error yielded a standardized test statistic, the fundamental power quotient (FPQ), at each voxel (
34). Parametric maps representing FPQ observed at each intracerebral voxel were constructed. In order to sample the distribution of FPQ under the null hypothesis that observed values of FPQ were not determined by the experimental design (with few theoretical assumptions), the 99 images observed in each anatomical plane were randomly permuted, and FPQ was estimated exactly as above in each permuted time series. This process was repeated 10 times, resulting in 10 randomization parametric maps of FPQ at each plane for each subject. (See reference 35 for a general introduction to randomization tests, and references 36 and 37 for applications to PET data analysis.)
Observed and randomization FPQ maps were transformed into the standard space of Talairach and Tournoux (
38) and smoothed by a two-dimensional Gaussian filter (full width at half maximum=7 mm). The median observed FPQ at each intracerebral voxel in standard space was then tested against a critical value of the randomization distribution for median FPQ ascertained from the randomization FPQ maps. For a one-tailed test of size α, the critical value is the 100*(1–α)th percentile value of the randomization distribution. Voxels for which the observed median FPQ exceeded this critical value were considered to be activated with a voxelwise probability of type I error equal to α.
The sign γ indicates the timing of signal increase relative to the input function (
37). If γ is greater than 0, then the modeled response to the experimental function will be relatively increased during the first (baseline) condition; whereas if γ is less than 0, the modeled response will be relatively increased during the second (activation) condition. In the context of this experiment, therefore, negative values of median γ indicated generically increased signal intensity during word generation, and positive values of median γ indicated generically increased signal intensity during word repetition.
Activated voxels with signal maximum during word generation were colored red; activated voxels with signal maximum during word repetition were colored yellow. Activated voxels were displayed against the gray scale background of the template image used for spatial normalization to form a generic brain activation map (
30).
To estimate the difference between the comparison and schizophrenic groups in mean FPQ, we fitted the following analysis of covariance (ANCOVA) model at each intracerebral voxel in standard space:
FPQi,j=β0+β1Gj+β2ΔFPQi,j+ei,j,
where FPQ
i,j is the observed FPQ at the ith voxel in the jth subject, G is a factor coding group membership for each subject (G
j=1 for comparison subjects and G
j=–1 for schizophrenic subjects), and e
i,j is an error term. The covariate δFPQ
i,j is the difference in FPQ estimated at each voxel before and after movement-correcting regression (see above). In other words, δFPQ
i,j will be large and negative at a voxel where correction for stimulus-correlated motion has substantially attenuated the standardized power at the frequency of the input function. The purpose of including this covariate in the model is to control for between-group differences in the extent of stimulus-correlated motion when one is estimating between-group differences in mean FPQ. The null hypothesis of no between-group difference in mean FPQ was tested by comparing the coefficient β
1 to critical values of its nonparametrically ascertained null distribution. To do this, the elements of G were randomly permuted 10 times at each voxel, β
1 was estimated at each voxel after each permutation, and these estimates were pooled over all intracerebral voxels in standard space to sample the randomization distribution of β
1. Critical values for a two-tailed test of size α were the 100*(α/2)th and 100*(1–α/2)th percentile values of this distribution (
39,
40)
RESULTS
Generic Brain Activation Mapping
For the comparison group, median FPQ was tested against the null hypothesis at 22,927 voxels, with the probability of type I error for each test at α=0.0002. For a test of this size, we expect no more than five false positive voxels over the search volume under the null hypothesis. In total, 1,034 voxels were activated. For the schizophrenic group, median FPQ was tested against the null hypothesis at 21,976 voxels, with the probability of type I error for each test also at α=0.0002. For a test of this size, we expect no more than five false positive voxels over the search volume under the null hypothesis. In total, 253 voxels were activated.
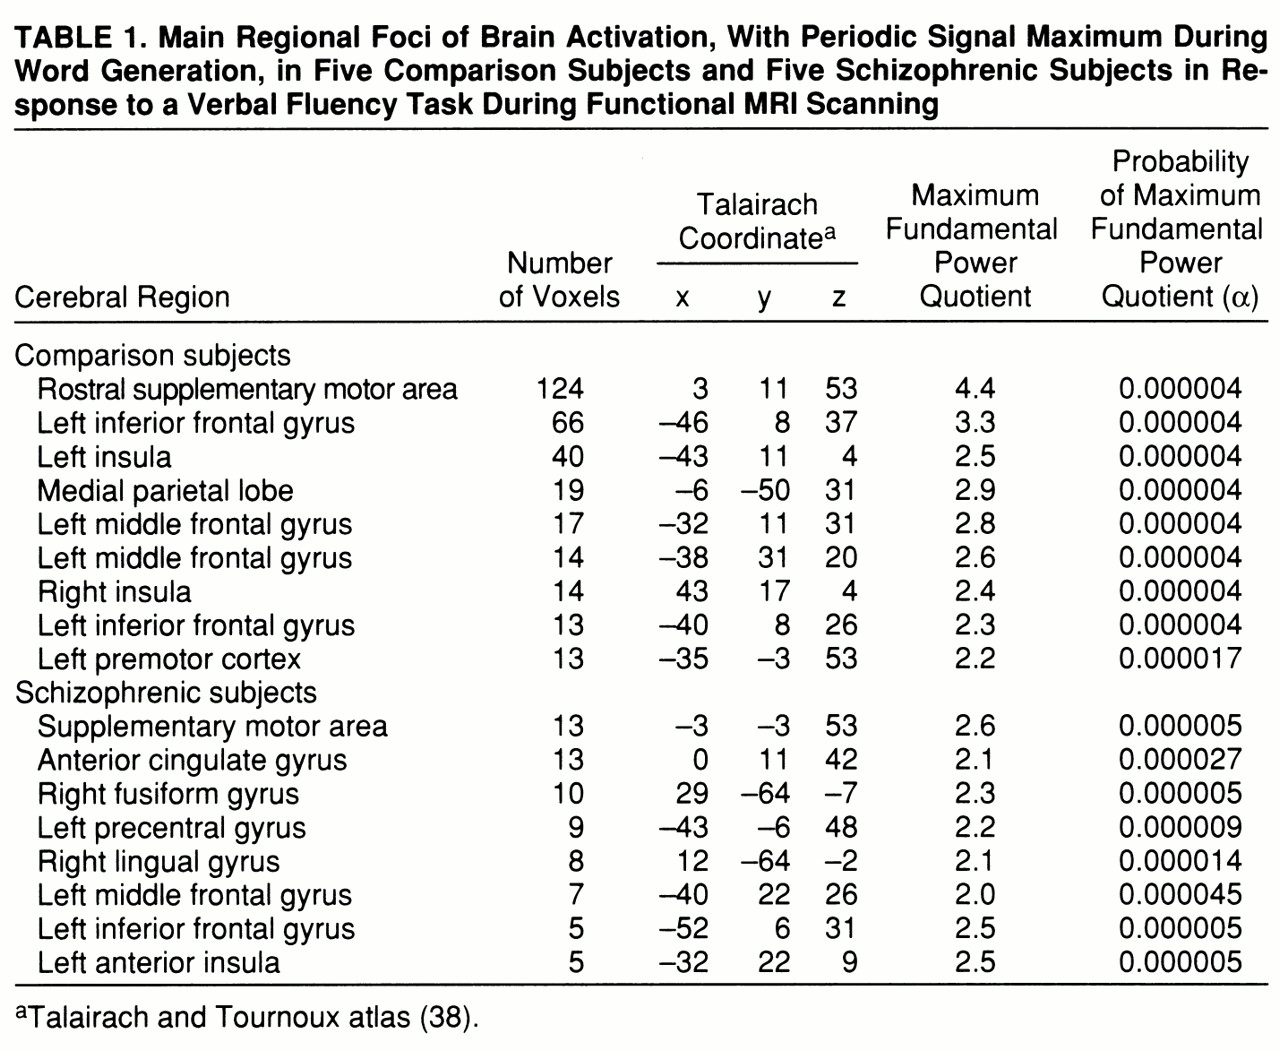
Both groups demonstrated significant power of periodic response, with maximum signal intensity during word
generation in the supplementary motor area, the left inferior frontal gyrus, the middle frontal gyrus, and the left insula. The comparison group also showed responses in the right insula and left premotor cortex, while the schizophrenic group showed additional responses in the left precentral gyrus and right fusiform and lingual gyri (
table 1 and
figure 1, row A).
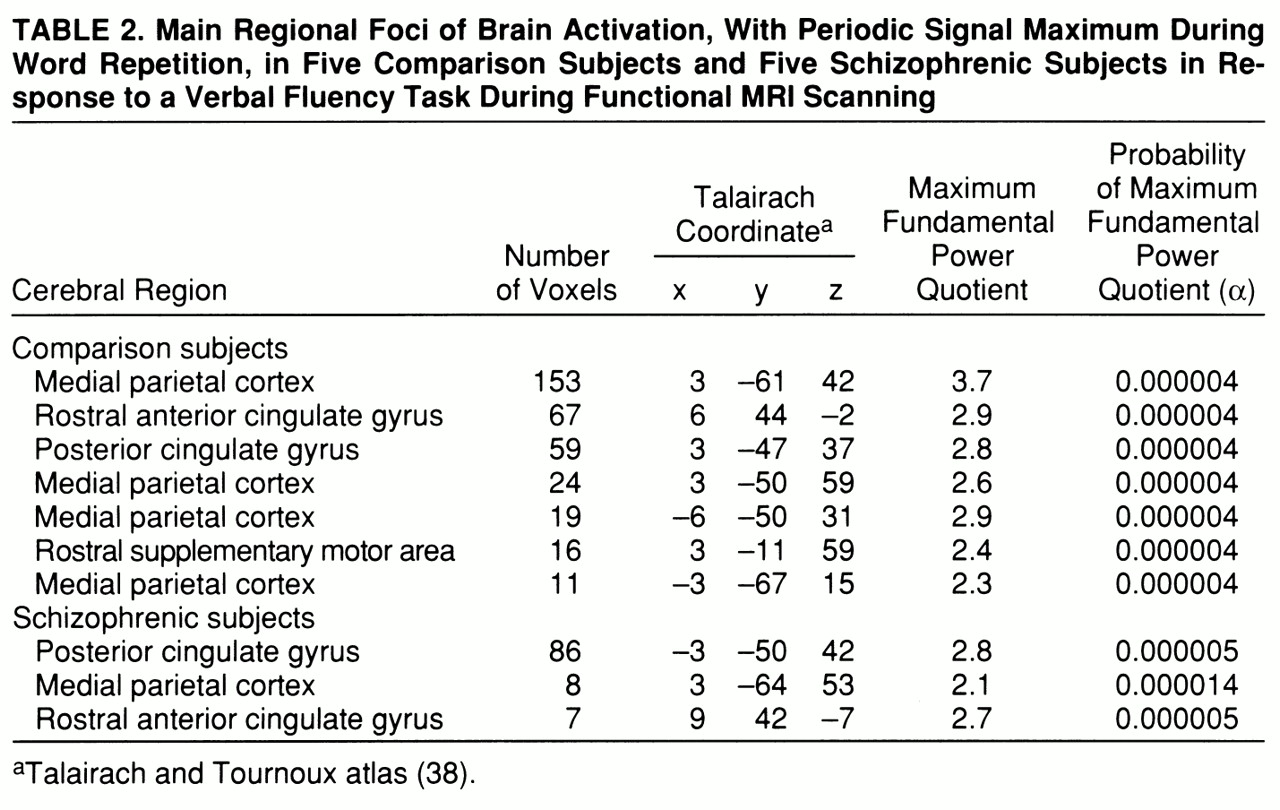
Both groups demonstrated significant power of periodic response with maximum signal intensity during word
repetition in the medial parietal cortex and rostral portions of the anterior cingulate gyrus. The comparison group showed additional responses in the caudal supplementary motor area (
table 2 and
figure 1, row B).
Between-Group Differences in Power of Periodic Response
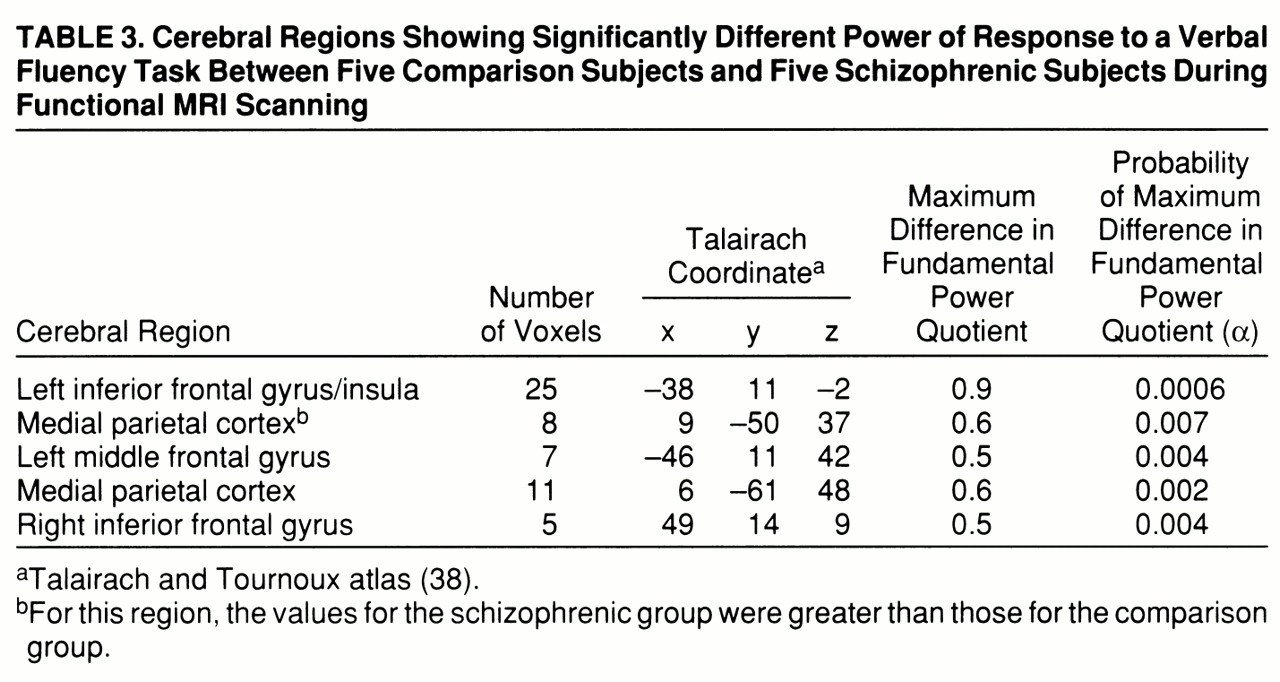
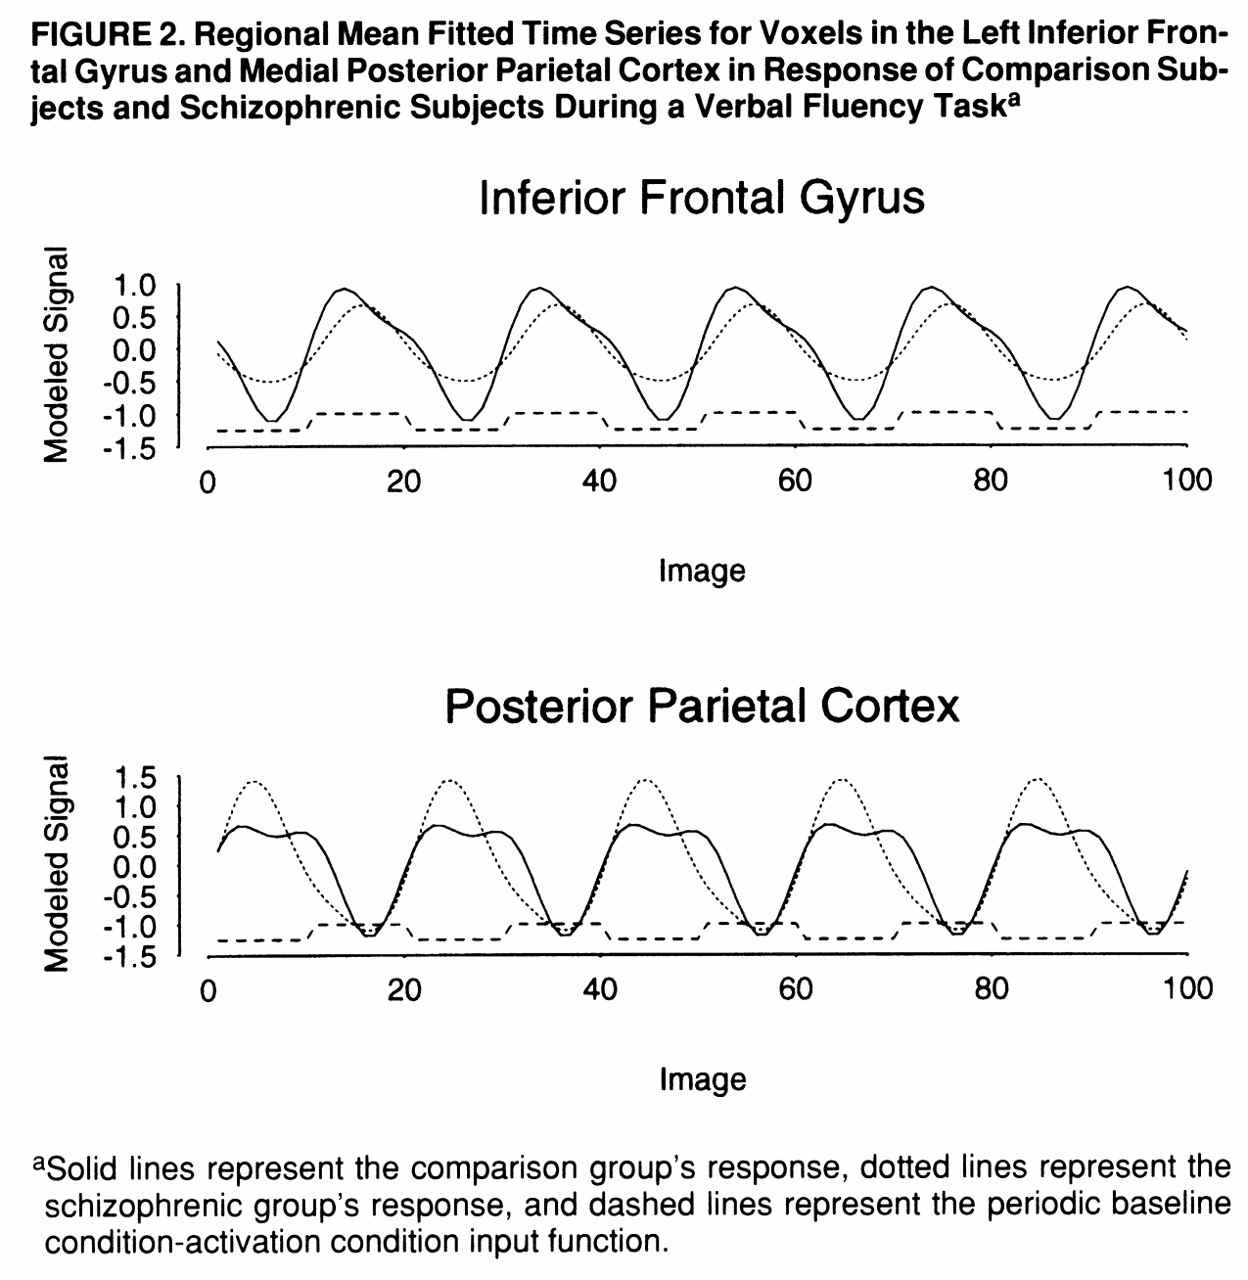
A qualitative comparison of the power of response in the two groups would suggest that the comparison group demonstrated more extensive activations, especially in the frontal cortex, than the schizophrenic group. However, this does not allow us to measure voxelwise differences in power of response between groups. A more formal test of the null hypothesis of no between-group difference in mean FPQ was provided by an ANCOVA at each voxel (see equation), which controlled for the possible confounding effect of a between-group difference in stimulus-correlated motion. This null hypothesis was tested at the 1,082 voxels that were significantly activated in one or both of the generic brain activation maps, with probability of type I error for each test at α=0.01. For a test of this size, we expect no more than 11 false positive voxels over the search volume under the null hypothesis. In total, 147 voxels demonstrated a significant difference in mean FPQ. Most of these were located in frontal regions (left middle and inferior frontal gyri, left insula, and right inferior frontal gyrus) and demonstrated significantly greater power of response in the comparison subjects than in the schizophrenic subjects (
table 3 and
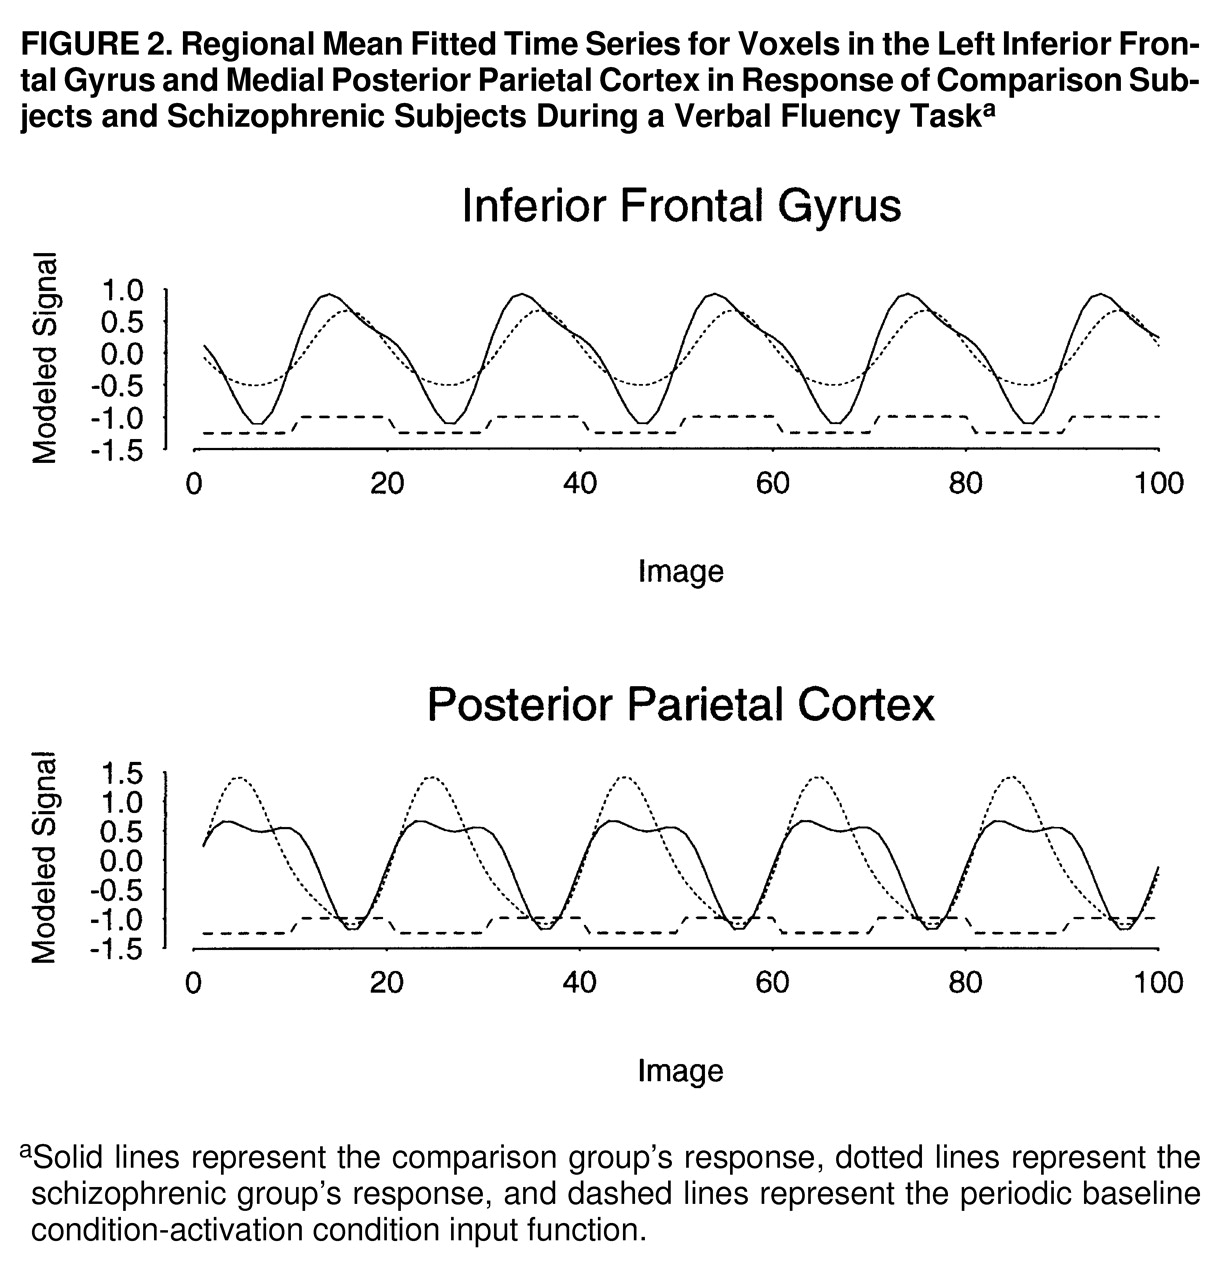
figure 1, row C). These regions were characterized by maximum signal intensity during word generation in both groups. Another cluster of voxels, located in the medial posterior parietal cortex, demonstrated significantly greater power of response in the schizophrenic subjects than in the comparison subjects and was characterized by maximum signal intensity during word repetition in both groups. The schizophrenic group therefore showed an alteration of the power of regional response (relative “hypofrontality” and “hyperparietality”) without showing the differences in phase of response that would suggest differences in functional connectivity between frontal and parietal cortexes (
figure 2).
DISCUSSION
This study examined the functional neuroanatomy of verbal fluency in a group of patients with long-standing and stable schizophrenia who were compared with a group matched for age, handedness, IQ, and ability to perform the FAS test of verbal fluency. To the best of our knowledge, this is the first functional MRI study of verbal fluency in schizophrenia to explore the temporal characteristics of cortical responses to a periodic design and to use linear modeling techniques to assess between-group differences at the single-voxel level.
Although there are many methodological differences (in task presentation, image acquisition, and data analysis) between PET and functional MRI (
41), this study was designed to closely resemble previous PET work. An overt articulation design, as used in PET, would have allowed for on-line monitoring, but the likely consequent increase in movement during articulation would have increased the risk of a confounding effect on functional MRI time series analysis, particularly since psychiatric patients may not always move in the same way or to the same extent as comparison subjects. In particular, there may be systematic differences between patient and comparison groups in movements that coincide with the experimental stimulus, such as (overtly or covertly) vocalizing a response. We were able to reduce the impact of such stimulus-correlated motion—which would otherwise have exaggerated the between-group difference in frontal response—by use of ANCOVA (
40).
The results enabled us to address our two original hypotheses. We are unable to confirm or refute previous PET findings of exaggerated temporal lobe activation in schizophrenia, since our subjects showed little evidence of either temporal lobe activations or altered phase of response. The left temporal lobe is known to be activated by tasks that entail analysis of external speech (
42–
44), as well as during verbal self-monitoring and auditory verbal imagery (
45), and so may be involved in the internal perception of speech. However, neuronal activity in the temporal cortex is reduced in both humans and primates when the subjects vocalize (
17,
27). This suppression of temporal activity during overt speech is thought to be effected by inputs from the frontal areas that generate speech and so may serve to inform regions concerned with speech perception that the acoustic signals are of self-origin (
46). A possible explanation for the lack of this temporal suppression in our experiment is the requirement for a covert articulatory response, so that subjects are not required to process the sound of their own overt speech.
We did find evidence of an attenuated frontal response in the schizophrenic group, although unlike previous studies using the Wisconsin Card Sorting Test (
12), this was not limited to the dorsolateral portion of the prefrontal cortex. Debate about the role of frontal lobe blood flow dates back to the first functional neuroimaging study of patients with schizophrenia (
47). Since then a large number of studies have investigated this finding with the use of differing experimental conditions and methods and have broadly found that hypofrontality is most consistently seen in response to “executive” tasks, which patients tend to perform poorly (for a review, see reference 48). Frith (
49) has suggested that such hypofrontality may be explained by this poor performance alone, but nonpsychotic elderly volunteers, who also show impaired performance on the Wisconsin Card Sorting Test, have been shown to have frontal regional CBF changes of the same magnitude as control subjects (
50). In the present study, since there was no on-line monitoring of task performance, we cannot directly exclude the possibility that between-group differences in response were affected by differences in task performance. However, subjects' ability to perform the task before scanning did not differ significantly between groups, nor did comparison subjects and schizophrenic subjects report the use of different strategies to execute the task.
Another potential confounding factor is that all patients (and no comparison subjects) were taking antipsychotic medication, which could be responsible for a global attenuation of CBF. However, the atypical antipsychotics (which our patients were receiving) appear to have a minimal effect on frontal blood flow (
51), and there was an exaggerated medial parietal response during the word repetition task in the patient group.
The schizophrenic patients and the comparison subjects displayed similar reciprocal phase relationships between activity in the prefrontal and medial parietal cortexes. These regions are anatomically interconnected (
52,
53), and the medial parietal cortex has been implicated in visuospatial processing, memory-related imagery, and attention (
54–
56). Animal studies of working memory have implicated a cortical circuit involving the dorsolateral prefrontal cortex and parietal, temporal, and thalamic regions in working memory, and it is possible that disruption of this circuit could give rise to the executive function failures that are seen in schizophrenia (
57,
58). Tasks involving the generation of inner speech have been associated with medial parietal “deactivation” (
59,
60), implying a reduction of neural activity in regions specialized for functions that are of little relevance to linguistic task performance.
In summary, while this study did not demonstrate evidence of altered frontotemporal relationships in schizophrenia, it provided new evidence of attenuated frontal activation during performance of a verbal fluency task.
