Between-Group Analyses
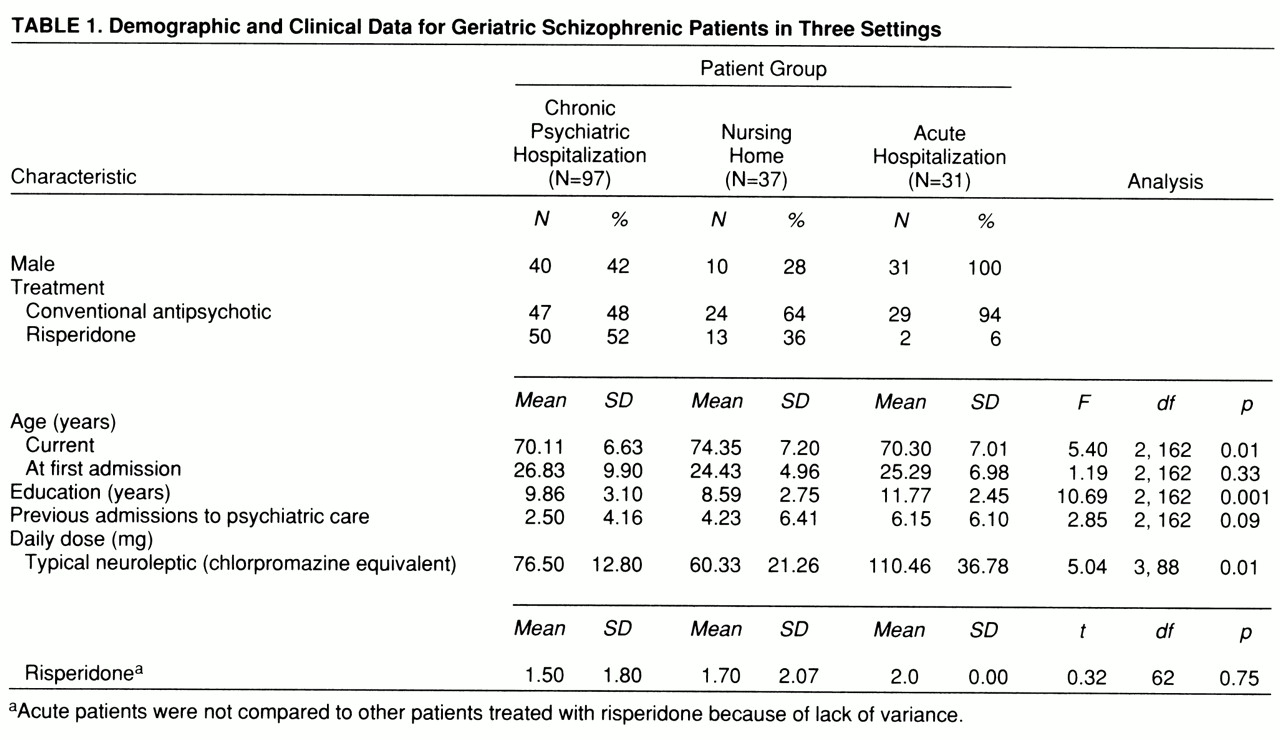
Demographic differences. Demographic characteristics of the patients are presented in
table 1. ANOVAs revealed significant differences in age and education among the three groups. According to Scheffé post hoc follow-up tests, the nursing home patients were older than the other two groups, and the acutely admitted patients were better educated. There were no significant differences in age at first psychiatric admission across the three groups. We found significant differences in conventional neuroleptic, but not risperidone, dose; the acutely admitted patients were receiving significantly higher dosages of conventional antipsychotic medication than the other two groups were.
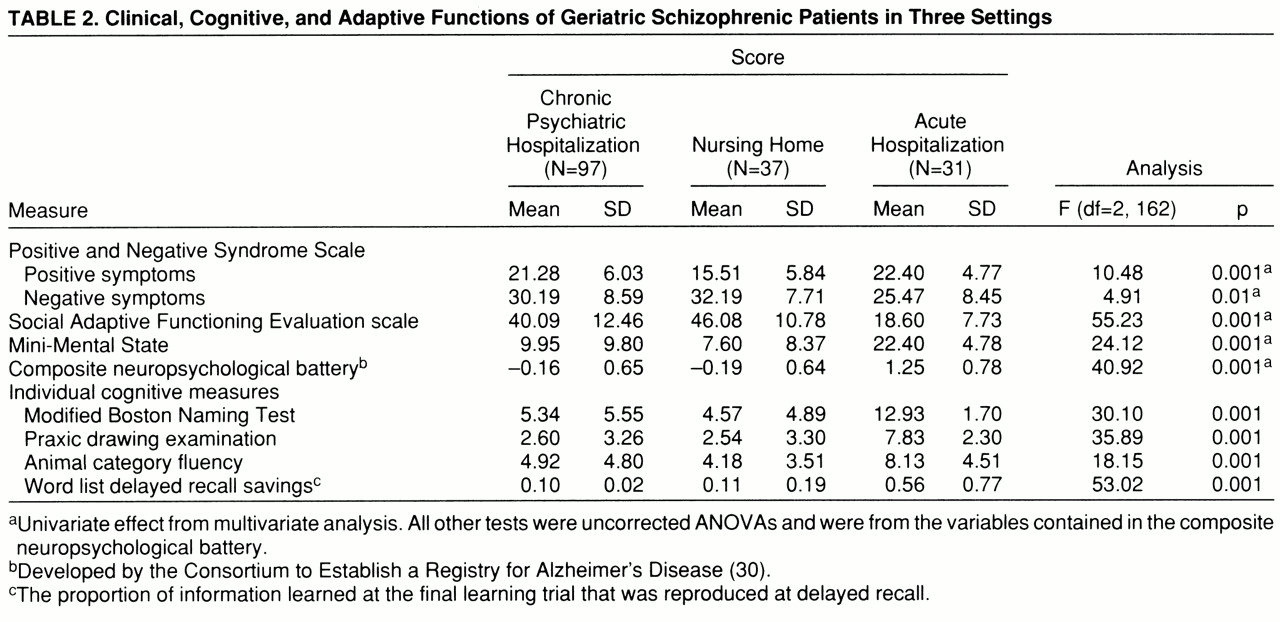
Cognitive, clinical, and adaptive symptoms. Scores on all of the cognitive, clinical, and adaptive functioning measures are presented in
table 2. In previous studies (
34,
35), the measures in the cognitive battery, other than the total scores on the Mini-Mental State, were standardized within the groups of schizophrenic patients and averaged into a single composite z score because of the high correlation between the different measures. In this study, we examined the pattern of intercorrelation between the cognitive measures in order to determine if standardization would be required. The lowest correlation between any two of the cognitive measures in any of the groups occurred between delayed-recall scores and Boston naming scores among the acutely ill patients: r=0.48, df=30, p<0.05. This correlation again suggests considerable overlap between the measures. During the standardization, we weighted the data from the inpatient group to reflect an N of 35 so that the different groups would contribute similarly to standardization. We used this single composite as a dependent measure.
The overall MANOVA was statistically significant (Wilks's lambda=0.35, Rao's R=21.75, df=10,316, p<0.001). The multivariate-corrected one-way ANOVAs revealed significant differences among groups for all five of the domains of functioning. According to post hoc Scheffé tests, the acutely ill and the chronically hospitalized patients had significantly higher severity scores than the nursing home patients on the positive symptom subscale of the Positive and Negative Syndrome Scale; furthermore, there were no differences between the severity scores of the acute and the chronic groups. For the other four variables, the pattern of between-groups differences was identical: in comparison with the acutely ill patients, nursing home and chronically hospitalized patients had significantly more severe negative symptoms, significantly lower scores on the Mini-Mental State, significantly greater adaptive impairment, and significantly more cognitive deficit on the composite neuropsychological measure.
Since the groups differed in age and educational status, we computed correlations between the five domains of functioning and these two demographic variables. For both age and level of education, we found significant correlations for Mini-Mental State scores, Social Adaptive Functioning Evaluation total scores, the composite cognitive battery, and Positive and Negative Syndrome Scale negative symptoms (all r values >0.30, all p values <0.05). As a result, we repeated the between-group ANOVAs for those four analyses with analysis of covariance (ANCOVA); age and education were the covariates. For all four variables, the covariate effect was significant, all F values >8.21, df=2,163, all p values >0.005. Only one of the four analyses was affected by the ANCOVA, with the between-groups differences in negative symptoms (Positive and Negative Syndrome Scale) reduced to a nonsignificant result (F=1.21, df=2,163, p=0.30).
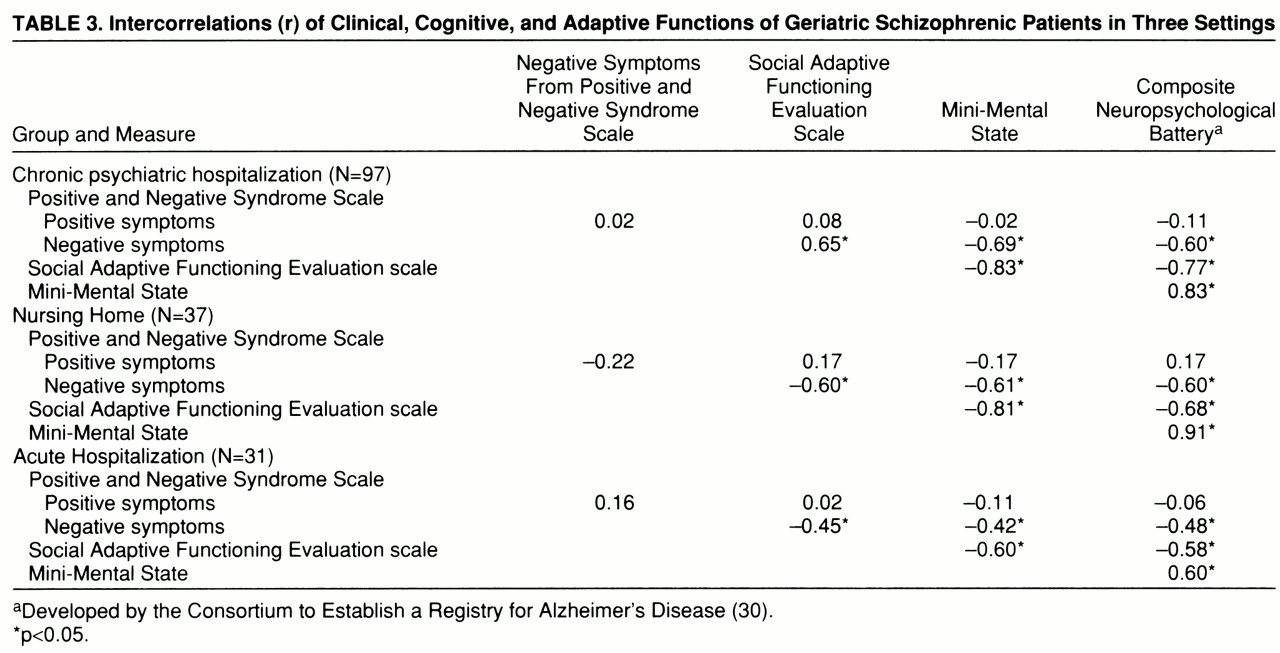
Correlational analyses. Correlations among the five cognitive, clinical, and functional dependent variables within each of the three subject groups are presented in
table 3. The pattern of correlations was similar in each group: positive symptom severity was much less strongly related to all of the other four variables, which were all strongly intercorrelated. In each of the three groups, we used a regression analysis to predict adaptive impairments as measured by the Social Adaptive Functioning Evaluation scale; we entered simultaneously as predictors three of the four other variables—positive and negative symptoms (Positive and Negative Syndrome Scale) and the composite score for the cognitive battery. We did not enter the Mini-Mental State scores because of their high level of correlation and conceptual overlap with the composite score on the cognitive battery. For the chronic patients, the overall regression was significant, R
2=0.70, F=75.59, df=3,93, p<0.001. We then repeated the analysis with a stepwise procedure to determine order of entry. All three variables entered the equation: the composite cognitive score accounted for 62% of the variance (F=153.94, df=1,95); negative symptoms accounted for an incremental 6% of the variance (F=23.03, df=2,94); and positive symptoms accounted for 2% of the variance (F=5.02, df=3,93). For the acute patients, the overall simultaneous regression was also significant (R
2=0.22, F=4.01, df=3,27, p<0.05). When we repeated this analysis with stepwise entry, the only variable that entered the analysis was the composite cognitive functioning score (R
2=0.21, F=7.01, df=1,29, p<0.02). Finally, in the regression analysis for the nursing home patients, the overall simultaneous entry analysis was also significant (R
2=0.56, F=13.80, df=3,33, p<0.001). Two variables entered the equation in the stepwise analysis at p<0.05: cognitive functioning composite scores, accounting for 50% of the variance (F=34.74, df=1,35), and negative symptoms, accounting for 4% of the variance (F=3.76, df=2,34).
Between-Group Discrimination
As in the regression analyses, we did not enter the Mini-Mental State scores as a predictor because of their high overlap with the composite score from the cognitive battery. As we had also done in the regression analyses, we entered all variables simultaneously into the discriminant equation, which was then repeated with a stepwise procedure. In the first discriminant analysis, we compared the chronically hospitalized patients to the acutely admitted patients. The overall discriminant analysis was significant (F=38.69, df=4,124, p<0.001). Three variables entered the stepwise equation: total scores on the Social Adaptive Functioning Evaluation scale (F=81.37, df=1,127), followed by negative symptoms (F=28.71, df=2,126), followed by the cognitive composite score (F=9.82, df=3,126). Overall classification accuracy was 93%, with 96% of the chronic and 83% of the acute patients accurately classified. The second discriminant analysis compared the chronically hospitalized patients and the nursing home patients, also revealing a significant overall effect (F=9.45, df=4,130, p<0.001). Two variables entered the stepwise equation: positive symptoms (F=21.62, df=1,131) and the cognitive composite score (F=12.46, df=2,132). Correct classification was 79% overall, with 94% of the chronic patients correctly classified (21% improvement on chance) and 41% of the nursing home patients correctly classified (13% improvement on chance). Finally, when we compared nursing home patients and acute patients, the overall analysis was significant (F=43.01, df=4,64, p<0.001). Total scores on the Social Adaptive Functioning Evaluation scale were the only significant (F=58.19, df=1,67, p<0.001) predictor in the stepwise analysis, with correct classification accuracy at 95% overall. This accuracy was based on 100% classification accuracy in the nursing home group and 92% accuracy for the acute patients.


