Sociodemographic Characteristics
The mean age of the 150 subjects was 39.8 years (SD=8.2); their mean education level was 10.8 years (SD=2.4). Seventeen patients (11%) had completed grades 1–8, 76 (51%) had completed grades 9–11, 46 (31%) had finished high school, and 11 (7%) had 1–3 three years of college. Most of the patients were African American (N=117 [78%]); 30 (20%) were Caucasian, and three (2%) were Hispanic. There were more men (N=86 [57%]) than women (N=64 [43%]). Most of the patients were right-handed (N=138 [92%]).
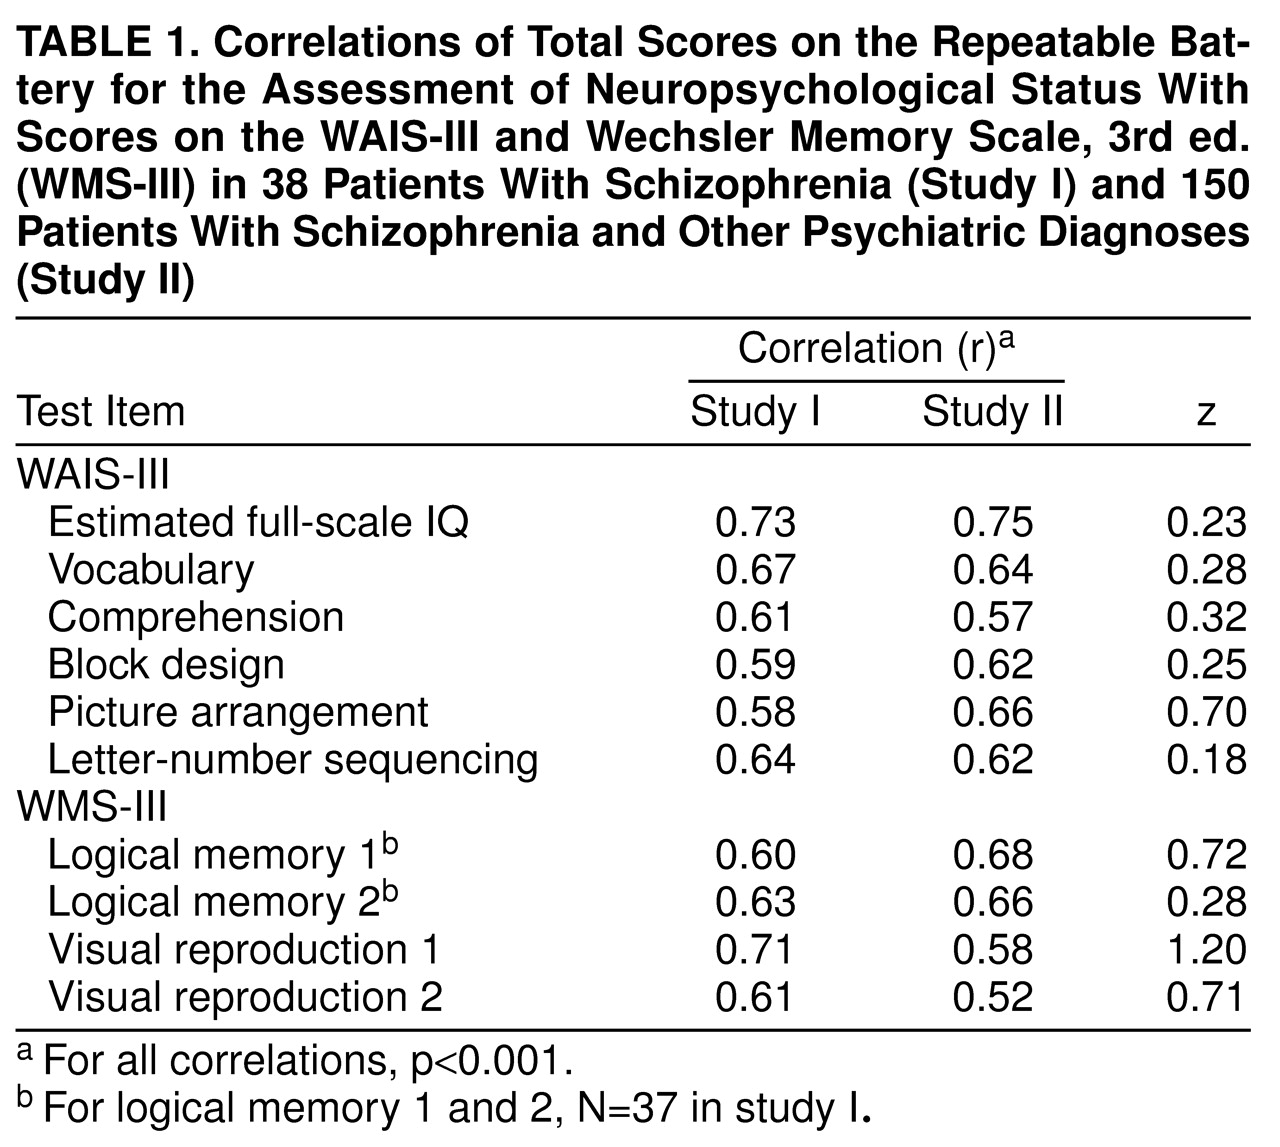
The mean RBANS total and index scores for all 150 patients were as follows: total=66.02 (SD=14.04), immediate memory index=72.34 (SD=17.12), visuospatial/constructional index=68.35 (SD=12.96), language index=79.44 (SD=15.60), attention index=70.85 (SD=17.47), and delayed memory index=69.25 (SD=19.62). Cronbach’s alpha for the total and five index scores was 0.88, suggesting a high degree of internal consistency. The RBANS total score and the five index scores were correlated with patients’ age and education level. No significant correlations where observed between the RBANS scores and age (r values ranging from –0.002 to –0.09, df=148, all p values >0.1). Education was significantly correlated with the total score (r=0.38) and with four of the five index scores (r values ranging from 0.23 to 0.42, df=148, p values <0.005). The correlation with the visuospatial/constructional index did not reach significance (r=0.12, df=148, p>0.05). Thus, there is a modest but significant effect of education on test performance, consistent with data presented in the RBANS manual.
The Relationship of the RBANS to Other Neuropsychological Measures
These results suggest that the RBANS total score may be a useful measure of general cognitive competence. To evaluate this in relation to the total neuropsychological battery, we created a composite z score to represent overall performance on the neuropsychological battery. This global score was the mean z score observed across 22 dependent measures, including scores on the four WMS-III scales and five WAIS-III scales; Stroop word, color, and color-word scales; Trail Making A and B; Halstead-Reitan Finger Tapping (average of dominant and nondominant hands); Purdue Pegboard (average of dominant, nondominant and tandem conditions); Gordon Continuous Performance Test vigilance and distractibility (total correct detections minus false alarms); Wisconsin Card Sorting Test (categories achieved and percent of perseverative errors); WRAT 3 reading; and Woodcock-Johnson listening comprehension. This global z score was highly correlated with the RBANS total score (r=0.79, df=148, p<0.001), suggesting that there is a high degree of overlap between what is assessed by the RBANS and the broader battery.
Although this composite score correlates highly with the RBANS total score, there was a wide range in the Pearson correlations between the RBANS total score and the individual measures from the neuropsychological battery. Correlations ranging from 0.60 to 0.75 were found on the Woodcock-Johnson listening comprehension, Stroop interference condition, and Trail Making B; from 0.40 to 0.59 on the WRAT 3, Wisconsin Card Sorting Test categories, Stroop color naming and word reading, Trail Making A, and the Purdue Pegboard; and from 0.20 to 0.39 on the Wisconsin Card Sorting Test percent of perseverative errors, Halstead-Reitan Finger Tapping, and the Gordon Continuous Performance Test vigilance and distractibility.
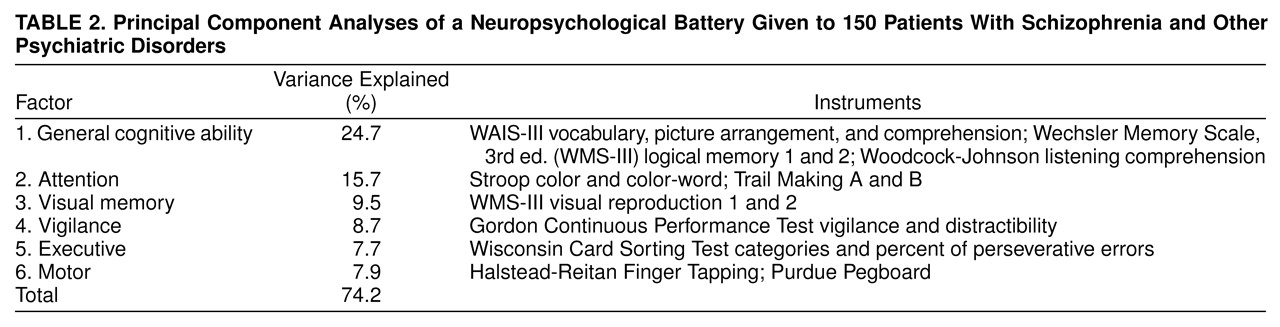
These univariate correlations between the RBANS and the neuropsychological battery do not directly address the question of how many different cognitive abilities were assessed by the larger neuropsychological battery. Therefore, we performed principal component analyses of the neuropsychological battery to determine how many discrete constructs were being assessed by the 22 scores. We first performed an exploratory analysis and found that six factors had eigenvalues greater than 0.70, the cutoff recommended by Jolliffe
(22) for defining a factor. The data were then reanalyzed with a varimax rotation. These six factors accounted for 74% of the total variance in the battery. Tests that have factor loadings greater than 0.60 are shown in
table 2, along with the amount of total variance explained by each factor.
The first factor appears to mark a general cognitive ability factor; it is composed of intelligence, language, and memory measures and accounts for the largest amount of variance. Although five of the six tests with loadings greater than 0.60 involve verbal functions, five other tests had factor loadings greater than 0.40, including the following mix of visual, verbal, attention, and working memory measures: WAIS-III block design and letter-number sequencing, Stroop color and word, WRAT 3 reading, and WMS-III visual reproduction 2.
Factors two through six appear to be more discrete: factor two is composed of attention measures that involve performance speed; factor three is a visual memory factor; factor four is a vigilance factor; factor five is an executive factor; and factor six is a motor factor.
In broad terms, the principal component results are consistent with how the tests are interpreted clinically with one possible exception. A clear memory factor, including both auditory and visual measures, did not emerge from the analysis. Instead, auditory memory loaded highly on the general ability factor, and visual reproduction defined a discrete factor.
We correlated these factor scores with the RBANS total score and found that the test covaried maximally with the general ability factor (r=0.57, df=144, p<0.0001), the attentional factor (r=0.44, df=144, p<0.0001), and the visual memory factor (r=0.36, df=144, p<0.0001). The RBANS correlations with the other three factors were relatively modest: motor (r=0.17, df=144, p<0.05), vigilance (r=0.12, df=144, p=0.15), and executive (r=0.12, df=144, p=0.16).
We also examined the correlations between the RBANS index scores and the six factors. All five index scores correlated significantly with the general ability factor (r values ranging from 0.23 [visuospatial/constructional index] to 0.52 [immediate memory index]), the attention factor (r values ranging from 0.31 [visuospatial/constructional index] to 0.41 [attention index]), and the visual memory factor (r values ranging from 0.22 [attention index] to 0.36 [language index]). No r values greater than 0.20 were observed between the five RBANS index scores and the vigilance, motor, or executive factors.
Diagnostic Group Comparisons
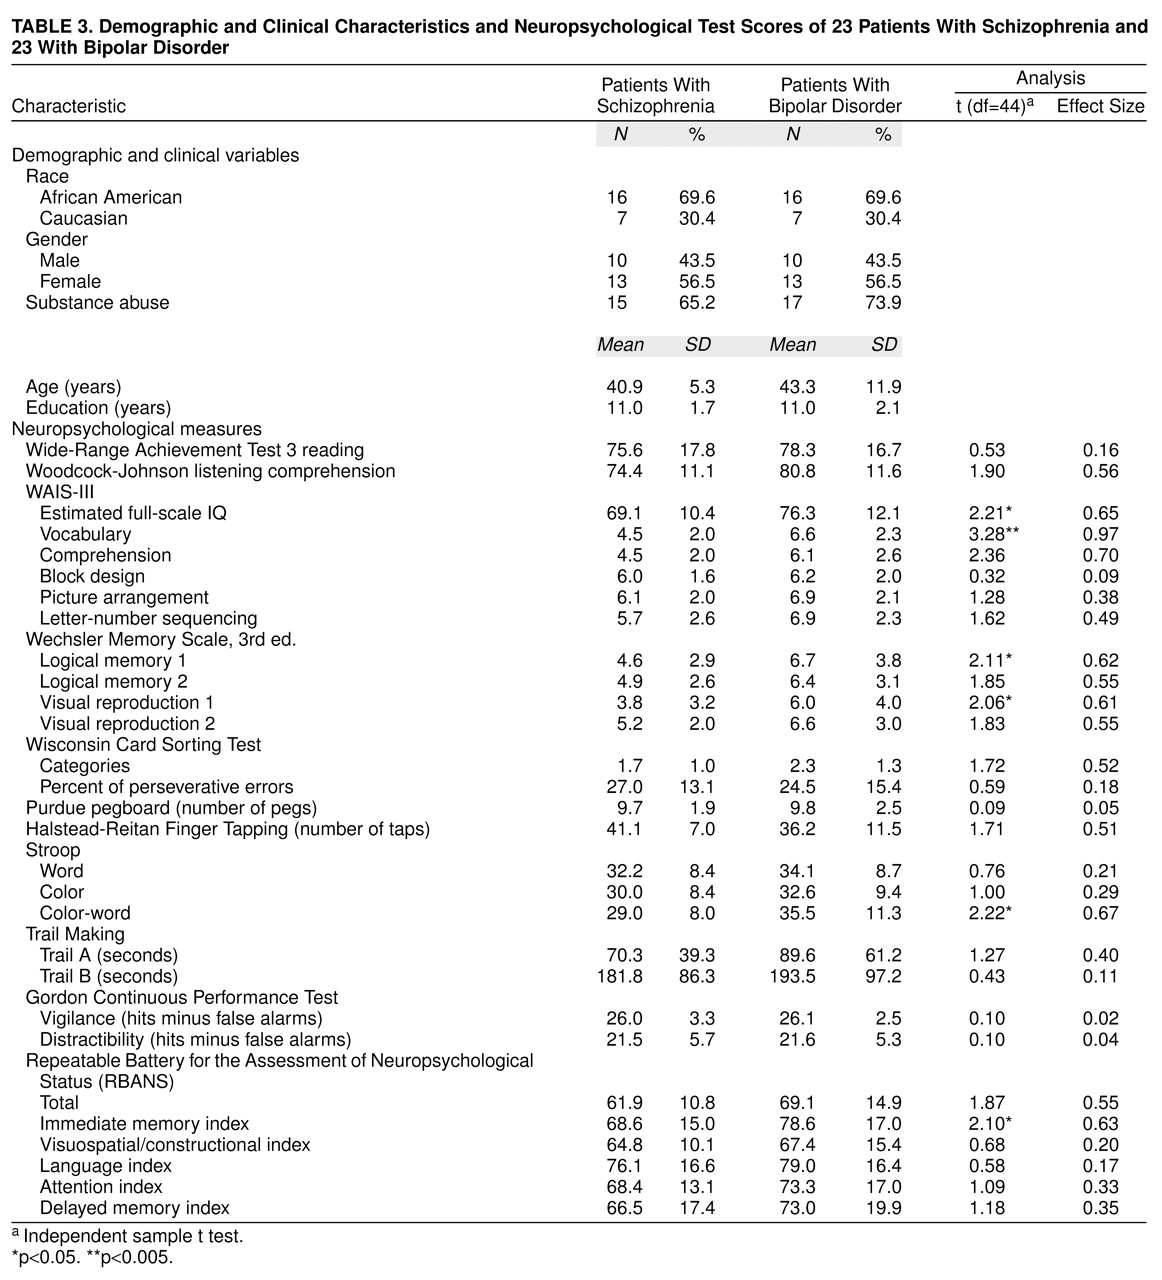
To control for the impact of demographic differences and substance abuse on cognitive performance, patients with schizophrenia and those with bipolar disorder were matched on the following characteristics: age plus or minus 3 years, sex, education, ethnicity, and presence or absence of substance abuse. From the original groups of 59 schizophrenia patients and 28 bipolar disorder patients, 23 matched pairs were obtained. The neuropsychological and RBANS results from the 23 matched patients along with t test results and effect sizes of the observed differences are shown in
table 3. Effect sizes were calculated as the mean score of the bipolar disorder patients minus the mean score of the schizophrenia patients, divided by the mean standard deviation
(23).
Both diagnostic groups demonstrated substantial cognitive limitations compared with normal population values. In part, these deficits may be explained by the limited educational background of the groups combined with the possible negative effects of substantial drug abuse. However, the schizophrenia group performed consistently worse than the bipolar group on the RBANS and other neuropsychological measures with the exception of the Halstead-Reitan Finger Tapping. Thirteen of the 29 comparisons yielded effect sizes greater than 0.50, Cohen’s criterion for a medium effect
(23). An additional eight tests equaled or exceeded an effect size of 0.20, Cohen’s criterion for a small effect
(23). The largest effect sizes were observed on measures of intellectual ability (full-scale IQ), verbal memory (vocabulary), and the categories achieved on the Wisconsin Card Sorting Test, consistent with the report of Goldberg et al.
(6).
To compare the extent of intellectual decline of the two groups, a within-subject discrepancy score was calculated between the WRAT 3 reading scale (a premorbid estimate)
(24) and the subject’s current estimated IQ. The groups differed significantly on the discrepancy score: for schizophrenia patients, mean=9.04 (SD=14.2); for bipolar disorder patients, mean=0.21 (SD=6.3) (t=2.86, df=44, p<0.01). This difference suggests that the schizophrenia group experienced more of an apparent decline in intellectual functioning than the bipolar disorder group. Similar results were observed between the WRAT 3 and the RBANS total score; again, schizophrenia patients demonstrated a greater discrepancy between estimated premorbid level and current level of functioning: for schizophrenia patients, mean=15.7 (SD=16.2); for bipolar disorder patients, mean=7.0 (SD=10.2) (t=2.18, df=44, p<0.05).
It appears unlikely that this pattern of findings can be explained by medication effects. Sixteen (70%) of the 23 schizophrenia patients were taking typical antipsychotics, five (22%) were taking atypical antipsychotics, and two (9%) were taking a combination of both. Thirteen (57%) of the 23 bipolar disorder patients were taking typical antipsychotics, three (13%) were taking atypical antipsychotics, and 17 (74%) were taking either an antidepressant or a mood stabilizer. Further, the fact that the schizophrenia group did not perform worse than the bipolar disorder group on measures of motor performance, tasks that are potentially most sensitive to the negative effects of typical antipsychotics
(25), would also argue against the role of medication effects in explaining the overall group differences
(25).
As seen in
table 3, the effect size of 0.55 for the RBANS total score meets the criterion for a medium effect, and the RBANS immediate memory scale effect size is highly similar to that observed on the logical memory and visual reproduction subtests of the WMS-III. However, the language scale effect size of 0.17 is clearly lower than that observed on several of the other language measures in the larger battery. The RBANS attention scale also yields somewhat smaller effect sizes than several of the attention measures that require performance speed. Thus, the RBANS is somewhat less sensitive than several of the neuropsychological measures to the diagnostic effects present in this study group.