Although typically a disorder of young adulthood, schizophrenia is recognized to sometimes develop for the first time in the elderly. Since old age is associated with an increased prevalence of cerebral disorders, a neurological basis for late-onset schizophrenia has long been suspected (1)—i.e., late-onset schizophrenia may in fact be a secondary mental syndrome. Various methods to demonstrate neurological disease in late-onset schizophrenia have included neurological examination for “soft signs,” neuropsychological assessment, and neuroimaging.
Neuroimaging has been the focus of many published studies on late-onset schizophrenia. Computerized tomographic studies have reported lateral ventricular dilatation, atrophy, and the presence of cerebrovascular disease (2–5). Some magnetic resonance imaging (MRI) studies have suggested an excess of white matter lesions in subjects with late-onset schizophrenia in relation to normal comparison subjects, especially on T2-weighted imaging (6–9), but more recent systematic studies have not been supportive of this (10, 11). Signal hyperintensities on T2-weighted imaging are of particular interest because they may indicate the presence of a subtle neurological disease that may not be obvious on physical examination and yet may underpin the development of schizophrenic illness in some individuals. Previous research in this field has been deficient in that signal hyperintensities have been examined qualitatively or quantified by using visual ratings, and the results of systematic quantitation of these lesions in carefully selected patients have not been published. Furthermore, the possibility that it may not be the number or size but the strategic location of these abnormalities in the brain that may be relevant to their relationship to schizophrenia has not been investigated.
We report the results of the quantitative assessment of signal hyperintensities in a group of subjects with late-onset schizophrenia and compare them with two groups matched for age and gender—an early-onset schizophrenia group and a nonpsychiatric comparison group of community volunteers with no neurological disorder. We hypothesized that subjects with late-onset schizophrenia would have an excess of signal hyperintensities in comparison with subjects with early-onset schizophrenia and normal comparison subjects. These signal hyperintensities were predicted to be present particularly in the frontal white matter and the deep nuclei (striatum and thalamus) regions of the brain that constitute the frontal-subcortical neuronal circuits, which are considered to be important in the pathogenesis of schizophrenic disorder.
METHOD
Subjects
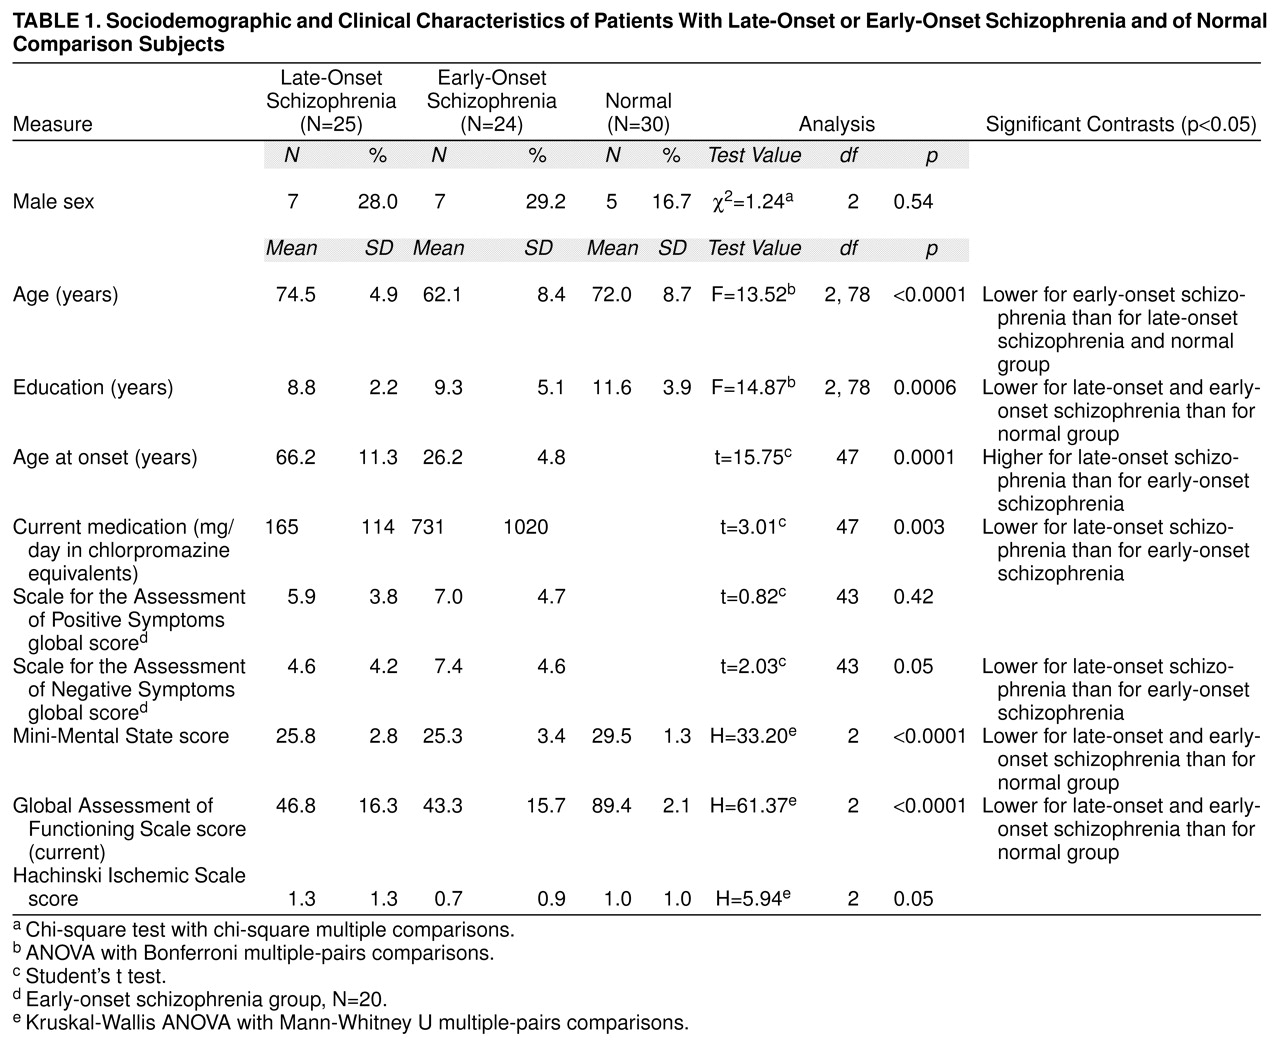
Convenience groups of referred patients with schizophrenia were assessed. The late-onset schizophrenia group consisted of 25 Caucasian subjects with a DSM-III-R diagnosis of schizophrenia and an age at onset of 50 or more years. They were compared with 24 subjects with DSM-III-R-defined schizophrenia and an onset before the age of 30 years (early-onset schizophrenia) and 30 nonpsychiatric unpaid community volunteers matched with the subjects with late-onset schizophrenia. The three groups were matched group-wise on gender, and the late-onset schizophrenia and normal comparison groups were matched on age as well. The onset age of 50 years was used to define late-onset schizophrenia, rather than the 45 years suggested by DSM-III-R, to preferentially include somewhat older subjects in the study and to deal with the difficulty in precisely determining the age at onset in some patients. Despite our efforts to recruit very old subjects with early-onset schizophrenia, this group was younger than the other two. All potential subjects were interviewed separately by two study psychiatrists (P.S. and H.B.), who were required to agree on the DSM-III-R diagnosis and age at onset. For the determination of age at onset, corroboration from an informant was necessary.
The following led to exclusion from the study: 1) a history of DSM-III-R-defined alcohol or drug dependence of 5 or more years’ duration or of any duration if within 5 years of the study; 2) a history or physical evidence of stroke or transient ischemic attack, dementia, epilepsy, Parkinson’s disease, any other central nervous system disorder, head injury with loss of consciousness for more than 30 minutes or with any neurological sequelae, or mental retardation; 3) the presence of tardive dyskinesia of greater than mild severity on the Abnormal Involuntary Movement Scale (AIMS) (12) (to reduce its confounding effects on brain imaging parameters); or 4) current major depression or mania. This study was part of a more comprehensive neuropsychiatric study of late-onset schizophrenia, the clinical findings of which will be reported elsewhere. Twelve subjects (two with late-onset schizophrenia, six with early-onset schizophrenia, and four normal comparison subjects) from the larger study were excluded from this report because MRI scans could not be obtained on these subjects owing to refusal (N=8) or practical constraints (N=4). The excluded subjects were not statistically different from the study subjects on age (mean=67.1 years, SD=9.8) (t=1.22, df=89, p=0.23), gender (10 women) (Fisher’s exact test, p=0.73), and education (9.1 years) (t=0.78, df=89, p=0.44). The study was approved by the ethics committees of the University of New South Wales and the Area Health Services, from which subjects were drawn, and written informed consent was obtained from all subjects after the procedures were explained.
Assessment Procedure
From interviews of subjects and informants and reviews of hospital and medical files, information was systematically gathered on sociodemographic features and illness characteristics. Subjects were rated on the Global Assessment of Functioning Scale (DSM-IV) and the Mini-Mental State examination (13). A full physical assessment was performed, which included a systematic neurological examination for “hard” (14) and “soft” (15) neurological signs, the AIMS (12), the Prince Henry Hospital Akathisia Rating Scale (16), and the Hachinski Ischemic Scale (17). A trained research assistant administered the Scale for the Assessment of Positive Symptoms (18) and the Scale for the Assessment of Negative Symptoms (19).
Brain MRI scans were performed on a 1.5-T superconducting magnet (Signa, General Electric, Milwaukee), with the technician blind to the diagnosis and patient groups running concurrently, with the following protocol: a scout T1-weighted mid-sagittal cut; spatially registered axial proton-density and T2-weighted images, using spin echo (TR=1800 msec, TE=20 and 80 msec), from the base of the brain to the apex, with 5-mm-thick sections and 2.5-mm gaps, parallel to the anterior commissure–posterior commissure line on the basis of the mid-sagittal anatomy reviewed interactively at the time of scanning; relatively T1-weighted 1.5-mm-thick contiguous coronal slices (TE=5, TR=24, number of excitations=2, flip angle of 40°), perpendicular to the anterior commissure–posterior commissure line, using three-dimensional acquisition to give good gray/white contrast and anatomical resolution. A 256×256 pixel matrix was used with a 24-cm field of view.
The following battery of tests (for attention, memory, frontal lobe function, and visuospatial function) was used: 1) the National Adult Reading Test (20); 2) WAIS-R (21) selected subtests: picture completion, block design, similarities, comprehension, and vocabulary; 3) the mazes subtest of the WISC-R (22); 4) Wechsler Memory Scale—Revised (23) selected subtests: mental control, figural memory, logical memory I and II, verbal paired associates, visual reproduction I and II, and digit span; 5) the Wisconsin Card Sorting Test, 64-card version (24); 6) the Controlled Oral Word Association Test (25); and 7) Annett’s Hand Preference Questionnaire (26). The scans and the neuropsychological assessments were performed within 2 months of each other.
The T
2-weighted and proton-density images were used for measurement. All data were transferred to a Sun workstation and analyzed by using the image-processing software ANALYZE (Biomedical Imaging Resource, Mayo Foundation). Using the atlas by Damasio (27) for guidance, a trained operator who was blind to the diagnosis manually delineated the following regions (right and left) on the axial slices: white matter of frontal, temporal, parietal, and occipital lobes (white matter hyperintensities [WMHs]); cerebellum, basal ganglia (caudate, putamen, and globus pallidum), thalamus, brainstem (midbrain, pons, and medulla oblongata). Hyperintensities in each region were identified as those signals that were clearly visualized as of higher signal intensity on both T
2-weighted and proton-density images. Matching T
1-weighted brain slices were also examined. If a hyperintense T
2-weighted lesion had a matching hypointense T
1-weighted lesion that was less than 0.5 cm, it was regarded as a probable Virchow-Robin space and excluded from analysis. If it was greater than 0.5 cm with a matching T
1-weighted lesion, it was regarded as a completed infarction and again excluded from analysis. The boundary of each such signal hyperintensity was delineated manually on each T
2-weighted brain slice to obtain the number of voxels involved, which gave the total volume of the signal hyperintensity (one voxel=1×1×7.5 mm
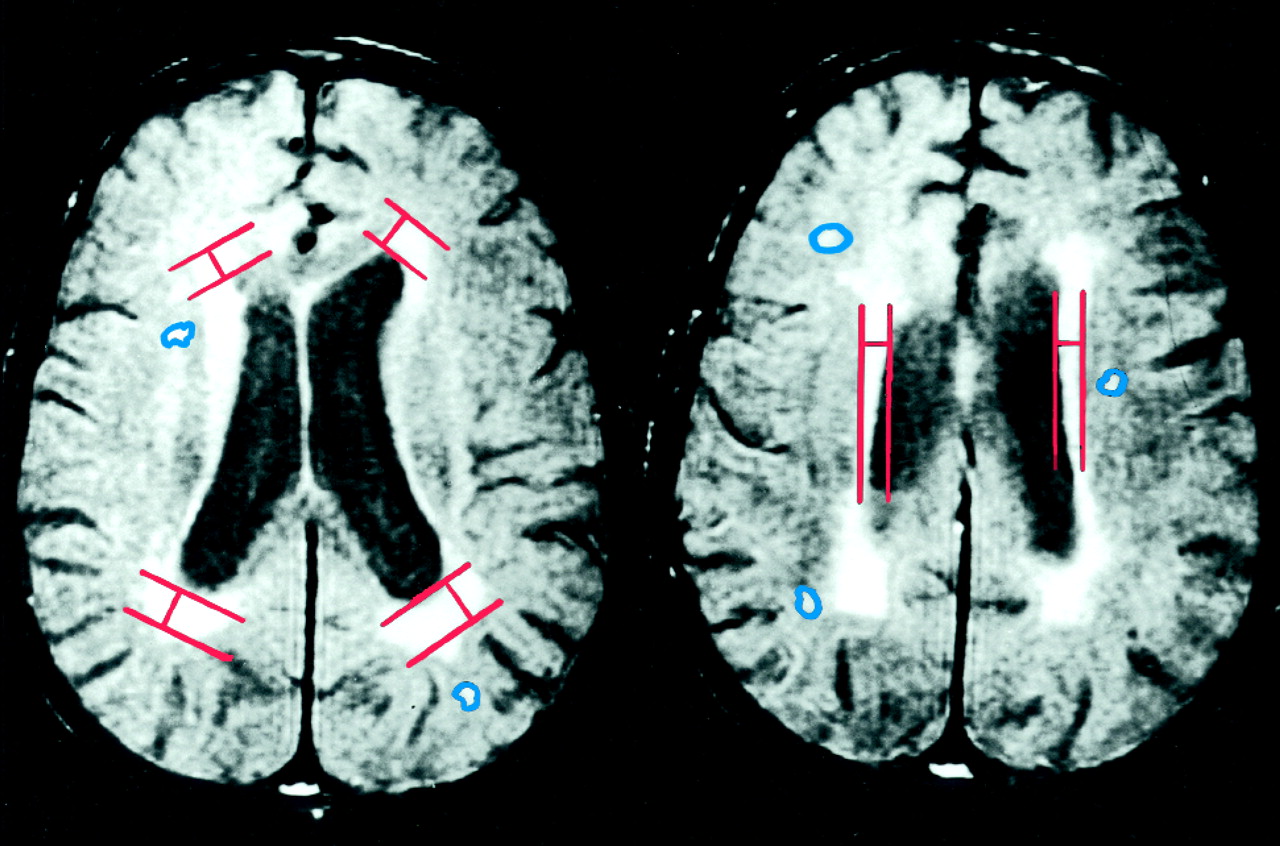
3). The total hyperintense signal volume for each brain region was determined by summing the individual volumes of signal hyperintensities in that region in all the relevant slices. The right and left cerebral, lateral ventricular, and cerebellar hemisphere volumes were also determined by tracing their boundaries on each slice and summing the results. The periventricular hyperintensities (rims and caps) were quantified differently by measuring their greatest thickness on any proton-density slice at the frontal and occipital horns (caps) and the body of the lateral ventricle (rims) on either side. The sum of the rims and caps measures gave the periventricular hyperintensity measure. The boundaries of the periventricular hyperintensities were too indistinct to reliably obtain volumetric measures on them. Proton-density slices rather than T
2-weighted images were used for the periventricular hyperintensity measurements because our pilot investigation showed that the proton-density images offered the best delineation of the boundary between the periventricular parenchyma and the ventricle. The method of delineation of the periventricular hyperintensities is presented in
figure 1. To determine the interrater reliability of the measurements, 10 randomly selected scans were rated independently by two trained raters. The intraclass correlation between the two raters for the overall signal hyperintensities measure was high (r
1=0.76).
Statistical Analyses
All analyses were conducted by using the Statistical Package for the Social Sciences (28). Data violating univariate normality (z tests on skewness and kurtosis, p<0.05) or homogeneity of variance (Levene test, p<0.05) were examined by using Kruskal-Wallis analyses of variance (ANOVAs) followed by Mann-Whitney U tests. Parametric analyses were conducted with ANOVAs and Scheffé contrasts. Bonferroni corrections were applied to all a priori contrasts.
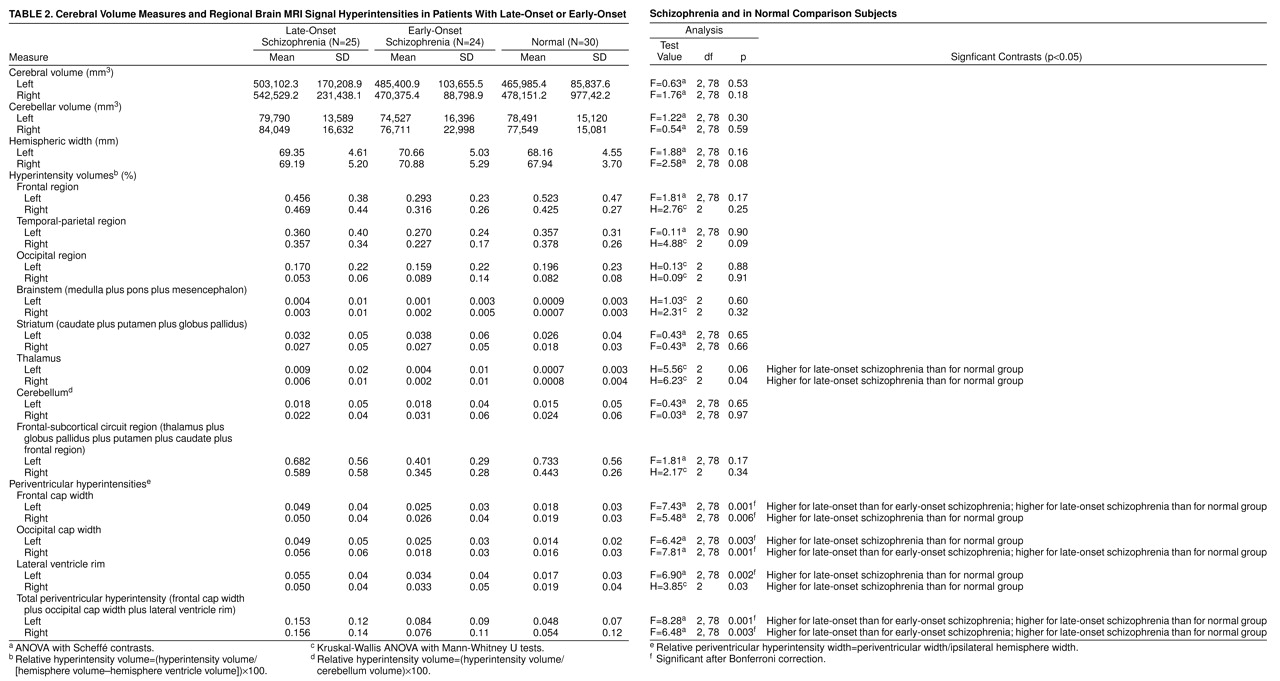
The signal hyperintensity data were normalized for brain size by expressing the signal hyperintensity volumes as a percent of the same-side cerebral hemisphere volume—(hyperintensity volume/[hemisphere volume–ventricle volume])×100—except for cerebellar hyperintensities, which were expressed as a percent of the same-side cerebellar hemisphere volume. The periventricular hyperintensities (rims and caps), which were linear measures, were normalized by expressing them as a percent of the same-side hemispheric width. ANOVAs were performed on the following aggregated variables, each right and left: brainstem (medulla plus pons plus mesencephalon), frontal lobe WMHs, temporal-parietal lobe WMHs, striatum (caudate plus putamen plus globus pallidus), and periventricular (occipital cap plus frontal cap plus lateral ventricle rim) signal hyperintensities. Included in the analysis was a composite variable labeled frontal-subcortical circuit that contained the sum of scores for thalamus, globus pallidus, putamen, caudate, and frontal lobe WMHs for left and right sides. Analyses were performed on both the raw data (actual volumes of signal hyperintensities and widths of periventricular hyperintensities) as well as the normalized data (as proportions of cerebral or cerebellar hemispheric volumes and hemispheric widths, respectively).
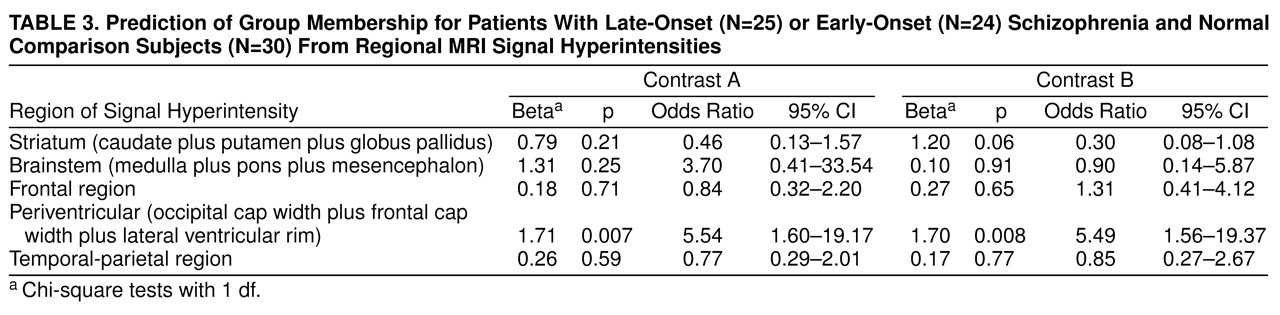
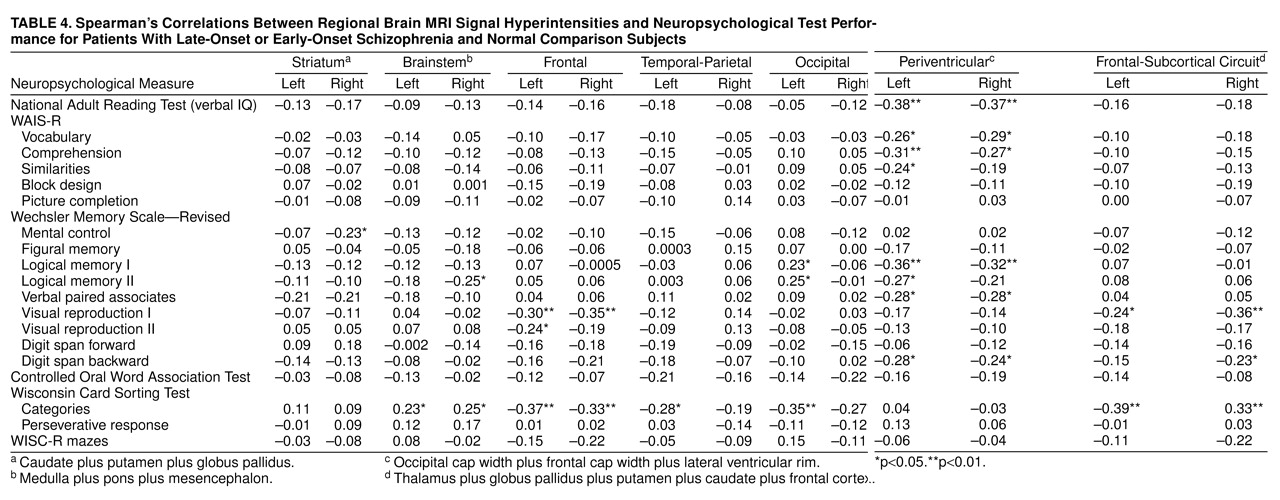
Logistic regression was used to assess the prediction of group membership from signal hyperintensities, allowing for age and education as covariates. For this analysis, left and right side data were summed for each aggregated variable and ranked on a four-level ordinal scale. Age was converted into a three-level ordinal scale representing ranges (<65, 65 to 75, and >75 years). Group membership was examined as two contrasts corresponding to late-onset schizophrenia and early-onset schizophrenia combined compared to the normal comparison group, and the late-onset schizophrenia group compared to the early-onset schizophrenia group. A direct model, with all variables entered simultaneously, was used. Finally, relationships between hyperintensity and neuropsychological test data were examined with nonparametric (Spearman) correlations.
DISCUSSION
Hyperintense signals on T2-weighted imaging are reported to be common in the brains of elderly individuals (29), and we found this to be the case in our schizophrenic and nonschizophrenic groups. In fact, no subject had a complete absence of such signals. Our hypothesis that subjects with late-onset schizophrenia would have an excess of these hyperintensities was partially supported. The excess was in the width of the periventricular rims and caps but not in the discrete hyperintense signals in the white matter, basal ganglia, or brainstem—with the exception of the thalamus. We did not find an excess of such signals in the combined strategic brain regions that we had predicted.
The significance of our finding of increased periventricular hyperintensities in late-onset schizophrenia is somewhat uncertain. Mild periventricular hyperintensities are often not indicative of brain disease because they are seen in healthy individuals with no evidence of neuropsychological impairment (30–32). Extensive and severe periventricular hyperintensities are usually associated with intracerebral pathology, but the finding is nonspecific (29–32). The major mechanism for their development is considered to be trans-ependymal absorption of cerebrospinal fluid, usually associated with normal pressure hydrocephalus, subcortical arteriosclerotic encephalopathy, and perivascular atrophy (32, 33). Our subjects did not have any other features of normal pressure hydrocephalus, and we consider cerebrovascular disease to be the most likely etiology for the lesions. Our subjects with late-onset schizophrenia did not have an increase in the risk factors for stroke that we examined in this study, as indicated by the Hachinski Ischemic Scale score and the rates of obesity and smoking. The early-onset schizophrenia group, in fact, had higher rates of smoking. This does not, however, rule out the possibility that the periventricular hyperintensities seen in the subjects with late-onset schizophrenia were due to cerebrovascular disease because the presence of a high Hachinski Ischemic Scale rating is neither necessary nor sufficient for its presence (34).
Our distinction between periventricular and other white matter hyperintensities has some pathophysiological and neuropathological justification. The deep white matter region, which represents the area of the periventricular hyperintensities, is supplied by the deep perforators of the anterior choroidal and the lenticulostriate branches of the middle cerebral arteries. The centrum semiovale region is supplied by the medullary branches of the superficial middle cerebral artery (35). Since the pathophysiology of signal hyperintensities is incompletely understood, this distinction on the basis of vascular supply should arguably be retained, although it is still not clear why. Neuropathologically, the periventricular hyperintensities have been reported to represent demyelination, gliosis, and spongiosis (36, 37). Other signal hyperintensities have been related to the widening of perivascular spaces, perivascular demyelination, vascular ectasia, and cystic and noncystic infarction (30–32, 36, 37). However, irregularly extending periventricular hyperintensities become confluent with WMHs in the centrum semiovale and corona radiata, and demyelination, spongiosis, and infarction may be a common basis for these (38). These lesions may, therefore, represent a continuum of severity of white matter disease, with the mild changes corresponding with subtle impairment (39).
The correlation between signal hyperintensities and neuropsychological impairment has been investigated in many studies. Whereas consistent results have not emerged, most studies (39–43), but not all (44–46), have demonstrated a relationship between the extent of signal hyperintensities and neuropsychological dysfunction. There is a suggestion that there may be a threshold above which these lesions are associated with impairment (41). In our study, some periventricular hyperintensity ratings were significantly correlated with neuropsychological variables. We conclude from this that the periventricular hyperintensities did indicate functional impairment, but the large number of correlations computed for this analysis makes us cautious. The periventricular hyperintensities were particularly associated with deficits in verbal IQ, memory, and frontal-executive functioning—all of which could play a role in the development of psychiatric symptoms. These deficits nevertheless are nonspecific and do not necessarily support the argument for a causal role.
Two studies of signal hyperintensities in late-onset schizophrenia are worthy of detailed comment. The study by Howard et al. (10) compared 38 subjects with late paraphrenia (a broader category than late-onset schizophrenia that includes delusional disorder) with 31 healthy comparison subjects and found no differences in visually rated signal hyperintensities. A quantitative study of white matter hyperintensities in 16 patients with late-onset schizophrenia by Corey-Bloom et al. (33) also reported no differences between early-onset schizophrenia and normal comparison subjects. While methodologically similar to the second study, our study was larger and had more women subjects, which is typical of late-onset schizophrenia, and we examined the signal hyperintensities quantitatively by their anatomical distribution. These methodological differences may account for different results reported by us than in the previous studies.
The finding of higher signal hyperintensities in the thalami of subjects with late-onset schizophrenia than in normal comparison subjects is noteworthy in light of the reports of thalamic abnormality in schizophrenia. Decreased thalamic size has been consistently reported in the early-onset schizophrenia literature—both from neuroimaging (47, 48) and neuropathological (49) studies. Positron emission tomography studies that imaged thalamic metabolism in schizophrenia have been inconsistent (48). The only such study of late-onset schizophrenia (33), on the other hand, reported increased thalamic volumes. The significance of our finding is therefore difficult to ascertain. Moreover, some of our subjects with late-onset schizophrenia had thalamic signal hyperintensities (N=11 of 25), and they did not differ statistically from the subjects with early-onset schizophrenia, raising some doubts about the significance of this finding.
Since the abnormalities demonstrated in our study are quantitative rather than qualitative, they cannot be considered to be specific to late-onset schizophrenia. It is, however, possible that the pathology becomes significant when present in an individual who is vulnerable to the development of schizophrenia. There is evidence from family studies, the assessment of premorbid personality, and the presence of sensory impairment (50–52) that individuals with late-onset schizophrenia are predisposed to the development of psychosis. Our unpublished observations on the same subjects point to a similar conclusion. The basis of this vulnerability is not understood, but in spite of it, these individuals have usually functioned quite well until a late age. It is perhaps the occurrence of additional brain pathology that finally leads to the manifestation of the illness to which they are predisposed. The excess periventricular hyperintensities seen in our subjects with late-onset schizophrenia may be indicative of that additive brain insult. We therefore argue that late-onset schizophrenia is multiply determined, with acquired brain disease, possibly cerebrovascular in origin, interacting with a predisposing abnormality to result in the manifestation of the illness. Since cerebrovascular disease is at least partially preventable, attention to risk factors should lead to a reduction in the incidence of late-onset schizophrenia. Cerebrovascular disease is also likely to progress in many instances so that the subtle cognitive deficits in late-onset schizophrenia may sometimes be progressive. A testable hypothesis to emerge from this study is that a significantly higher proportion of subjects with late-onset schizophrenia will progress to vascular dementia if followed up over a sufficiently long period.