Sample and Interviewers
Subjects in this study were from Caucasian, female, same-sex twin pairs from the Virginia Twin Registry (
19)—a population-based register formed from a systematic review of birth certificates in the Commonwealth of Virginia. Twins were initially ascertained through mailed surveys to female twin pairs in the registry, the response to which was approximately 64%. The true cooperation rate was higher because such large-scale mailings contain a significant percentage of questionnaires that do not reach the intended recipient. Twins were then interviewed face to face, at which time our refusal rate was approximately 8%. In the current phase of the project, 2,288 members of female-female pairs from the Virginia Twin Registry were eligible, on the basis of prior cooperation with at least one interview, to participate in a structured telephone interview. Of these twins, 1,937 were successfully interviewed in 1995–1997, three had died, 33 were lost to follow-up, one was too medically ill to be interviewed, three had incomplete interviews, 58 neither refused participation nor completed an interview by the end of the study, and 253 refused. Thus, we succeeded in interviewing 84.7% of the entire sample and 86.2% of the eligible sample. Zygosity was determined blindly by standard questions (
20), photographs, and, when necessary, DNA (
19,
21). All interviews were conducted blind to information about the co-twin. The mean age at interview was slightly greater in monozygotic (36.1, SD=8.0) than in dizygotic (35.4, SD=8.6) twins (t=1.89, df=1,931, p=0.06).
This project was approved by the Committee for the Conduct of Human Research at Virginia Commonwealth University. Written informed consent was obtained before face-to-face interviews and verbal assent before phone interviews. Clinically experienced interviewers were initially trained for 40 hours and received regularly scheduled review sessions over the course of the study.
Caffeine use was assessed for the year before interview and for the time of maximum caffeine consumption. For each time period, we assessed the frequency of caffeine consumption. For days in which the twins consumed caffeine, we asked separately for the average daily consumption of cups of caffeinated coffee, cups of caffeinated tea, and servings of caffeinated soda. If they reported drinking coffee, we inquired whether the coffee was usually brewed or instant. Our calculation of caffeine consumption used the following estimates of caffeine content: brewed coffee, 125 mg/cup, instant coffee, 90 mg/cup, tea, 60 mg/cup, and caffeinated soft drinks, 40 mg/can (
2). Caffeine consumption per month was estimated by multiplying the average consumption per day by the average numbers of days per month in which caffeine was consumed. We report last-year rather than maximum lifetime caffeine use because of the higher reliability of the former measure.
Caffeine toxicity was assessed by the item: “During the time when you consumed caffeinated beverages the most, did you ever feel ill or shaky or jittery after drinking caffeinated beverages?” Caffeine tolerance was assessed by the response to the following two questions adapted from the Psychoactive Substance Abuse Section of the Structured Clinical Interview for DSM-III-R—Patient Version (
22): “During the time when you were consuming caffeinated beverages the most, did you find that you needed to drink a lot more to get the desired effect than you did when you first drank them?” and “What about finding out that when you drank the same amount, it had much less effect than before?” A positive response to either question was assumed to reflect tolerance.
All individuals who responded positively to the question, “…did you ever stop or try to cut down on your consumption of caffeinated beverages?” were asked about the four DSM-IV symptoms of caffeine withdrawal: headaches, marked fatigue or drowsiness, marked anxiety or depression, and nausea or vomiting. We defined caffeine withdrawal following DSM-IV criteria as the presence of headache and at least one of the other three additional symptoms.
We defined “heavy use” as daily or near-daily consumption of 625 mg or more of caffeine. The distribution of milligrams of caffeine per month was substantially skewed and was, therefore, log-transformed before analysis.
To test the validity of the equal environment assumption—that monozygotic and dizygotic twins are equally correlated for exposure to relevant environmental risk factors—we assessed twin similarity for three kinds of environments: childhood (how often the twins shared the same room at home and class at school and were dressed alike), adolescence (how often they had the same friends, were in the same social group, and went together to movies and dances), and adulthood (how often, in the last year, they were in contact with one another).
Twin studies provide a method for detecting cooperation bias. If heavy caffeine use both is correlated in twin pairs and predicts noncooperation, then the rates of heavy caffeine use in a twin could be predicted from the interview status (cooperated versus refused) of the co-twin.
Presentation of Results From Twin Studies
We report twin resemblance in three different ways, which we will illustrate for heavy caffeine use. Probandwise concordance is defined as the proportion of co-twins of heavy-consuming proband twins who themselves are heavy users. The odds ratio reflects the increase in risk for heavy caffeine use in co-twins of twins with heavy use relative to that found in co-twins of twins without heavy use. Odds ratios and their 95% confidence intervals were obtained from the logistic regression procedure in SAS (
23). The significance of the difference in odds ratios was determined by the Breslow-Day test (
24). The tetrachoric correlation, or “correlation of liability” (
25,
26), assumes that underlying the observed division of twins into those with and without heavy caffeine use, there exists a latent distribution that reflects their underlying “liability.” We assume a threshold exists on this liability distribution such that individuals with a liability above the threshold develop heavy caffeine use, while those with a liability below the threshold do not. The tetrachoric correlation represents the correlation in twins for this underlying liability. This model further assumes that caffeine use, heavy use, intoxication, tolerance, and dependence have a multifactorial etiology involving a number of genetic and environment risk factors of small to moderate effect (
27).
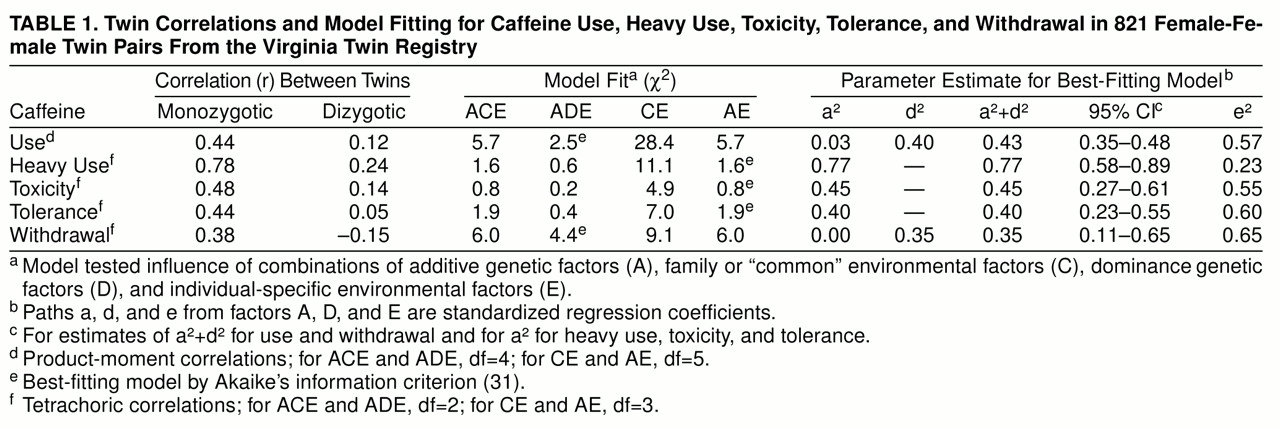
On the basis of this liability-threshold model, we performed biometrical modeling fitting (for further details, see references
28 and
29). We assumed that twin resemblance resulted from three possible sets of latent factors: 1) additive genes (A), which reflect the additive effect of alleles at susceptibility loci and contribute twice as much to the correlation in monozygotic as in dizygotic twins (because monozygotic twins share all their genes identical by descent, while dizygotic twins, like nontwin siblings, share on average half of their genes); 2) dominance genes (D), which reflect the nonadditive interaction between alleles at the same locus and contribute four times as much to the correlation in monozygotic as in dizygotic twins (because, at any given locus, monozygotic twins always share both alleles identical by descent, while dizygotic twins share them both one time in four); and 3) family or “common” environment (C), which contributes equally to the correlation in monozygotic and dizygotic twins. In addition to “common” environment (those environmental factors that make members of a twin pair similar for liability to heavy caffeine use), the model also contains individual-specific environment (E), which, in addition to measurement error, is a measure of the impact of those environmental experiences that make members of a twin pair different for liability to heavy caffeine use.
The formal analysis of our twin data began with fitting an ACE model. This model, and all other models here reported, were fitted directly to contingency tables through use of the program Mx (
30) by weighted least squares. (The exception to this was for caffeine consumption—where models were fitted directly to variance-covariance matrices.) The ACE model includes additive genes (A), common environment (C), and individual-specific environment (E). We then fit three additional models. The ADE model contains dominance genetic variance (D) instead of common environment. This model assumes that all twin resemblance results from genetic factors, some of which are additive in effect and others of which are interactive. Because the estimates of A and D in the ADE model are highly negatively correlated in twin studies (
28), we focus on broadly defined heritability that equals a
2 + d
2. The AE model contains only additive genes (A) and individual-specific environment (E) and assumes that all familial aggregation results from additive genetic effects. The CE model, which contains only common environment (C) and individual-specific environment (E), assumes that all familial aggregation is due to the effects of family or “common” environment. For a familial trait, the presence of genetic risk factors is directly tested by the attempt to reject the CE model, which assumes that all observed familial aggregation is the result of shared environmental influences.
The goal in model fitting is to explain the observed data as well with as few parameters as possible. We operationalize this goal with the use of Akaike’s information criterion (
31,
32), which equals the chi-square value of the model minus twice the degrees of freedom. The model with the lowest value of Akaike’s information criterion reflects the best balance of goodness of fit and parsimony. In addition, the fit of the CE or AE model can be directly compared with that of the ACE model by a chi-square difference test (df=1).
The final step in twin analysis is to estimate, on the basis of the best-fitting model, the proportion of variance in liability to caffeine use or misuse due to individual-specific environment (e2) and, depending upon the results of model fitting, additive gene action (a2), dominance gene action (d2), or common environment (c2). The proportion of variance in liability due to additive or dominance genetic effects or both is often termed “heritability.”


