In an earlier study, we compared the behavioral and emotional problems of 13,697 children from 12 cultures assessed by parents’ reports on the Child Behavior Checklist
(1). At the level of total problem scores and broadband groupings of externalizing and internalizing problems, most cultures yielded mean scores that were fairly close to an “omnicultural composite”
(2) obtained by averaging scores across all cultures. Although there were also significant differences among cultures, these could have been due at least in part to factors such as sampling and socioeconomic status variations.
There were cross-cultural consistencies in the tendencies for total problems and externalizing to decrease with age, for internalizing to increase with age, for boys to score higher on total problems and externalizing, and for girls to score higher on internalizing. There was also cross-cultural consistency in the problems that received high versus low scores.
Our previous findings supported standardized parental ratings as a method for assessing children across diverse cultures. Cross-culturally robust assessment procedures can facilitate research, training, and communication among professionals from different cultures. Such procedures can also aid professionals in assessing the millions of refugee and immigrant children who are creating challenges for many host cultures.
Our earlier findings concerning total problem, externalizing, and internalizing scores facilitated comparisons of children within and between cultures with respect to a global measure of problems and two broad patterns
(1). These measures are useful for identifying children whose problems sufficiently exceed those of their peers to warrant more detailed assessment. In addition to the global problem scores, the Child Behavior Checklist provides more detailed assessment in terms of eight syndromes that have been empirically derived from principal components analyses of parent, teacher, and self-ratings of thousands of clinically referred American children
(3,
4). Confirmatory factor analyses of parent, teacher, and self-ratings of thousands of referred Dutch children have supported the overall syndrome structure
(5,
6).
Bicultural comparisons of syndrome scores have revealed that particular pairs of cultures differ considerably more on certain syndromes than on others
(7,
8). However, bicultural comparisons cannot tell us whether those particular cultures are outliers with respect to certain syndromes, how much variability occurs in each syndrome across multiple cultures, or whether extreme scores on particular syndromes are associated with identifiable cultural differences.
The present study was designed to test variations in scores on eight empirically derived syndromes across 12 cultures in which the same standardized instrument was used to obtain parents’ reports of their children’s behavioral and emotional problems. By comparing all cultures within the same analyses, we could identify those that deviated significantly from an omnicultural mean score on each syndrome. Because age and gender differences might affect syndrome scores across, among, or within cultures, we also tested the main effects and interaction effects of these characteristics in relation to culture and to each other.
METHOD
Assessment
The Child Behavior Checklist problem items are scored from 0 to 2 (0=not true, 1=somewhat or sometimes true, and 2=very true or often true, on the basis of the preceding 6 months)
(4). A syndrome score is the sum of scores on all items included in the syndrome scale, as defined by Achenbach
(3). The following syndromes were analyzed: withdrawn, somatic complaints, and anxious/depressed, which form the internalizing group; social problems, thought problems, and attention problems, which are not part of either the internalizing or externalizing grouping; and delinquent behavior and aggressive behavior, which form the externalizing group.
The overall syndrome structure was supported by confirmatory factor analyses of parent, teacher, and self-ratings of referred Dutch children
(5,
6). The overall intraclass correlation for the 118 specific problem items is 0.95, which indicates very high test-retest reliability
(4).
Samples
Parents and parental surrogates of children selected from the general populations of 12 cultures responded to the 118 specific and two open-ended items of the Child Behavior Checklist. All samples involved randomized selection of children from the general population, with participation rates per sample of at least 80%. However, the specific selection procedures, including selection by households, schools, health care services, and municipalities, varied. Data were obtained for children from the following cultures.
1.
Australia: 1,372 4–16-year-olds were selected through random sampling of households in Western Australia and of one child per household
(9–
11).
2.
Belgium: 1,102 6–12-year-olds were selected through random sampling of health services and of children within the services in five Flemish provinces and the Brussels area
(12).
3.
China: 469 6–13-year-olds were selected from five urban schools and one rural/small town school in Fujian province in which teachers randomly sampled 20 children from each class in each school
(8).
4.
Germany: 2,863 4–18-year-olds were selected through random sampling of households throughout Germany and of one child per household
(13).
5.
Greece: 466 6–11-year-olds were selected through two-stage sampling of public primary schools in the greater Athens area, followed by random sampling of six children per grade per school
(14).
6.
Israel: 1,328 4–17-year-old Israeli-born Jewish children living in Jerusalem were randomly sampled from selected Jerusalem neighborhoods to ensure that the sample represented the urban population of Israel’s major cities
(15).
7.
Jamaica: 777 6–18-year-olds were selected by two-stage sampling of elementary schools from the Kingston area and the rural northeast, followed by random selection of one child per grade per school
(16).
8.
Netherlands: 2,227 4–18-year-old Dutch children were selected through two-stage sampling of municipalities, followed by random selection from municipal registers
(17).
9.
Puerto Rico: 777 4–16-year-olds were selected by revisiting households throughout Puerto Rico that had previously been selected for a survey of adult disorders, plus random sampling of new households, followed by random sampling of one child per household
(18).
10.
Sweden: 1,354 6–16-year-olds were selected through two-stage sampling of schools in Uppsala, Uppsala county, and Stockholm, followed by random sampling of one or two classes per grade per school, excluding special schools for children with problems
(19).
11.
Thailand: 768 6–17-year-olds from Bangkok and four regions were selected. The children were selected through random selection of grades and classes, followed by selection of one child per class; the adolescents were selected through random sampling of households from population directories
(20,
21).
12.
United States: 2,368 4–18-year-olds were selected through initial multistage random sampling of one child per household in households in the 48 contiguous states, followed by assessment 3 years later, when one additional 4–6-year-old was randomly selected within participating households that included children of these ages
(4). The sample was selected to be representative of the U.S. population with respect to ethnicity, socioeconomic status, geographic region (Northeast, North Central, South, and West), and area of residence (urban, suburban, rural).
The 15,871 subjects in the 12 samples were grouped according to age (ages 6–8, 9–11, 12–14, and 15–17). Subjects younger than 6 years or older than 17 years were excluded, which led to 13,697 subjects participating in the study.
RESULTS
Nine cultures yielded adequate data to study the eight Child Behavior Checklist syndromes across all four age groups and both sexes (N=11,887). Because the Belgian, Chinese, and Greek studies did not include enough adolescents, they were included only across the two lower age groups (6–8 and 9–11 years) (N=7,760).
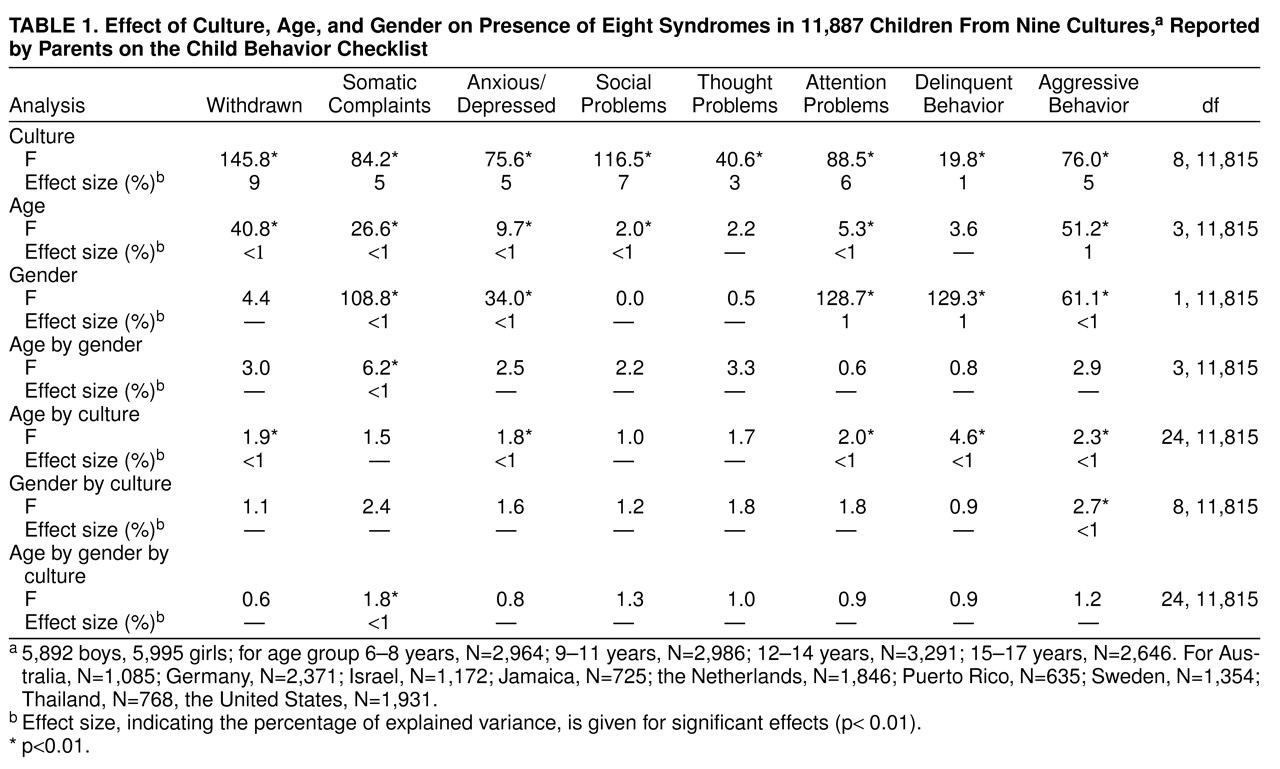
Analyses of variance (ANOVAs) provide information about the significance and size of culture, age, gender, and interaction effects. In view of the high statistical power afforded by the large N, we report only those effects that were significant at the level of p<0.01. Effect sizes are expressed as the percentage of explained variance, and they are interpreted according to Cohen’s criteria
(22) as small (1.0% to 5.9% of variance), medium (5.9% to 13.8%), or large (more than 13.8%). For example, the medium effect size for culture (9%) in the withdrawn syndrome describes the proportion of the total variance in the syndrome that can be explained by culture. The deviation of each level of an ANOVA factor from the overall mean for that factor can also be calculated (for example, the deviation of Australia from the overall mean for culture). Here, Bonferroni corrections were applied to correct for the number of comparisons actually made by calculating confidence intervals for the deviations of the parameters from the overall mean.
As
table 1, the nine-culture ANOVAs revealed significant effects for culture on each of the eight syndromes. Effect sizes varied from medium (9%) for withdrawn to small (1%) for delinquent behavior. On six syndromes, significant age effects were found, but effect sizes were small (1%) for aggressive behavior to very small (less than 1%) for other syndromes. On five syndromes, significant gender effects were found. These effect sizes were small (1%) for attention problems and delinquent behavior and very small (less than 1%) for the other syndromes. Seven two-way interactions and one three-way interaction were significant, but all effect sizes were very small (less than 1%).
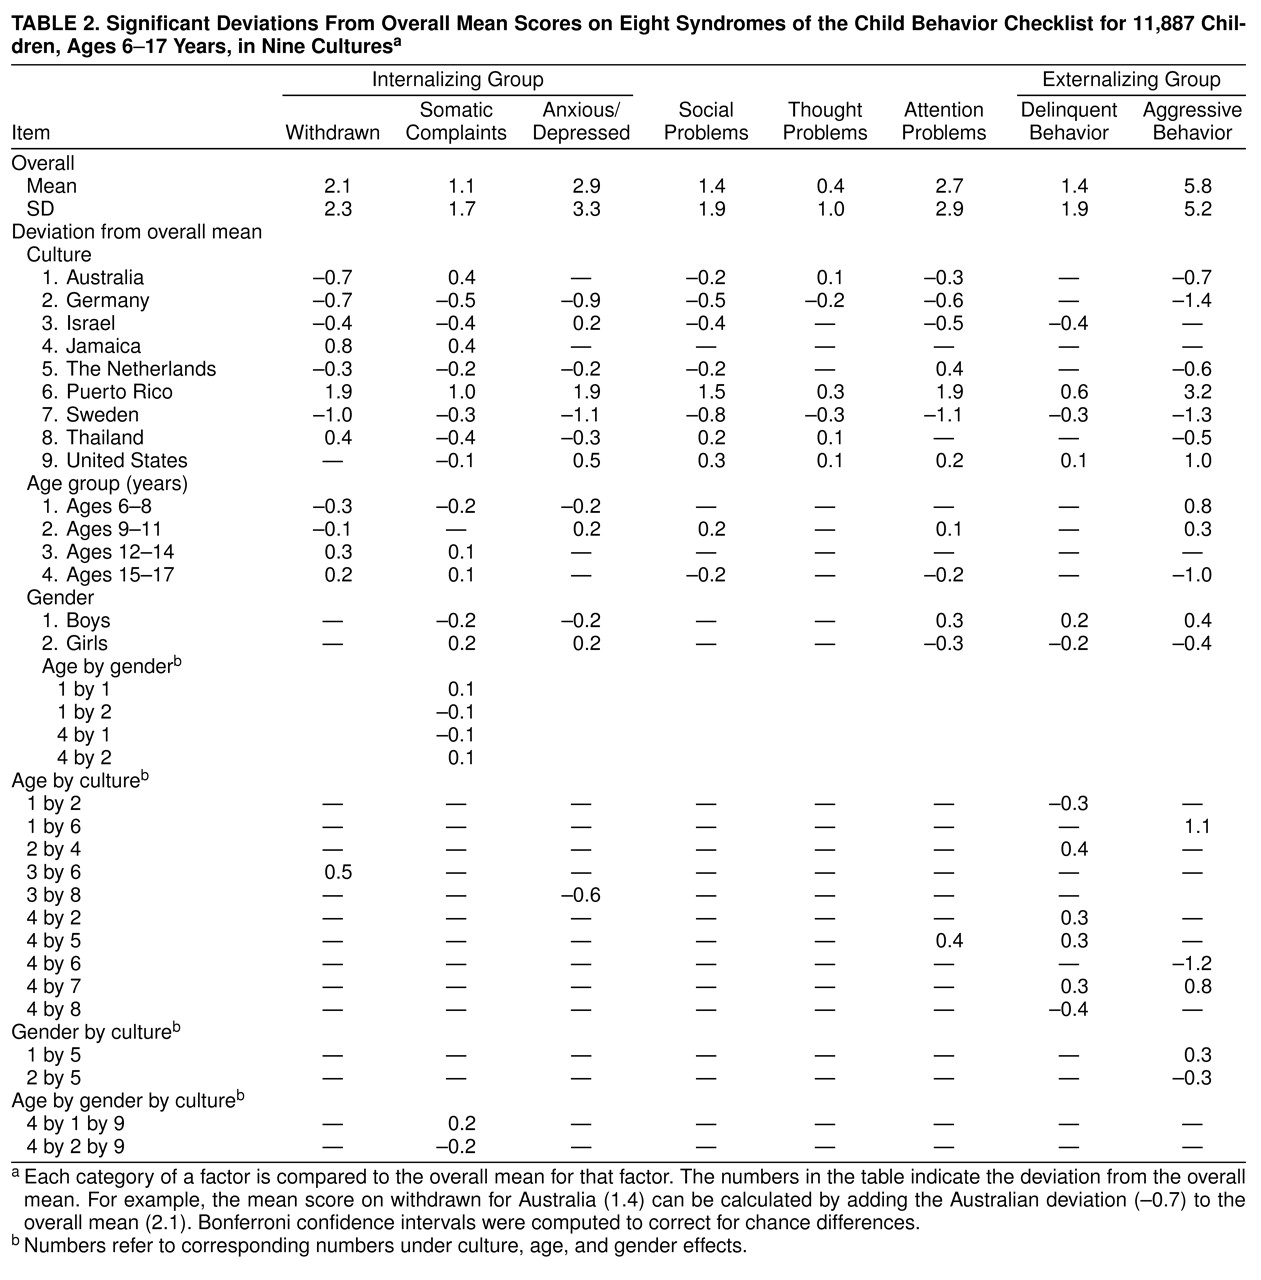
Parameter estimates of the deviation from the overall mean, as estimated in the nine-culture ANOVAs, for each category in significant culture, age, or gender factors are shown in
table 2. Puerto Rico scored consistently above the omnicultural mean on all syndromes, whereas Sweden scored consistently under this mean. Germany also scored under the mean, with the exception of a score on the mean for delinquent behavior. Other cultures showed less consistency across the eight syndromes. The United States, for example, scored above the omnicultural mean on six syndromes, at the mean on one, and below the mean on one.
The numbers in
table 2 indicate the deviation of each culture from the omnicultural mean. For example, the mean score for Australia on withdrawn (1.4) was calculated by adding the deviation for Australia (–0.7) to the omnicultural mean (2.1).
On withdrawn and somatic complaints, problem behavior increased from childhood to adolescence. On aggressive behavior but also on delinquent behavior and social problems, a decrease in problem behavior from childhood to adolescence was observed. On somatic complaints and anxious/depressed, boys scored lower than girls, whereas on attention problems, delinquent behavior, and aggressive behavior, boys scored higher than girls.
Parameter estimates for significant interactions of culture, age, and gender in the nine-culture ANOVAs are also presented in
table 2. For social problems and thought problems, no interactions were significant.
On the withdrawn syndrome, Puerto Rican 12–14-year-olds showed a steeper increase than children in other cultures. On somatic complaints, the gender difference was less marked at younger ages but increased at ages 15 through 17. For 15–17-year-olds in the United States, however, the gender difference disappeared. On anxious/depressed, Thai 12–14-year-olds scored lower than expected. On attention problems, Dutch adolescents scored significantly higher at ages 15 through 17, which contrasts with the decline in other countries. On delinquent behavior, 6–8-year-old children in Germany scored lower, 9–11-year-old children in Jamaica higher, and, at ages 15 through 17, adolescents in Germany, the Netherlands, and Sweden higher and adolescents in Thailand lower than would be expected on the basis of the age trend. On aggressive behavior, Puerto Rican 6–8-year-olds scored higher and 15–17-year-olds lower; and in Sweden, 15–17-year-old adolescents scored higher. In the Netherlands, boys were more and girls were less aggressive than the gender trend in other countries.
The 12-culture ANOVAs that included Belgium, China, and Greece, but were restricted to ages 6 through 11, were consistent with the nine-culture ANOVAs. These ANOVAs yielded significant cultural effects for each syndrome, as well as significant age effects for somatic complaints, anxious/depressed, and aggressive behavior. Significant gender effects were found for withdrawn, somatic complaints, anxious/depressed, attention problems, delinquent behavior, and aggressive behavior. Belgium scored above the omnicultural mean on attention problems; at the mean on withdrawn, anxious/depressed, social problems, delinquent behavior, and aggressive behavior; and below the mean on somatic complaints and thought problems. China scored above the mean on somatic complaints, social problems, attention problems, and delinquent behavior and at the mean on the remaining syndromes, whereas Greece scored at the mean on somatic complaints and thought problems and above the mean on the other syndromes.
DISCUSSION
Crijnen et al.
(1) demonstrated the utility of standardized parental ratings for cross-cultural comparisons of children in terms of total problems and broadband externalizing and internalizing patterns. The present article goes beyond the previous findings by providing more differentiated cross-cultural comparisons in terms of eight empirically derived syndromes.
In comparisons of 6–17-year-olds from nine cultures, cultural differences accounted for medium effect sizes on the withdrawn (9% of variance), social problems (7%), and attention problems (6%) syndromes. Cultural differences accounted for small effect sizes on the somatic complaints (5%), anxious/depressed (5%), thought problems (3%), delinquent behavior (1%), and aggressive behavior (5%) syndromes. Findings for 6–11-year-olds across 12 cultures were generally similar to those of the nine-culture comparisons. In both the nine-culture and 12-culture comparisons, Puerto Rico scored consistently above the omnicultural mean, whereas Sweden and Germany scored consistently below the mean. Other cultures showed less consistency across the eight syndromes.
As Crijnen et al.
(1) pointed out, the consistently high Puerto Rican and low Swedish scores may reflect sampling differences. In particular, the population-based Puerto Rican sample was drawn from the entire island, and its 96% completion rate exceeded that of all other samples. The school-based Swedish sample, by contrast, excluded certain special schools for problem children, depended on children to deliver Child Behavior Checklists to their parents, and was drawn only from the Uppsala and Stockholm areas. Its 84% completion rate was among the lowest.
Another factor that may have contributed to the large difference between the Puerto Rican and Swedish problem scores was the relatively low socioeconomic status of the Puerto Rican sample, whereas the Uppsala-Stockholm area that provided the Swedish sample was of relatively high socioeconomic status. The potential contribution of socioeconomic status to the difference between Puerto Rican and Swedish scores is suggested by the somewhat higher problem scores found among children of lower socioeconomic status than among those of upper socioeconomic status in various cultures
(23). Sampling and socioeconomic status differences are not likely to explain all of the cross-cultural differences in syndrome scores, however, because deviations from the omnicultural means tended to be small and some patterns of syndrome scores were specific to a particular culture. For example, scores of Greek children were exceptionally high on the anxious/depressed and aggressive behavior syndromes but did not differ significantly from the omnicultural mean on the somatic complaints or thought problems syndromes.
The cross-cultural differences in scores on particular syndromes and the overall patterns of differences provide stepping stones toward more detailed investigations of factors that affect children’s problems within and across cultures. One possible approach is to do additional comparisons among cultures that showed particularly large differences on particular syndromes. For example, as shown in table 2, the nine-culture ANOVA revealed that Puerto Rican children’s scores on the anxious/depressed syndrome were considerably higher than scores in any other culture, whereas German and Swedish scores were the lowest. To illuminate the parent-reported differences, we could use other sources of data to compare Puerto Rican, German, and Swedish children on the anxious/depressed syndrome. This could be done by using the Teacher’s Report Form to obtain data from teachers and the Youth Self-Report to obtain self-reports
(3). It would also be helpful to add procedures that operationalize constructs of anxiety and depression in other ways, such as interviews designed to make DSM or ICD diagnoses. If the different ways of operationalizing anxiety and depression agree in showing higher rates for Puerto Rican than German and Swedish children, this would demonstrate that the differences were not restricted to parents’ perceptions. Puerto Rican adults could also be compared with German and Swedish adults to determine whether differences persist into adulthood. If differences were not found between the Puerto Rican and the German and Swedish adults, this would implicate culturally related factors specific to childhood anxiety and depression. The cross-cultural differences in syndrome scores can guide the exploration of the origins of differences in the development of psychopathology. Both the similarities and differences revealed by standardized assessment of culturally diverse children suggest numerous research and clinical approaches to illuminating the culturally specific versus more universal aspects of psychopathology.
IMPLICATIONS
Age and gender variations among syndromes scored from parents’ ratings were quite similar across the 12 cultures. However, there were significant cross-cultural differences in the overall magnitude of scores on certain syndromes. The growing need to serve children from diverse cultural backgrounds argues for using standardized assessment procedures of proven applicability to multiple cultures. It is equally important to be aware of differences in the problems reported for children from different cultures. Table 2 displays the details of cross-cultural differences in syndrome scores.
A finding that parents from culture A rate their children higher on a particular syndrome than do parents from culture B can have a variety of clinical implications, including the following: 1) parents from cultures A and B may have different thresholds for reporting particular kinds of problems, 2) the rates of particular problems may really differ between cultures A and B, and 3) linguistic differences between cultures A and B may focus parents’ reports on different problem areas.
The relatively small differences found among most of the 12 cultures in total problem scores
(1) indicate that standardized, empirically based assessment can give clinicians a solid baseline for evaluating syndrome scores obtained by individual children from diverse cultures. In the assessment of an individual child, it is, of course, most helpful for clinicians to have appropriate norms with which to compare the child’s syndrome and total problem scores. However, to help children from diverse backgrounds for which specific norms may not exist, clinicians need to integrate knowledge of the range of cross-cultural variations on particular syndromes with their appraisal of individual child and family characteristics when judging needs for interventions.


