Depression in the elderly is a clinically and neurobiologically heterogeneous disorder
(1,
2). The clinical management of geriatric depressed patients is complicated by age-related changes in cognition, neurochemical function, and drug metabolism and by comorbid medical illnesses. The clinical response to antidepressant treatment in geriatric depressed patients is often delayed; the median time to remission is reported as 12 to 13 weeks
(3,
4). Even under highly uniform treatment conditions, the course of antidepressant response has been reported to be highly variable across patients, ranging from a rapid, sustained response (31% of patients studied) to a delayed but sustained response (22%) to a partial/mixed response (23%) or nonresponse (24%)
(5). Thus, even though many antidepressant agents are available, some cases of depression are still refractory to treatment. At present, there is no predictive test to determine which of the existing antidepressant medications will be efficacious and which will produce the fewest side effects for a given patient. The most critical questions in the clinical management of elderly depressed patients include 1) How can the clinical response to antidepressant treatment be accelerated safely? and 2) How can treatment nonresponders be identified before undergoing an extended clinical trial? For identifying the neurobiologic mechanisms underlying antidepressant response and the variability in treatment response among patients, the combination of functional imaging studies with a clinical trial of antidepressant medication is a potentially powerful research strategy.
These considerations provided the impetus for the design of a combined clinical trial and positron emission tomography (PET) imaging study to determine whether antidepressant response would be accelerated by the combination of 36 hours of total sleep deprivation and antidepressant treatment (paroxetine) for geriatric depressed patients. Total sleep deprivation has been evaluated previously as a nonpharmacologic intervention that has consistently produced a short-term antidepressant response in over 50% of depressed patients across studies
(6). In the elderly, total sleep deprivation has produced clinical improvement in 40% of patients, and the clinical response to total sleep deprivation has predicted the subsequent response to nortriptyline treatment
(7,
8). In a series of 13 geriatric depressed patients who underwent a clinical trial of total sleep deprivation and paroxetine
(9), 62% demonstrated improvement of depressive symptoms by 2 weeks of treatment (85% within 12 weeks) and the median response time was 2 weeks, compared to the 12–13 weeks previously reported for antidepressant treatment alone. In the present study, six of the 13 patients who participated in that clinical trial and six age-matched comparison subjects were enrolled in a brain imaging study using PET and [
18F]fluorodeoxyglucose (FDG) to measure the cerebral glucose metabolic response to total sleep deprivation and antidepressant treatment. PET studies were performed at baseline, after total sleep deprivation, after recovery sleep, and for patients only, after 2 weeks of antidepressant treatment with paroxetine.
PET studies of glucose metabolism are a logical first step in measuring the effects of sleep deprivation and antidepressant treatment on brain function in geriatric depression. Measures of glucose metabolism have demonstrated sensitivity in detecting functional alterations in depressed patients, in identifying differences between patients who are treatment responders and nonresponders, and in monitoring the functional consequences of total sleep deprivation and antidepressant treatment (for example, see references
10–
16 and reviews in references
17 and
18). Specifically, functional imaging studies have consistently demonstrated abnormalities in anterior cingulate metabolism in both primary and secondary depression and alterations in anterior cingulate metabolism by a variety of antidepressant treatments
(10–
16). Relative anterior cingulate hypermetabolism at baseline has been shown to predict subsequent response to antidepressant treatment
(14) and to total sleep deprivation
(15). As the anterior cingulate cortex is a critical area of integration between brain regions that have been implicated in the cognitive/affective and somatic/vegetative symptoms of depression, such a relationship is consistent with the role of the anterior cingulate in mediating response to antidepressants
(17).
On the basis of the previous PET studies of the glucose metabolic response to total sleep deprivation and to antidepressant treatment in midlife depression, it was hypothesized that total sleep deprivation would reduce metabolism in the anterior cingulate cortex and that metabolism in this region would remain decreased after recovery sleep and antidepressant treatment. The present study differed from previous PET studies of the effects of total sleep deprivation in that this study assessed whether the effects are transient (whether the metabolic alterations persist after recovery sleep), whether glucose metabolism is altered by the combination of total sleep deprivation and antidepressant treatment, and how elderly patients with depression are affected.
METHOD
Study Design
The depressed patients and age-matched comparison subjects underwent three consecutive nights of EEG sleep studies at the Sleep and Chronobiology Laboratory at the Western Psychiatric Institute and Clinic, as described previously
(7–
9). During total sleep deprivation, the patients were continuously monitored with EEG and by the staff to ensure that no naps were taken. In order to assist the subjects in staying awake, they were provided with reading materials and videotapes, but contact with the staff was kept to a minimum. As described by Bump et al.
(9), during sleep deprivation none of the subjects met the criterion for sleep onset (10 minutes of consecutive stage 2 sleep).
FDG PET studies were performed on the morning after each sleep study at the same time of day (10:00–11:00 a.m.) at baseline, i.e., before total sleep deprivation (scan 1), 24 hours after sleep deprivation (scan 2), and after the first night of recovery sleep (scan 3). The patients and comparison subjects woke up between 7:00 and 8:00 a.m. so that a sufficient amount of time would elapse between the last episode of sleep and the PET study. The depressed patients received the first dose of paroxetine before going to bed on the evening of recovery sleep, so that the third PET scan represents the effects of both a single dose of paroxetine and recovery sleep. The depressed patients underwent a fourth PET scan 2 weeks after the beginning of paroxetine treatment. A 10-mg dose of paroxetine was given at bedtime before recovery sleep and the following night. The dose was then increased to 20 mg once daily, and after 2 weeks of treatment the dose was increased to 30 mg/day if clinically indicated. The clinical trial of paroxetine for the patients continued for an additional 10 weeks, for a total of 12 weeks of antidepressant treatment.
Subjects
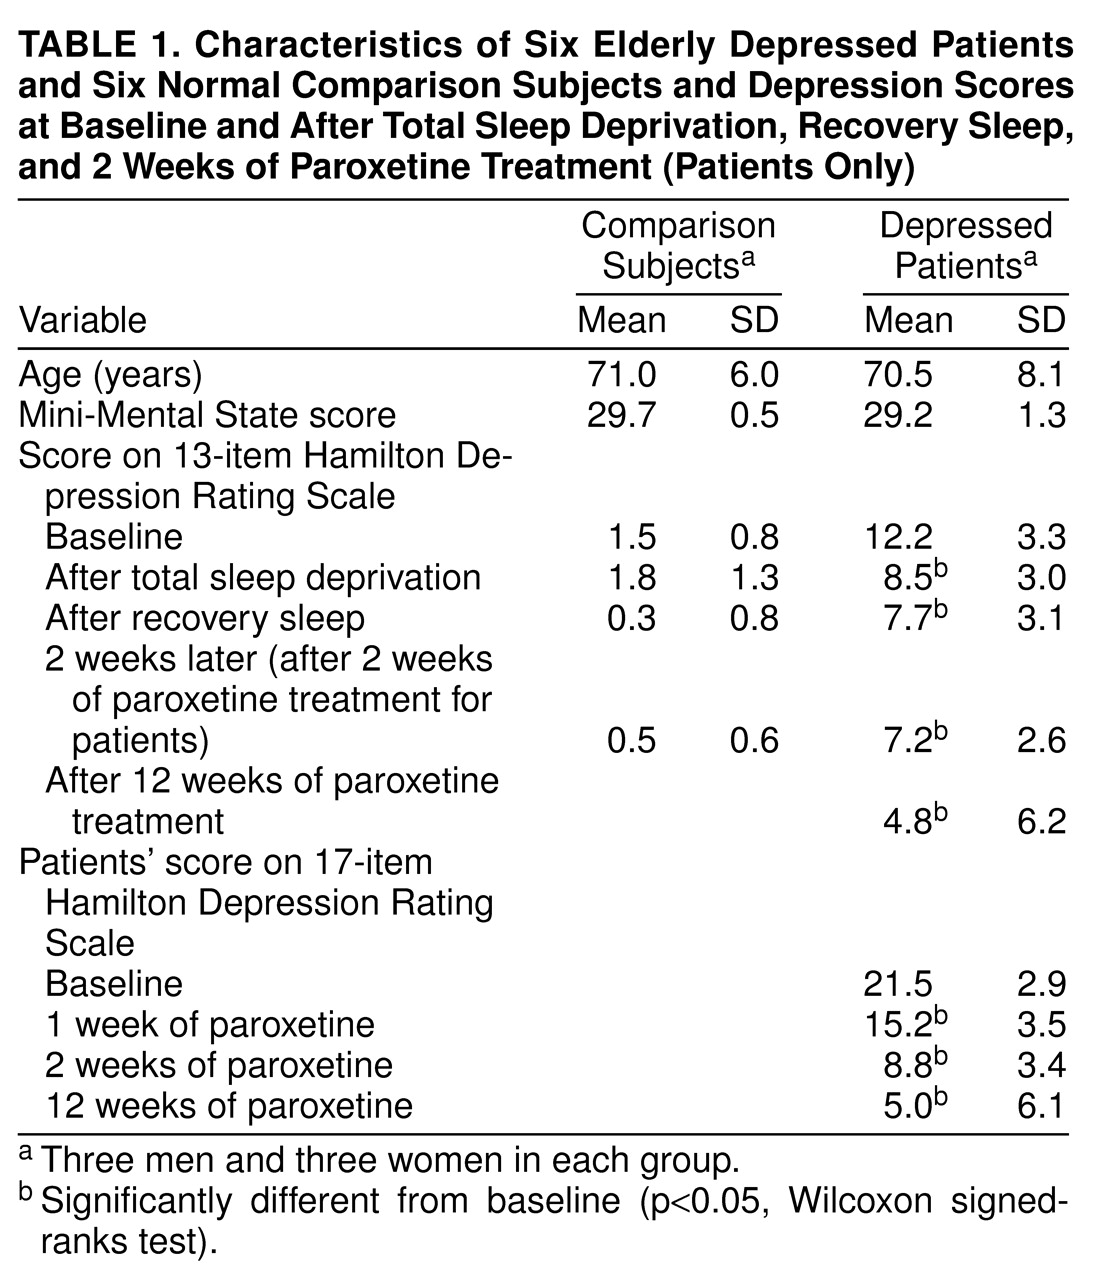
The depressed patients were recruited from the outpatient clinic of the Mental Health Clinical Research Center for Late-Life Mood Disorders. Six depressed patients who met the DSM-IV criteria for current major depressive episode (nonbipolar, nonpsychotic) were enrolled in the study. These patients were the last six consecutive patients recruited in the larger clinical trial, since institutional approval for the PET studies was obtained after the clinical trial began. We also recruited six age- and gender-matched normal comparison subjects who had no history or current diagnosis of a psychiatric or neurologic illness. The normal subjects had been followed in a longitudinal study of EEG sleep in normal aging conducted by the Sleep and Chronobiology Laboratory. Subjects with a history of seizure disorder or a baseline (before sleep deprivation) polysomnogram indicating 10 or more apnea-hypopnea events per hour of sleep were excluded. Patients and comparison subjects with a current diagnosis of diabetes (not controlled by diet) were also excluded. All patients were free of psychotropic medications for a minimum of 2 weeks (4 weeks for fluoxetine). The subject characteristics are shown in
Table 1. After complete description of the study to the subjects, written informed consent was obtained according to procedures established by the Biomedical Institutional Review Board and the Radioactive Drug Research Committee/Human Use Subcommittee—Radiation Safety Committee at the University of Pittsburgh Medical Center.
Clinical Assessment
The 17-item Hamilton Depression Rating Scale
(19) was administered weekly, and a modified version (13 items total, without the three sleep items and the one item for weight) was administered daily for the first 17 days to track the course of clinical change. The Hamilton depression scale was modified because some of the items would not be valid given that the scale is administered daily and the sleep deprivation itself may alter the ratings. Specifically, sleep deprivation would affect the patients’ sleep patterns and would affect the ratings. In addition, the item for weight loss/gain may not show effects in this short time frame. To assess the stability of symptom reduction, the 17-item Hamilton depression scale was repeated over the remaining 10 weeks of the clinical trial. The results for the 17-item Hamilton scale are reported for baseline and for the 1-, 2-, and 12-week time points for comparison with ratings in other depression studies. The results for the 13-item Hamilton scale are reported for baseline, after sleep deprivation, after recovery sleep, and 2 weeks posttreatment to correspond to the PET studies. The exact Wilcoxon matched-pairs signed-ranks test was used to test differences in depression scores across the treatment conditions.
PET Imaging
FDG was synthesized according to the methods described by Hamacher et al.
(20). An intravenous catheter was inserted for radiotracer administration. PET studies were performed with the Siemens HR+ECAT PET scanner (Siemens/CTI, Inc., Knoxville, Tenn.). The emission and transmission data were acquired by using three-dimensional data acquisition and reconstruction procedures. To measure glucose metabolism, 5 mCi of FDG was injected as an intravenous bolus. After injection of the FDG, each subject was asked to repeat letters as presented on a computer screen. The task was used to keep the subject’s behavioral state constant and to keep the subject awake during the uptake interval, across scans. A static emission scan began 35 minutes after radiotracer injection and lasted for 40 minutes. After the emission scan was completed, a transmission scan was performed, with use of rotating rods of
68Ge/
68Ga with electronic windowing around the rods to minimize scatter
(21).
Magnetic Resonance Imaging
All subjects underwent magnetic resonance (MR) scanning before the first PET study. The MR scans were performed at the University of Pittsburgh Medical Center Magnetic Resonance Research Center by using a GE Signa 1.5-T scanner (GE Medical Systems, Milwaukee). T1-weighted images (TE, 18 msec; TR, 400 msec; number of excitations, 1; slice thickness, 3 mm/interleaved) were used for PET-MR coregistration. Proton density and T2-weighted scans were acquired for clinical diagnosis and to exclude individuals with stroke or tumor.
Image Analysis
The PET-to-PET and PET-to-MR coregistrations were performed by using automated image registration
(22–
24) as described previously
(25). The data were analyzed by using a voxel-wise method, statistical parametric mapping (SPM95, MRC Cyclotron Unit, Hammersmith Hospital, London [
26,
27]). The MR data were transformed to the standard atlas MR data set by linear affine transformation by using automated image registration
(23,
24). The coregistered PET images were smoothed with a Gaussian filter (16×16×12 mm) and were similarly transformed into the standard space by using the same transformation equations as for the subjects’ MR data, thereby using the MR anatomical information for coordinate transformation
(24). Once transformed, the PET data were processed by statistical parametric mapping with analysis of covariance to normalize the data for global changes in metabolism and post hoc t tests to detect regions of significant state-dependent change. For the statistical parametric mapping analysis, we performed contrasts of the baseline scan to the total sleep deprivation, recovery sleep, and treatment conditions (the last comparison included the patients only). The significantly different pixels were output by a normalized Gaussian z score, and their Talairach atlas coordinates were provided
(28). A region was considered to show significant change if it contained 100 or more pixels and if the z score was 3.29 or greater (p<0.001, two-tailed).
RESULTS
Clinical Ratings
The mean scores on the 17-item Hamilton depression scale for the baseline and 1-, 2-, and 12-week treatment time points are shown for the patients in
table 1, as are the scores on the 13-item Hamilton scale obtained before the PET scans at baseline, after sleep deprivation, after recovery sleep, and 2 weeks posttreatment for the comparison subjects and patients. For the patients, the scores on the 17-item Hamilton scale were significantly decreased from baseline after 1 week (S=10.5, N=6, p<0.05, Wilcoxon signed-ranks test), 2 weeks (S=10.5, p<0.05), and 12 weeks (S=10.5, p<0.05) of treatment. The scores on the 17-item scale did not decrease significantly between 1 and 2 weeks of treatment (S=7.5, p>0.05) or between 2 and 12 weeks of treatment (S=6.0, p>0.05). Thus, the initial decrease in depressive symptoms for the patient group persisted throughout the course of treatment. On the 13-item Hamilton depression scale, the patients’ scores were significantly decreased from baseline after total sleep deprivation (S=10.5, p<0.05), after recovery sleep (S=10.5, p<0.05), and after 2 weeks (S=10.5, p<0.05) and 12 weeks (S=10.5, p<0.05) of treatment. There was no significant difference in scores on the 13-item scale between sleep deprivation and recovery sleep (S=3.0, p>0.05), between recovery sleep and 2 weeks posttreatment (S=–0.5, p>0.05), or between 2 weeks and 12 weeks of treatment (S=5.0, p>0.05). For the normal comparison subjects, there were no significant differences from baseline in the scores on the 13-item Hamilton scale after sleep deprivation (S=2.5, p>0.05) and after recovery sleep (S=8.0, p>0.05). Five of the six depressed patients were classified as treatment responders after 12 weeks of treatment, on the basis of a greater than 50% reduction in score on the 17-item Hamilton depression scale or a score of less than 10 on the 17-item scale.
Glucose Metabolism
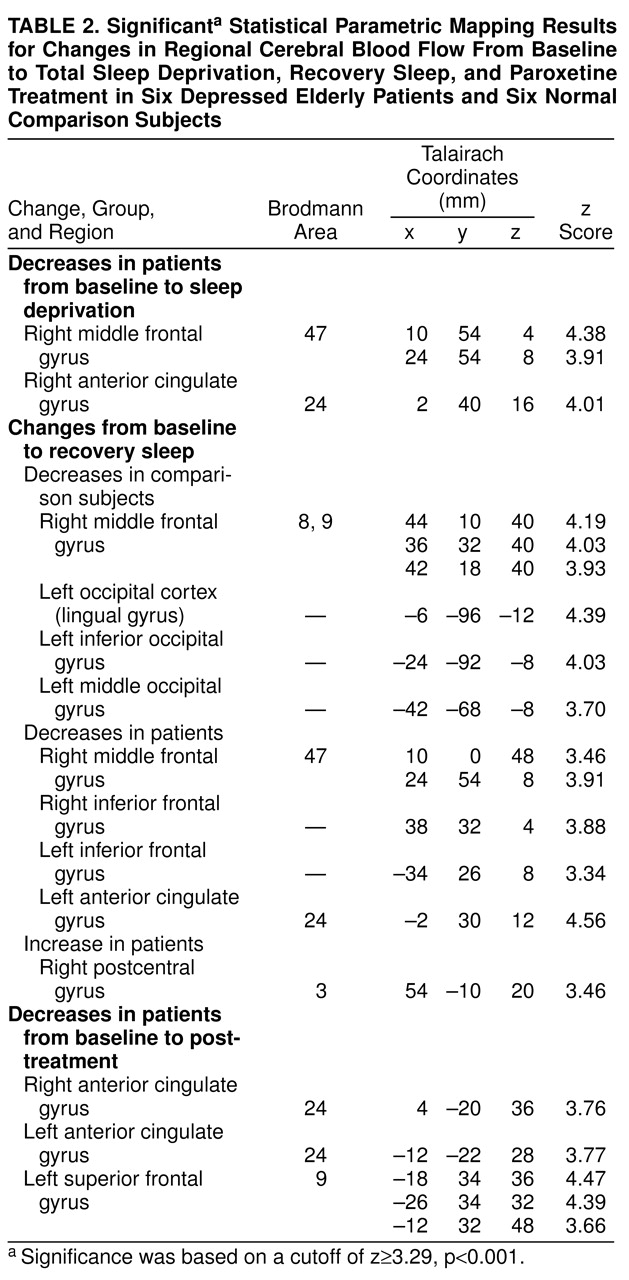
The significant Talairach coordinates and z scores are shown in
table 2. After sleep deprivation the patients demonstrated a decrease from baseline in metabolism in the right anterior cingulate cortex (Brodmann area 24) and right medial frontal gyrus (Brodmann area 47). The comparison subjects did not demonstrate significant alterations in glucose metabolism after sleep deprivation. After recovery sleep the patients had lower metabolism than at baseline in the right medial frontal gyrus and in the inferior frontal gyrus bilaterally. In the anterior cingulate gyrus, metabolism was significantly decreased bilaterally, although the change on the right side was less significant (x, y, z coordinates 6, 36, 8; z=2.94, p<0.01) than the change on the left side (
table 2). The patients had increases in the right postcentral gyrus. In the comparison subjects, decreases in glucose metabolism between baseline and recovery sleep were observed in the right medial frontal gyrus (Brodmann areas 8 and 9) and the left occipital association cortex. After 2 weeks of paroxetine treatment, the patients’ glucose metabolism was lower than at baseline in the right and left anterior cingulate cortex (Brodmann area 24) and the left superior/medial frontal gyrus (Brodmann area 9).
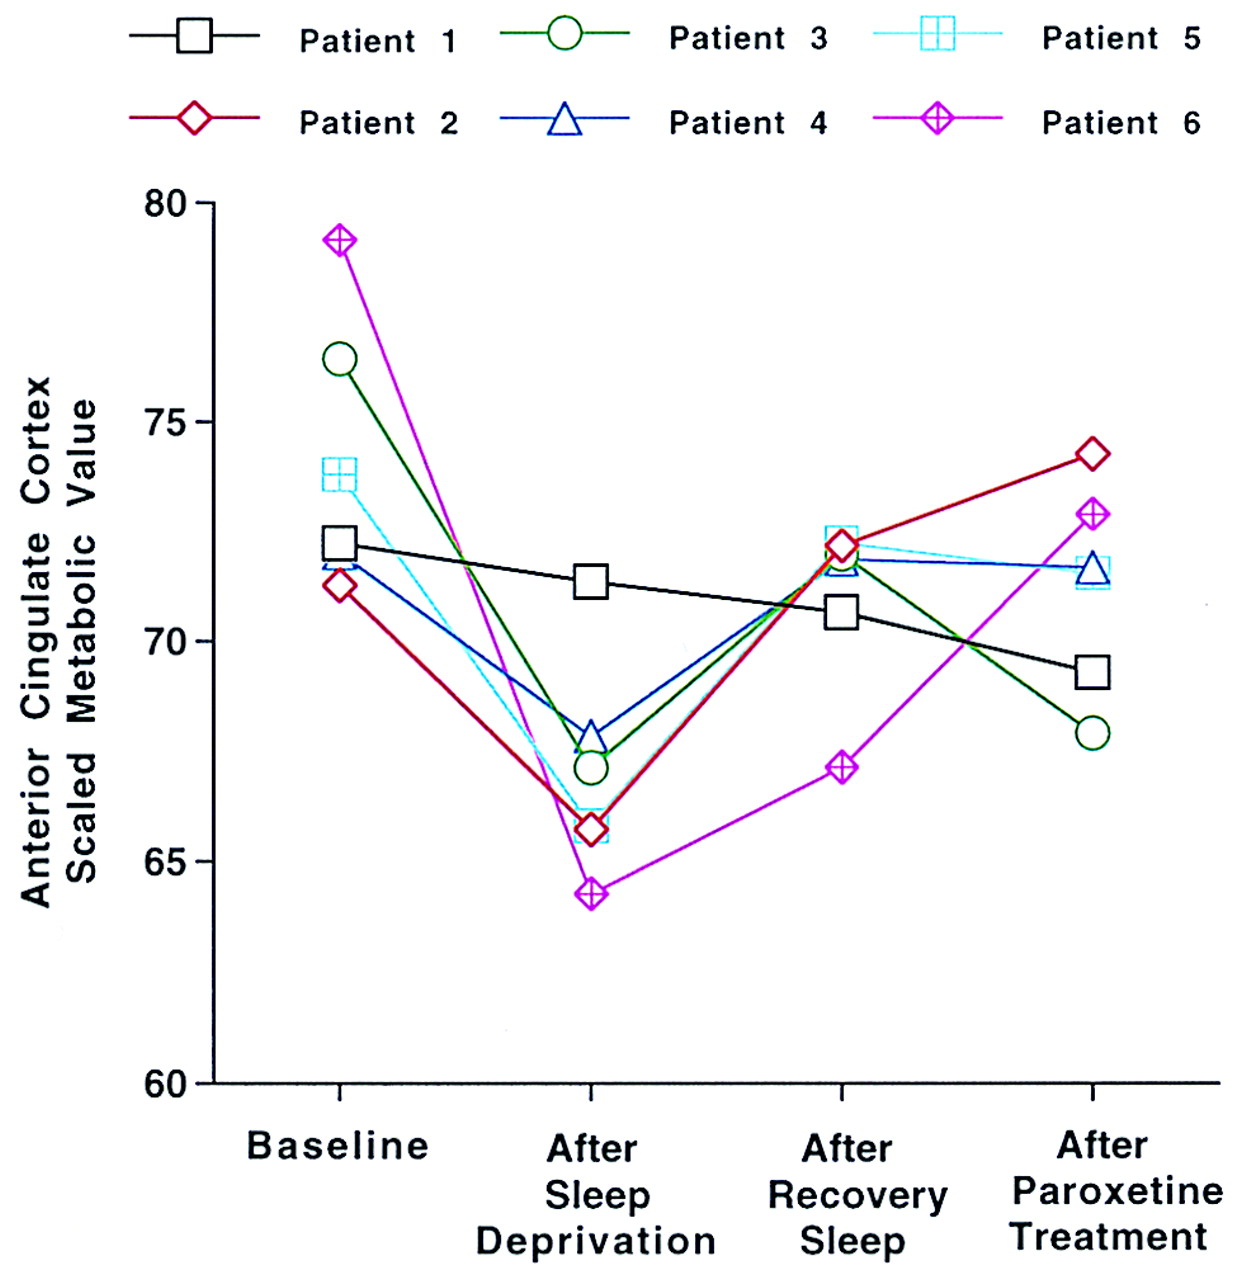
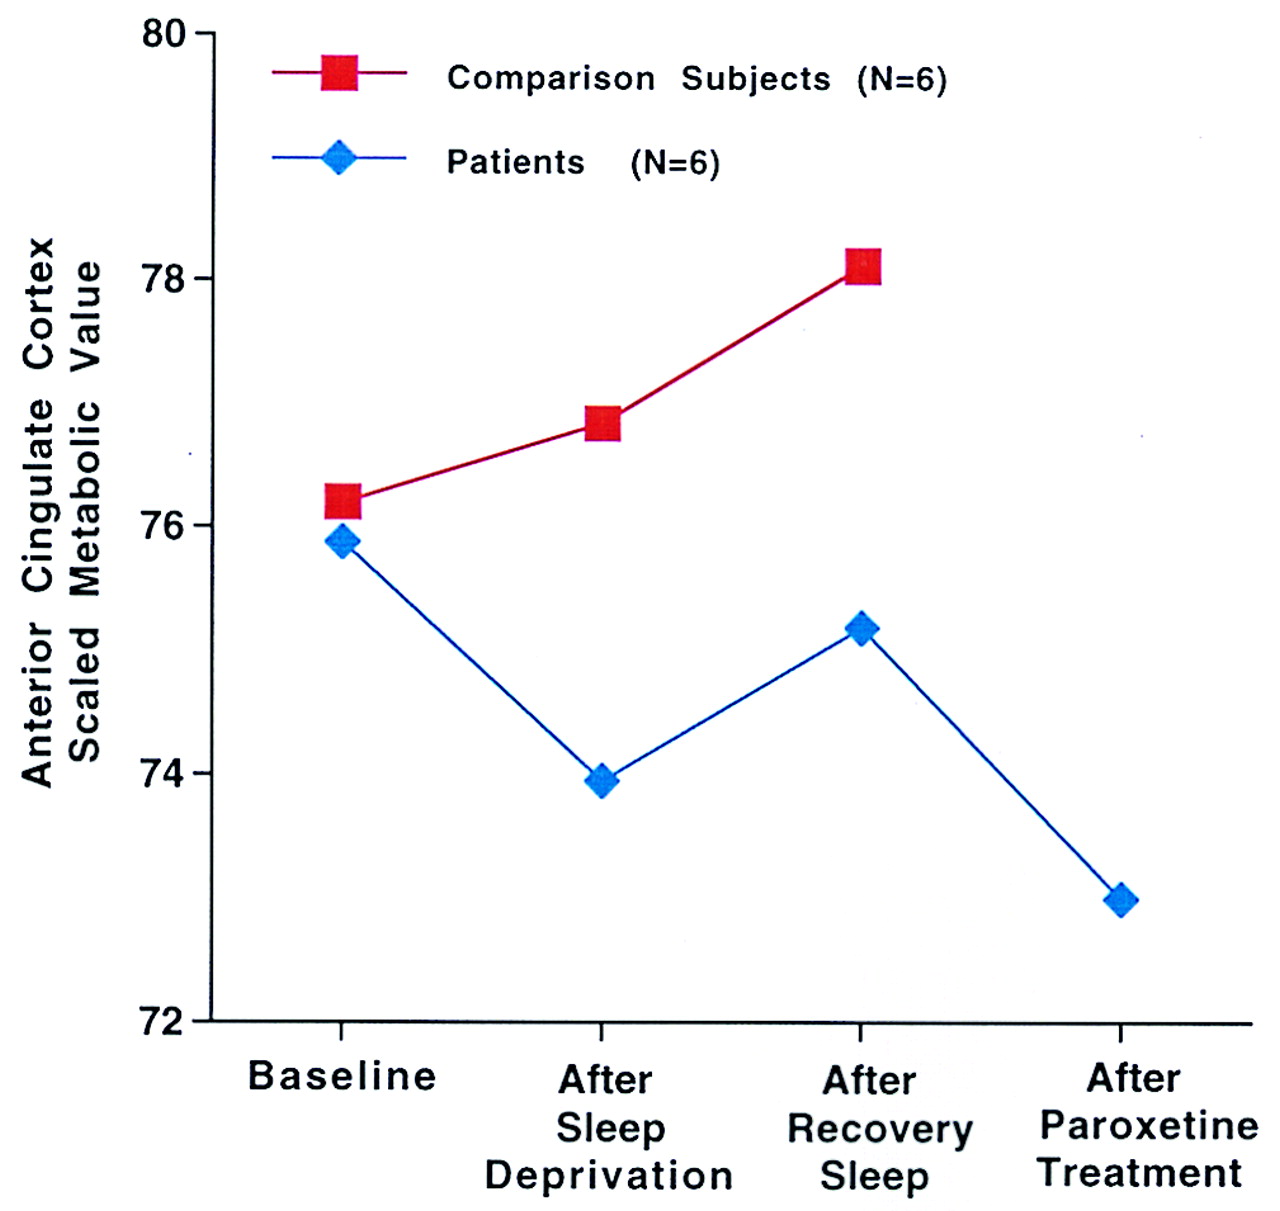
Figure 1 shows the normalized glucose metabolism for a representative region within the anterior cingulate cortex (x, y, z coordinates 2, 40, 16) at baseline, after total sleep deprivation, after recovery sleep, and after 2 weeks of paroxetine treatment in the six geriatric depressed patients. For the patients and comparison subjects,
Figure 2 shows the mean normalized glucose metabolism in the anterior cingulate cortex (coordinates 4, –20, 36) at baseline, after total sleep deprivation, after recovery sleep, and after 2 weeks of paroxetine treatment (patients only). The patients demonstrated a decrease in metabolism in the anterior cingulate gyrus, whereas the comparison subjects had a progressive increase in metabolism from the baseline to the sleep deprivation and recovery sleep studies.
DISCUSSION
The results of the present study provide preliminary evidence that persistent decreases in normalized glucose metabolism in the anterior cingulate cortex are observed after total sleep deprivation, recovery sleep, and antidepressant treatment in elderly patients with depression. Decreased metabolism in the medial prefrontal cortex is observed after sleep deprivation and recovery sleep in the patients and in the comparison subjects after recovery sleep only. As only one of the six patients did not meet the criteria for treatment response after 12 weeks of treatment (patient 1), the alterations in glucose metabolism described in this study largely reflect changes in patients who were treatment responders. This may explain why the anterior cingulate cortex demonstrated persistent reductions in glucose metabolism in the patients, as decreases in this brain region are observed in treatment responders
(16) It is important to note that the areas of maximal change within the anterior cingulate cortex differed among the comparisons of the different study conditions to baseline. From sleep deprivation to recovery sleep to posttreatment, the area maximally decreased within the anterior cingulate cortex was progressively more lateral, rostral, and dorsal in the x, y, and z axes, respectively. In anatomical terms, metabolism in Brodmann areas 24a/25 and 24b of the anterior cingulate cortex was reduced after total sleep deprivation, and metabolism in Brodmann areas 24b and 30 was reduced after recovery sleep and treatment. At the functional level, the mood and vegetative-somatic areas of the cingulate cortex showed alterations initially, and the attentional-cognitive areas of the cingulate showed alterations with longer treatment. Thus, treatment response evolves with sleep deprivation and antidepressant treatment within different subregions of the anterior cingulate cortex.
As shown in
Figure 1, all but one of the patients (patient 1) demonstrated a decrease in anterior cingulate glucose metabolism after total sleep deprivation. While this patient did demonstrate a reduction in Hamilton depression score after sleep deprivation (from 12 at baseline to 5 after sleep deprivation), this is the only patient of the group of six who failed to meet the criterion for treatment response after 12 weeks of treatment (his score at 12 weeks was 17). This observation provides very preliminary evidence that the glucose metabolic response to total sleep deprivation in the anterior cingulate may predict subsequent clinical response to antidepressant treatment. The relative predictive value of the metabolic versus clinical measures must be assessed in a larger group of patients. The regional changes in glucose metabolism with total sleep deprivation in geriatric depressed patients are consistent with results of similar studies of midlife depressed patients who have undergone total sleep deprivation
(15,
16).
The change in the medial prefrontal cortex in the patients after total sleep deprivation, recovery sleep, and treatment and in the comparison subjects after recovery sleep may be interpreted in the context of recent reports of the activation of this region in normal subjects by both externally and internally generated emotional states, regardless of the nature of the emotional stimulus
(29,
30). Thus, the medial prefrontal cortex may play a general role in the modulation of emotional states. In contrast to the findings in this study, it should be noted that in the studies of midlife depressed patients, metabolism in the medial prefrontal cortex was increased by antidepressant treatment
(17). This differential response may be related to differences between metabolism in the medial prefrontal cortex in the unmedicated state between midlife and geriatric depressed patients. In midlife depressed patients, metabolism in the medial prefrontal cortex is lower than in comparison subjects
(17), whereas in the current study there were no differences at baseline in medial prefrontal cortex metabolism between the elderly depressed patients and comparison subjects.
On the basis of the known neurochemical pathways underlying the regions of glucose metabolic alterations after sleep deprivation and treatment and the studies of the neurochemical effects of total sleep deprivation in animals, it is possible to hypothesize which neurochemical mechanisms may underlie the effect of total sleep deprivation and to use recently developed PET methods to test these hypotheses
(31,
32). Studies of the neurochemical effects of total sleep deprivation in animals have demonstrated changes in several functionally related neurotransmitter systems
(33–
37). On the basis of the neurochemical effects of total sleep deprivation and antidepressant treatment in animal studies, the neurochemical mechanism that would account for the results in the present study is augmentation of monoamine function (serotonin, dopamine) by total sleep deprivation to produce the initial antidepressant response and to “jump start” these neurochemical systems. Treatment with a selective serotonin reuptake inhibitor further augments monoamine function, which results in a more rapid modulation of the other neurotransmitter systems that may also be involved in the antidepressant response (e.g., cholinergic, opiate, and noradrenergic systems). The application of PET methods to study monoamine activity and monoamine modulation of other neurotransmitter systems in vivo would allow these hypotheses to be tested directly
(31,
32).
In summary, total sleep deprivation, recovery sleep, and antidepressant treatment resulted in persistent decreases in glucose metabolism in the anterior cingulate cortex of elderly depressed patients, most of whom responded to antidepressant treatment. This approach will be extended to a randomized clinical trial that will compare the effects of paroxetine and of combined total sleep deprivation plus paroxetine and will include the appropriate comparison groups (total sleep deprivation plus placebo and paroxetine only) to determine whether total sleep deprivation combined with paroxetine treatment does accelerate the clinical and glucose metabolic response to antidepressant treatment. Finally, an understanding of the differences in functional anatomy and underlying neurochemical substrates between responders and nonresponders may have implications for the clinical management of elderly depressed patients, for whom variability in treatment response is a significant clinical problem.
