Magnetic resonance imaging (MRI) has provided an important method for investigating structural brain changes in schizophrenia. However, there are several difficulties in interpreting the published literature. First, sample sizes have often been small, and, because the magnitudes of brain differences are also small, the results of individual studies may be unduly influenced by sampling variation. Second, the results of the studies have generally been reported with an emphasis on tests of significance rather than confidence intervals, and this may give the misleading impression of a large number of inconsistent positive or negative findings. Third, many different brain regions have been examined, but only a few of these have been measured in each individual study. Finally, the results of some studies have been reported in multiple publications.
Meta-analysis provides a method for integrating quantitative data from multiple studies. It has the advantages that 1) the results from individual studies are combined, improving the estimation of the overall effect size, 2) statistical power is increased, 3) confidence intervals for the overall effect size can be calculated, and 4) factors causing heterogeneity in the results reported by individual studies can be investigated
(1).
Previous meta-analyses of structural imaging studies of schizophrenia have found that patients have higher ventricle-to-brain ratios
(2), greater volumes of the lateral ventricles (3), reduced brain size
(3,
4), reduced cross-sectional area of the corpus callosum
(5), and reduced volumes of the bilateral temporal lobe
(3), hippocampus
(6), and amygdala-hippocampal complex
(3,
6).
Our meta-analysis goes beyond the previous literature by 1) including new studies published up to August 1998, 2) including a wider range of regional structures in order to delineate the pattern of volume changes throughout the brain, and 3) using random effects models for the meta-analyses
(7).
We have separated regional and global volume differences. In particular, we have addressed the following questions: 1) Are regional volume differences in cortical/subcortical structures in excess of the overall difference in cerebral volume? and 2) Are regional volume differences in ventricular subdivisions in excess of the overall difference in ventricular volume?
We have investigated two possible explanations for heterogeneity
(8) in study results: gender and MRI study slice thickness. Finally, we have investigated the studies included in this meta-analysis using a statistical method developed to test for evidence of potential publication bias
(9,
10).
METHOD
Study Ascertainment
Studies were considered for inclusion if 1) they were published before September 1998 as an article (rather than a letter or an abstract), 2) they compared a group of subjects with schizophrenia and a normal comparison group (either related or unrelated to the subjects; comparison groups consisting of patients with minor nonpsychiatric illnesses were also included), and 3) they reported volumetric brain MRI measurements of any structure considered in this meta-analysis (selected on the basis of a previous systematic review
[3]). Since studies applied different criteria for measuring these structures, we followed operational definitions for including measurements within a particular category of structure; in some cases we also estimated cerebral volume and total ventricular volume measures from other volume measures (full details of the rules for data extraction and estimation are available on request).
If measurements were reported for both an unrelated and a related comparison group, then the former measurements were used. Studies reporting results on a patient group in which the majority of patients had a diagnosis of schizophrenia but some patients had related diagnoses (e.g., schizoaffective disorder) were also included. Since we were interested in gender-related effects, studies that reported separate results for male and female subjects were entered as separate studies.
Structure measurements were excluded if 1) insufficient data were reported to extract the number of subjects in each group or the mean or the standard deviation of the structure volumes, 2) the structure measurement was an area (from a single slice) rather than a volume (i.e., from multiple slices), 3) the measurement was on less than the complete or near-complete volume for the whole brain or brain lobes, 4) there were fewer than six subjects in either the schizophrenia group or the comparison group, 5) the measurements contributed to another publication (in which case the publication with the largest group size for the structure was selected), or 6) the mean age in either the schizophrenia or the comparison group was greater than 40 years. Studies of early-onset schizophrenia were included.
A systematic search strategy was used to identify relevant studies. First, we carried out computer searches of the databases MEDLINE, PSYCHLIT, and EMBASE. We searched the databases for papers published in the years 1980–1998 using the following Medical Subject Heading categories: magnetic resonance imaging or MRI and schizophrenia. A manual search was also conducted of the titles of published papers in the following psychiatric journals for the period January 1998 to August 1998: The American Journal of Psychiatry, Archives of General Psychiatry, Biological Psychiatry, British Journal of Psychiatry, Psychiatric Research, Psychological Medicine, Schizophrenia Bulletin, and Schizophrenia Research. Finally, we searched the reference lists of the studies identified for inclusion.
Statistical Analysis
Meta-analyses were performed in Microsoft Excel 7.0 and meta-regression analyses in STATA 5.0 (Stata Corp., College Station, Tex.).
As a measure of effect size, we used the ratio of the mean volume in the schizophrenia group divided by the mean volume in the comparison group. We chose this measure of effect size because it is more readily interpretable, in this context, than effect size measures based on the difference in means divided by a standard deviation (e.g., Cohen’s d).
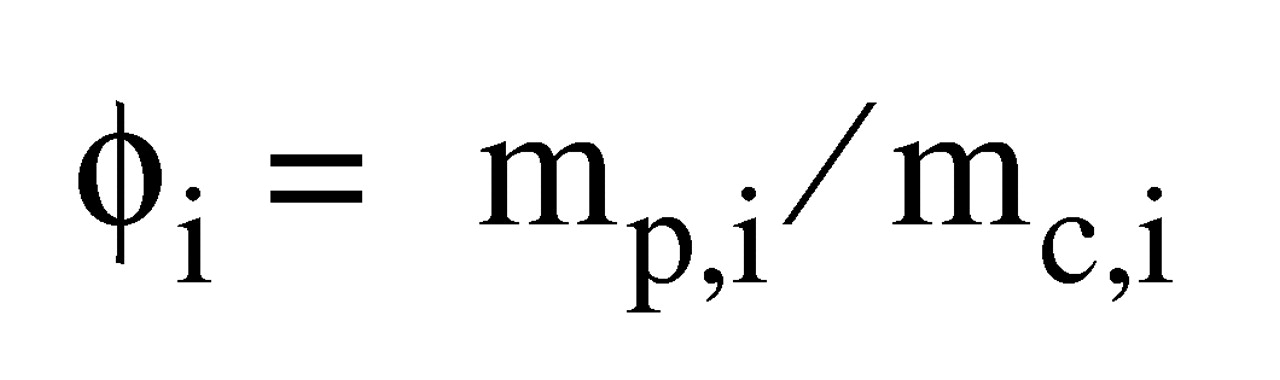
We carried out a meta-analysis of the volume ratios of all the measured structures in the subjects with schizophrenia and the comparison subjects (absolute effect sizes) using a random effects model
(7,
11). A random effects model assumes that the “true effect size” estimated by different studies differs between studies because of differences in samples or paradigms and that these true effect sizes have a normal distribution, i.e., that heterogeneity exists. In our analyses, we used the natural logarithms of brain ratios and converted the final results back to ratios. Thus, for a region R in study i (i=1, 2, 3,…k), we used the absolute effect size (ϕ
i) (where
p refers to the patient group,
c to the comparison group,
m to the group regional volume mean,
s to the group regional volume standard deviation,
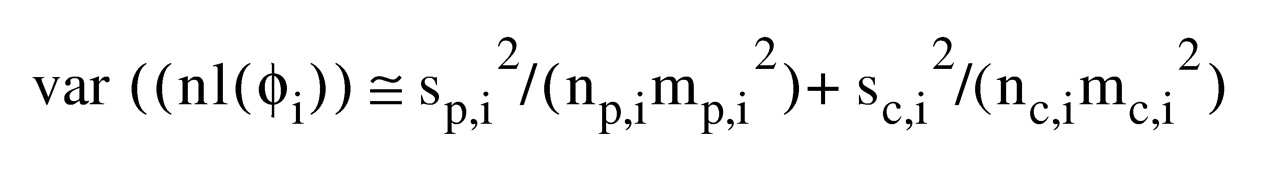
n to the group sample number, var to the variance, and nl to the natural logarithm):
The following equation assumes independence between m
p,i and m
c,i and applies the delta method
(12):
For each region, we calculated Q, a homogeneity test statistic
(7). In general, if Q exceeds the upper-tail critical value of chi-square on k–1 degrees of freedom, the observed variance in study effect sizes is significantly greater than expected under the null hypothesis that the two groups share a common population effect size. For comparison of our results with other meta-analyses, we also calculated an overall effect size using Cohen’s d for each region.
We also investigated whether regional volume differences exceeded global volume differences in the brain or ventricles (global-corrected effect sizes). For each region, we selected studies in which both regional data and global data (cerebral volume for cerebral regions and total ventricular volume for ventricular subdivisions) were available. We calculated the global-corrected effect size for a region as the overall effect size for the ratio of regional volume means (patient group volumes divided by comparison group volumes) divided by the overall effect size for the ratio of global volume means. Although we obtained point estimates for global-corrected effect sizes by this method, we were unable to calculate confidence intervals for these estimates because the covariances between regional and global volumes in each study were generally not reported. Thus for a region
R inside a global structure
G, the global-corrected effect size for R (ϕ
Rcorr) was calculated as:

Sources of Effect Size Heterogeneity
For regions on which there were 10 or more contributory studies (and therefore reasonable power to detect an effect), we investigated gender and MRI slice thickness as potential sources of heterogeneity in study findings. We regressed absolute effect sizes against the percentage of female subjects with schizophrenia in each primary study and the MRI slice thickness used to measure the region. We used random effects regression analysis (8) (analogous to the random effects meta-analysis) implemented in STATA and adopted a significance level of p<0.05.
Statistical Evidence for Potential Publication Bias
To investigate the possibility of publication bias in study findings, we used the Egger test (9) implemented in STATA to test for the presence of an excess of low-precision studies giving effect sizes of magnitude greater than the average. We used this technique to investigate the absolute effect sizes when there were five or more contributory studies (we used a lower study number threshold than for the previous analyses because we did not know whether publication bias would be more important when the number of published studies was small). We adopted a significance level of p<0.05.
RESULTS
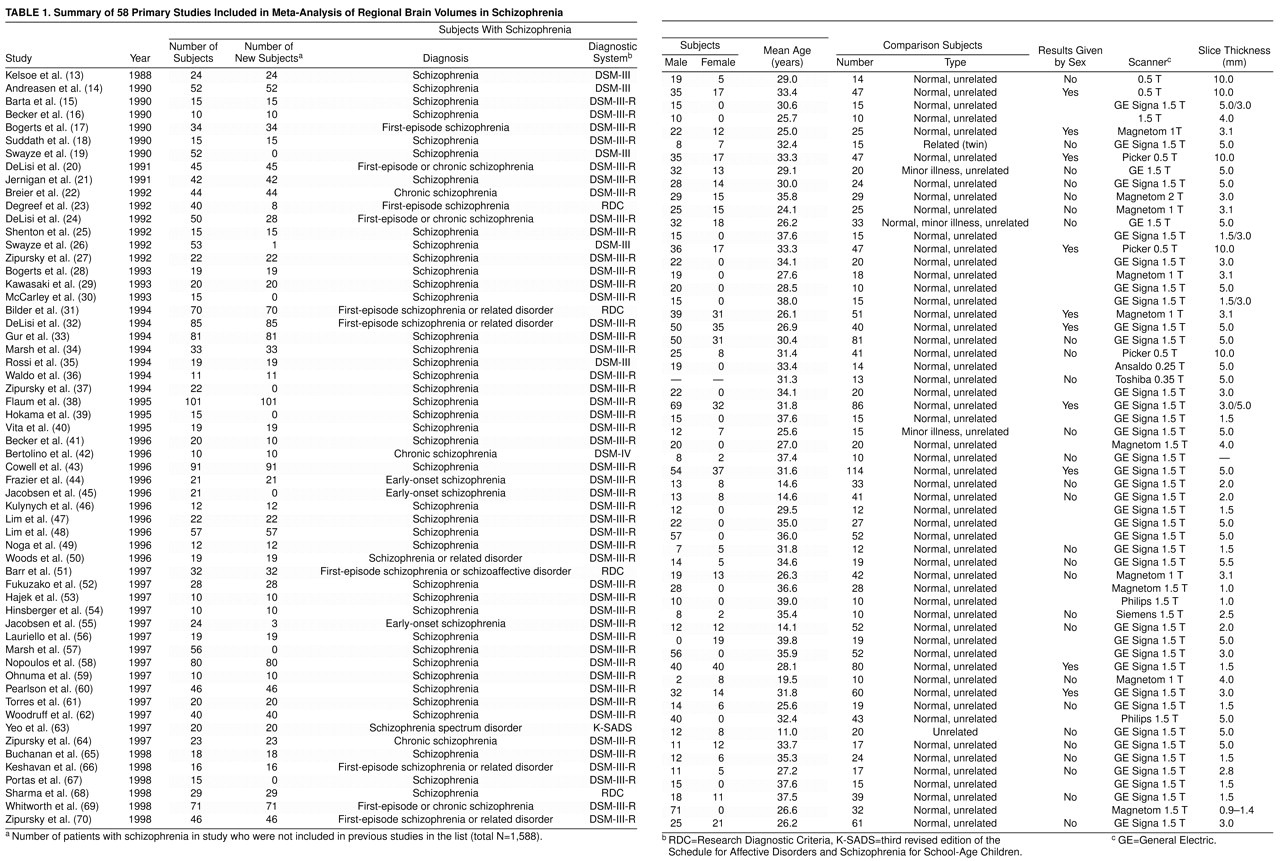
The articles identified for inclusion are given in
table 1; full details of the data are given in a Microsoft Excel 7.0 file, available from a Web site (http://www.iop.kcl.ac.uk/home/depts/psychmed/wright/) or on request.
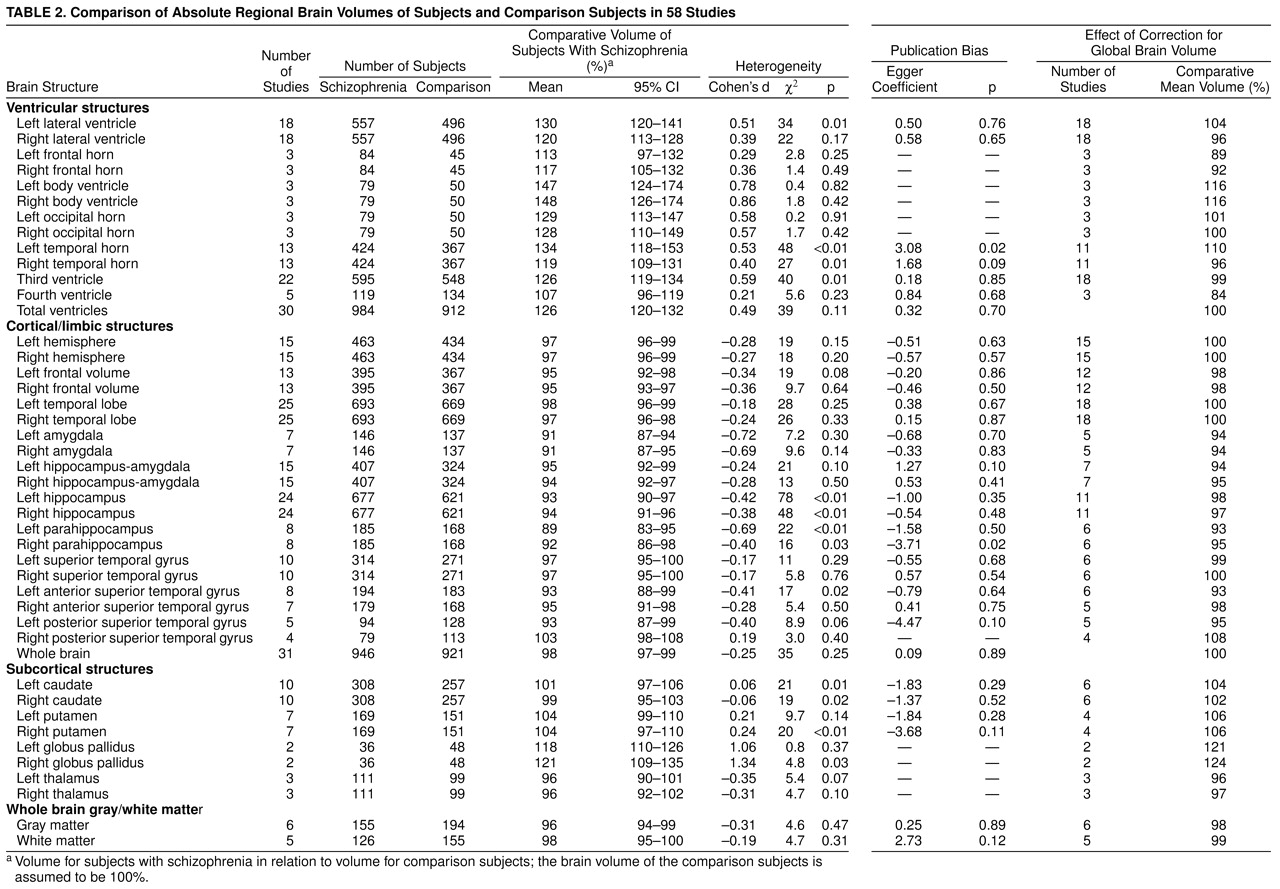
Absolute total ventricular volume was greater in the patients with schizophrenia than in the comparison subjects (assuming a comparison group volume of 100%, we found that the mean for patients with schizophrenia was 126% with a 95% confidence interval (CI) of 120%–132%). Absolute volumes of all ventricular subdivisions were also greater in patients with schizophrenia (
table 2).
Relative to the global difference in total ventricular volume, there was a slightly greater enlargement of the left lateral ventricle (104%) than the right lateral ventricle (96%). Some ventricular subdivisions showed increases greater than the global difference: the body of the left (116%) and right (116%) lateral ventricle and the left temporal horn (110%). The relative difference in third ventricular volume (99%) was approximately in line with the global difference, and the relative difference in the fourth ventricle was less than the total difference (84%). The frontal horns also showed lower increases relative to the global difference (left 89%, right 92%).
Absolute whole brain volume was lower in the patients than the comparison subjects (98%) (
table 2). Relative volumes of whole brain gray matter and white matter were approximately in line with the global difference: 98% for gray matter and 99% for white matter.
Relative to the global reduction of cerebral volume, there were no hemispheric differences (left 100%, right 100%). The frontal lobes were relatively small (left 98%, right 98%), but the temporal lobe volume differences were in line with the whole brain differences (left 100%, right 100%). Medial temporal lobe structures were relatively small: amygdala (left 94%; right 94%), hippocampus/amygdala (left 94%; right 95%), hippocampus (left 98%; right 97%), and parahippocampus (left 93%; right 95%). The left anterior superior temporal gyrus was also relatively small (93%).
The relative volumes of basal ganglia structures were higher in the subjects with schizophrenia: left caudate was 104%, right caudate was 102%, left putamen was 106%, right putamen was 106%, left globus pallidus was 121%, and right globus pallidus was 124%. Relative volumes of the thalamus were reduced: left thalamus was 96%, and right thalamus was 97%.
For the majority of structures, there was little evidence for a major gender effect modulating the volume differences in schizophrenia. Global ventricular enlargement was nonsignificantly greater in studies with a higher percentage of male patients (z=–1.93, N=30, p=0.05). We therefore calculated the absolute total ventricular volume difference in studies with only male patients or only female patients. In the 11 studies with only male patients, total ventricular volume was greater in the patients than in the comparison subjects by 130% (95% CI=118%–144%); in the five studies with only female patients it was greater by 116% (95% CI=105%–128%).
The only significant coefficients for regression of study effect size versus MRI slice thickness were for the left hemisphere (z=2.99, N=15, p=0.003), right hemisphere (z=3.27, N=15, p=0.001), and left temporal horn (z=1.99, N=13, p=0.05). Positive coefficients in the cases of the left and right hemispheres indicated that with more modern “thin-slice” MRI studies, a larger reduction in volume of these structures has been found in patients with schizophrenia than in comparison subjects; however, this finding depended on the outlying results of one study (49) and was not evident for cerebral volume (z=0.84, N=31, p=0.40). Therefore, it was likely to be due to chance. A positive coefficient in the case of the left temporal horn may indicate that older MRI studies using thicker slices overestimated the true difference in volume of this region in patients with schizophrenia and comparison subjects.
Table 2 lists the coefficient for the Egger publication bias test for each region. There were significant coefficients (in a direction indicating potential publication bias) at the p<0.05 level for the left temporal horn (t=2.61, df=11, p=0.02) and the right parahippocampus (t=–3.01, df=6, p=0.02). This indicated possible publication bias operating for these structures.
DISCUSSION
This meta-analysis demonstrates the enormous research effort that has been directed toward the investigation of structural brain changes in schizophrenia during the last decade. Some regions have been measured in almost 1,000 patients.
The results confirm the presence of global brain volume differences in schizophrenia: cerebral volume was lower (98%) and total ventricular volume was higher (126%) in patients with schizophrenia than in comparison subjects.
Relative to the global differences, the cerebral regions with the lowest volumes in the patients with schizophrenia were the left amygdala (overall mean global-corrected effect size=94%), right amygdala (94%), left hippocampus/amygdala (94%), right hippocampus/amygdala (95%), left parahippocampus (93%), right parahippocampus (95%), and left anterior superior temporal gyrus (93%). Intriguingly, the distribution of ventricular volume changes (maximal increases in the body of the lateral ventricle bilaterally) appeared to differ from the pattern of cerebral changes (maximal reductions in frontal and medial temporal regions bilaterally).
In this analysis, effect size was not significantly related to gender. The pattern of structural change in schizophrenia appears fairly similar in male and female patients and does not support a different pathological process in the two genders. For most regions there was little evidence that effect sizes were related to MRI slice thickness, providing reassurance that the pattern of regional volume changes detected has been independent of advances in MRI technology.
The findings also suggest several implications for the methodology of structural neuroimaging studies. Historically, the majority of neuroimaging studies have used relatively small samples to detect small effects (
table 1). It is therefore important that the results of all studies conducted be made available in a form that permits their combination. At increasing levels of complexity, this may be achieved by 1) publishing summary results in a form that permits meta-analysis with explicit cross-referencing or exclusion of overlapping studies, 2) registration of study results in an international electronic database with a cumulative meta-analysis
(71) of regional effect sizes, 3) provision of individual (anonymous) brain volume measurements for different regions to an electronic database—this would allow examination of effects such as laterality differences that are difficult to extract from summary statistics, 4) provision of the actual images to an electronic database—this would both facilitate the comparison of image analytic techniques and reduce “brain data wastage.”
Although the results of this meta-analysis indicated that regional volume reductions were present in the medial temporal lobes, there was also evidence for global volume changes in the ventricular system and cerebrum and for regional volume decreases in the left superior temporal gyrus, bilateral frontal lobes, and thalamus. These findings are consistent with a pathological process in schizophrenia involving distributed volume changes within the brain. However, studies employing region of interest measurements usually measure only a small number of selected brain regions because the measurement process is very labor-intensive;
table 2 shows that most brain regions have been measured in only a fraction of the 1,588 patients included in this meta-analysis. Furthermore, region of interest studies are limited in their treatment of neocortical morphology because of the inherent difficulties in defining structurally complex and variable regions of cortex. This may give a distorted picture of the pattern of brain changes. Automated “brain averaging”
(72,
73) or voxel-based methods
(74) provide a complementary technique for investigating the “broader gestalt of morphologic deviation”
(73). For example, these methods have indicated structural change in schizophrenia in the insula
(74), which is a region not easily measured by region of interest studies.
It is important to consider several potential limitations of this study. As with all meta-analyses, the results are dependent on the quality of the primary studies. In addition, various types of publication bias may arise during publication of the primary studies
(75). However, we did not detect evidence for publication bias for most brain regions, and we excluded duplicated results when there was evidence for previous publication. We did not test for laterality differences in brain volume measures because the statistical test requires extra information regarding the correlation between left and right regional volumes
(76), and these data were not generally provided by the original studies. Finally, we cannot exclude the possibility that some of these differences were caused by confounding factors rather than the pathology of schizophrenia (e.g., antipsychotic medication causing basal ganglia volume increases
[77]).
In summary, this meta-analysis demonstrated global structural differences between patients with schizophrenia and nonschizophrenic comparison subjects: cerebral volume was smaller and total ventricular volume was greater. Regional volume reductions in excess of these global differences were particularly marked in the bilateral medial temporal lobe regions. A general theory of the structural pathology of schizophrenia will need to explain both a complex pattern of cerebral changes and ventricular changes with a different spatial distribution. In the future, the collection of structural neuroimaging data in an electronic database may be valuable both in providing a powerful resource for testing hypotheses regarding the pathology of schizophrenia and in facilitating new structural analyses in large samples of patients and comparison subjects.