Sleep disturbances characterize depression and often precede the onset or recurrence of depression
(1–
3). Polysomnographic sleep measures such as increased sleep-onset latency, increased phasic REM sleep activity, increased fast-frequency EEG activity, and reduced EEG slow-wave activity during non-REM sleep corroborate subjective sleep complaints associated with depression
(3–
6). Circadian and neuroendocrine anomalies such as increased cortisol secretion and suppressed growth hormone secretion have also been observed in depressed patients during the period surrounding the transition from presleep wakefulness to non-REM sleep
(7–
9). These observations suggest that a close examination of brain changes occurring in the period surrounding the transition from presleep wakefulness to non-REM sleep in depressed patients may provide further insights into the neurobiological underpinnings of sleep disturbances in depression as well as into the neurobiology of depression. However, the functional neuroanatomical underpinnings of depression during non-REM sleep remain scarcely investigated.
Using [
18F]fluorodeoxyglucose (FDG) positron emission tomography (PET), Ho and colleagues showed that depressed patients had higher whole brain glucose metabolism than did healthy subjects during non-REM sleep
(10). They suggested that this finding supported the overarousal hypothesis of depression
(11). In addition, hypofrontality characterized depressed patients during non-REM sleep. Hypofrontality during wakefulness may prevent further reduction in cerebral activity from presleep wakefulness to non-REM sleep in depressed patients. In healthy subjects, there is a robust and significant reduction in cerebral activity in associative cortical areas during non-REM sleep relative to wakefulness
(12–
18). This reduction in cortical activity from wakefulness to non-REM sleep is thought to underlie the restoration of higher-order cognitive functions during sleep. In depression, a failure to further reduce cortical metabolic activity, especially in frontal areas, may underlie sleep anomalies and subjective complaints of nonrestorative sleep. However, changes in cerebral activity from wakefulness to non-REM sleep in depressed patients were not investigated by Ho and his colleagues.
Sleep disturbances in depression may also arise from abnormal functioning of regions involved in the generation and maintenance of non-REM sleep. During the transition from wakefulness to non-REM sleep, neuronal activity is reduced in regions promoting arousal such as the locus coeruleus, raphe nuclei, and tuberomammillary nucleus. Thalamocortical neurons become hyperpolarized from wakefulness to non-REM sleep
(19,
20). Sleep promoting areas have been localized in the preoptic hypothalamus and show increased activity during the transition from wakefulness to sleep
(21,
22). Neuroimaging studies of non-REM sleep in healthy subjects have yielded observations consistent with the aforementioned model of arousal and sleep regulation. Specifically, non-REM sleep is characterized by reduced metabolic activity and blood flow in the mesencephalic brainstem, thalamus, and basal forebrain relative to wakefulness
(12–
18). In depression, sleep disturbances may reflect abnormal activity in these structures.
The goal of the present study was to directly compare the pattern of metabolic changes between presleep wakefulness and non-REM sleep in patients with major depression and age- and sex-matched healthy subjects. On the basis of the aforementioned findings, we first hypothesized that depressed patients would exhibit less reduction in whole brain glucose metabolism from presleep wakefulness to non-REM sleep relative to healthy subjects. Second, we hypothesized that depressed patients would show a smaller reduction in regional cerebral glucose metabolism from presleep wakefulness to non-REM sleep in the brainstem, thalamus, and frontal lobes compared with healthy subjects.
Method
Participants
The University of Pittsburgh Institutional Review Board approved this study. After complete description of the study to eligible participants, written informed consent was obtained. Twelve depressed patients (10 women, two men; mean age=38.1 years, SD=12.6) and 13 age- and sex-matched healthy participants (10 women, three men; mean age=37.3, SD=11.5) participated in this study. Depressed participants met Research Diagnostic Criteria (RDC)
(23) for major depression as determined with the Structured Clinical Interview for DSM-III-R (SCID)
(24). All depressed patients had a minimum score of 15 on the Hamilton Depression Rating Scale
(25). Depressed participants were required to be free of medication for at least 2 weeks (8 weeks for fluoxetine) prior to the EEG sleep and PET studies. Nightly urine drug screenings confirmed that all participants were free of alcohol and recreational drugs during the study. Participants were excluded if they met RDC for schizophrenia, lifetime history of substance abuse or alcoholism, borderline or antisocial personality disorder, organic affective disorder, schizoaffective disorder, or a psychotic subtype of major depression or bipolar depression. Healthy participants were screened for psychiatric disorders with the SCID. None had current or past medical or psychiatric conditions known to affect sleep. Medical history, physical examinations, and laboratory tests were conducted on all subjects at entry into the study. Screening for sleep apnea was conducted on the first night, and any subject with an apnea/hypopnea index >10 was excluded from further study.
EEG Sleep Methods
EEG sleep studies were performed at the General Clinical Research Center of the University of Pittsburgh Medical Center. The EEG sleep montage consisted of a C4/A1-A2 EEG channel, bilateral electro-oculograms, and electromyogram (bipolar submental leads). EEG sleep or wakefulness was monitored on all nights, and during the waking uptake period. Data from the second night were used as baseline EEG sleep data. Other procedures for EEG sleep recording and monitoring and definitions for visually scored sleep variables have been provided elsewhere
(17,
26).
PET Scans
Regional cerebral glucose metabolism was assessed during presleep wakefulness and during the first non-REM sleep period using the FDG PET method
(27). For each PET study, a 4–5-mCi dose of FDG was injected. To characterize more accurately absolute and relative changes in glucose metabolism during presleep wakefulness and non-REM sleep, the FDG injection for the presleep PET scan was conducted at each participant’s usual bedtime, as determined by sleep diaries. For the non-REM sleep scan, FDG was injected within 5 to 7 minutes after the appearance of the first sleep spindles. Scan order was randomized on nights 3 and 5. The fourth night was used as a recovery night for the slight sleep deprivation entailed by the PET study procedures. Participants were monitored via polysomnography to verify that wakefulness or non-REM sleep was maintained during both FDG uptake periods. Participants were left undisturbed for a 20-minute period following injection of the radioisotope. Twenty minutes after injection, subjects were awakened, transported via wheelchair, and positioned in the PET scanner for six sequential 5-minute emission scans beginning 60 minutes after the injection of the FDG. This was followed by a 15-minute rod-windowed transmission scan. The use of a low-dose of FDG as well as the use of rod-windowing to reduce contamination of the transmission scan from activity in the patient allowed us to perform the transmission scan after the emission scan so as to minimally disrupt the experimental condition up to the emission scanning.
Statistical Analysis
All statistical analyses were conducted using the Statistical Parametric Mapping program, 1999 version (SPM 99)
(27,
28). Following co-registration and spatial normalization of the PET data into Talairach space, the PET data were smoothed (10×10×10 mm)
(25,
26). Calculation of whole brain semiquantitative cerebral glucose metabolism was conducted according to standard methods described elsewhere
(17,
26,
29,
30). Patterns of relative reductions in regional cerebral glucose metabolism from presleep wakefulness to non-REM sleep were first examined for each study group separately. In order to control for between-subject variations in whole brain metabolism, global metabolism was entered as a covariate in subsequent analyses. The group (healthy versus depressed)-by-state (presleep wakefulness versus non-REM sleep) interaction was then investigated to further identify areas where depressed patients exhibited less of a decline in regional cerebral glucose metabolism from presleep wakefulness to non-REM sleep relative to healthy subjects. Post hoc contrast analyses were conducted to assess group differences within each state. Statistical images (t scores converted to z scores) were created for each analysis. Local statistical maxima in these images were identified by their Talairach coordinates
(31). Anatomic localization of the regions of significance was aided by superimposing statistical images onto each participant’s magnetic resonance image. The latter was normalized into the same Talairach coordinates as part of the aforementioned spatial normalization procedure. On the basis of previous work regarding the functional subcortical neuroanatomical correlates of non-REM sleep
(14,
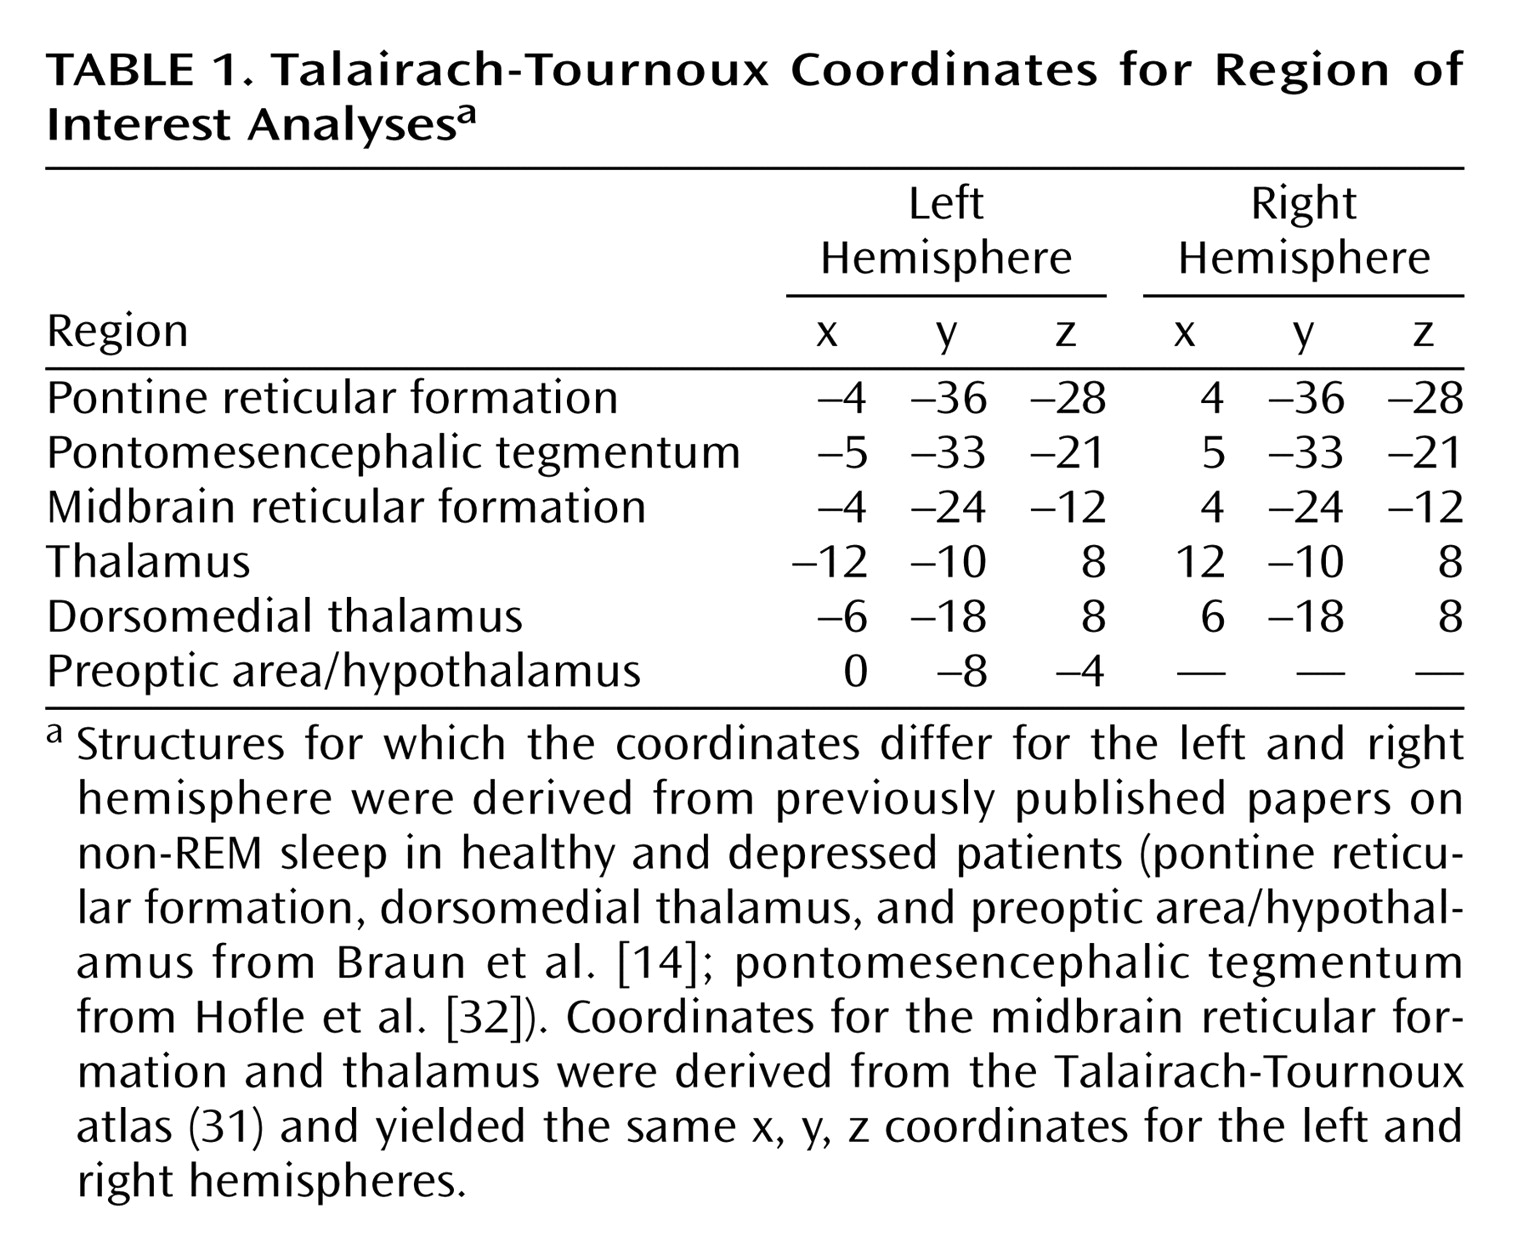
32), region of interest analyses with small volume corrections (5 mm radius) were used for all analyses (
Table 1). Specifically, coordinates were identified for subcortical areas involved in arousal regulation (pontine and mesencephalic tegmentum, thalamus, basal forebrain, and hypothalamus). Because these regions of interest reflect a priori determined volumes that are much smaller than the whole brain, region of interest analyses limit the statistical comparisons, and thus, require less stringent statistical corrections for multiple comparisons. For all statistical analyses, the significance threshold at the cluster level was set at 0.05 after correction for multiple comparisons.
Results
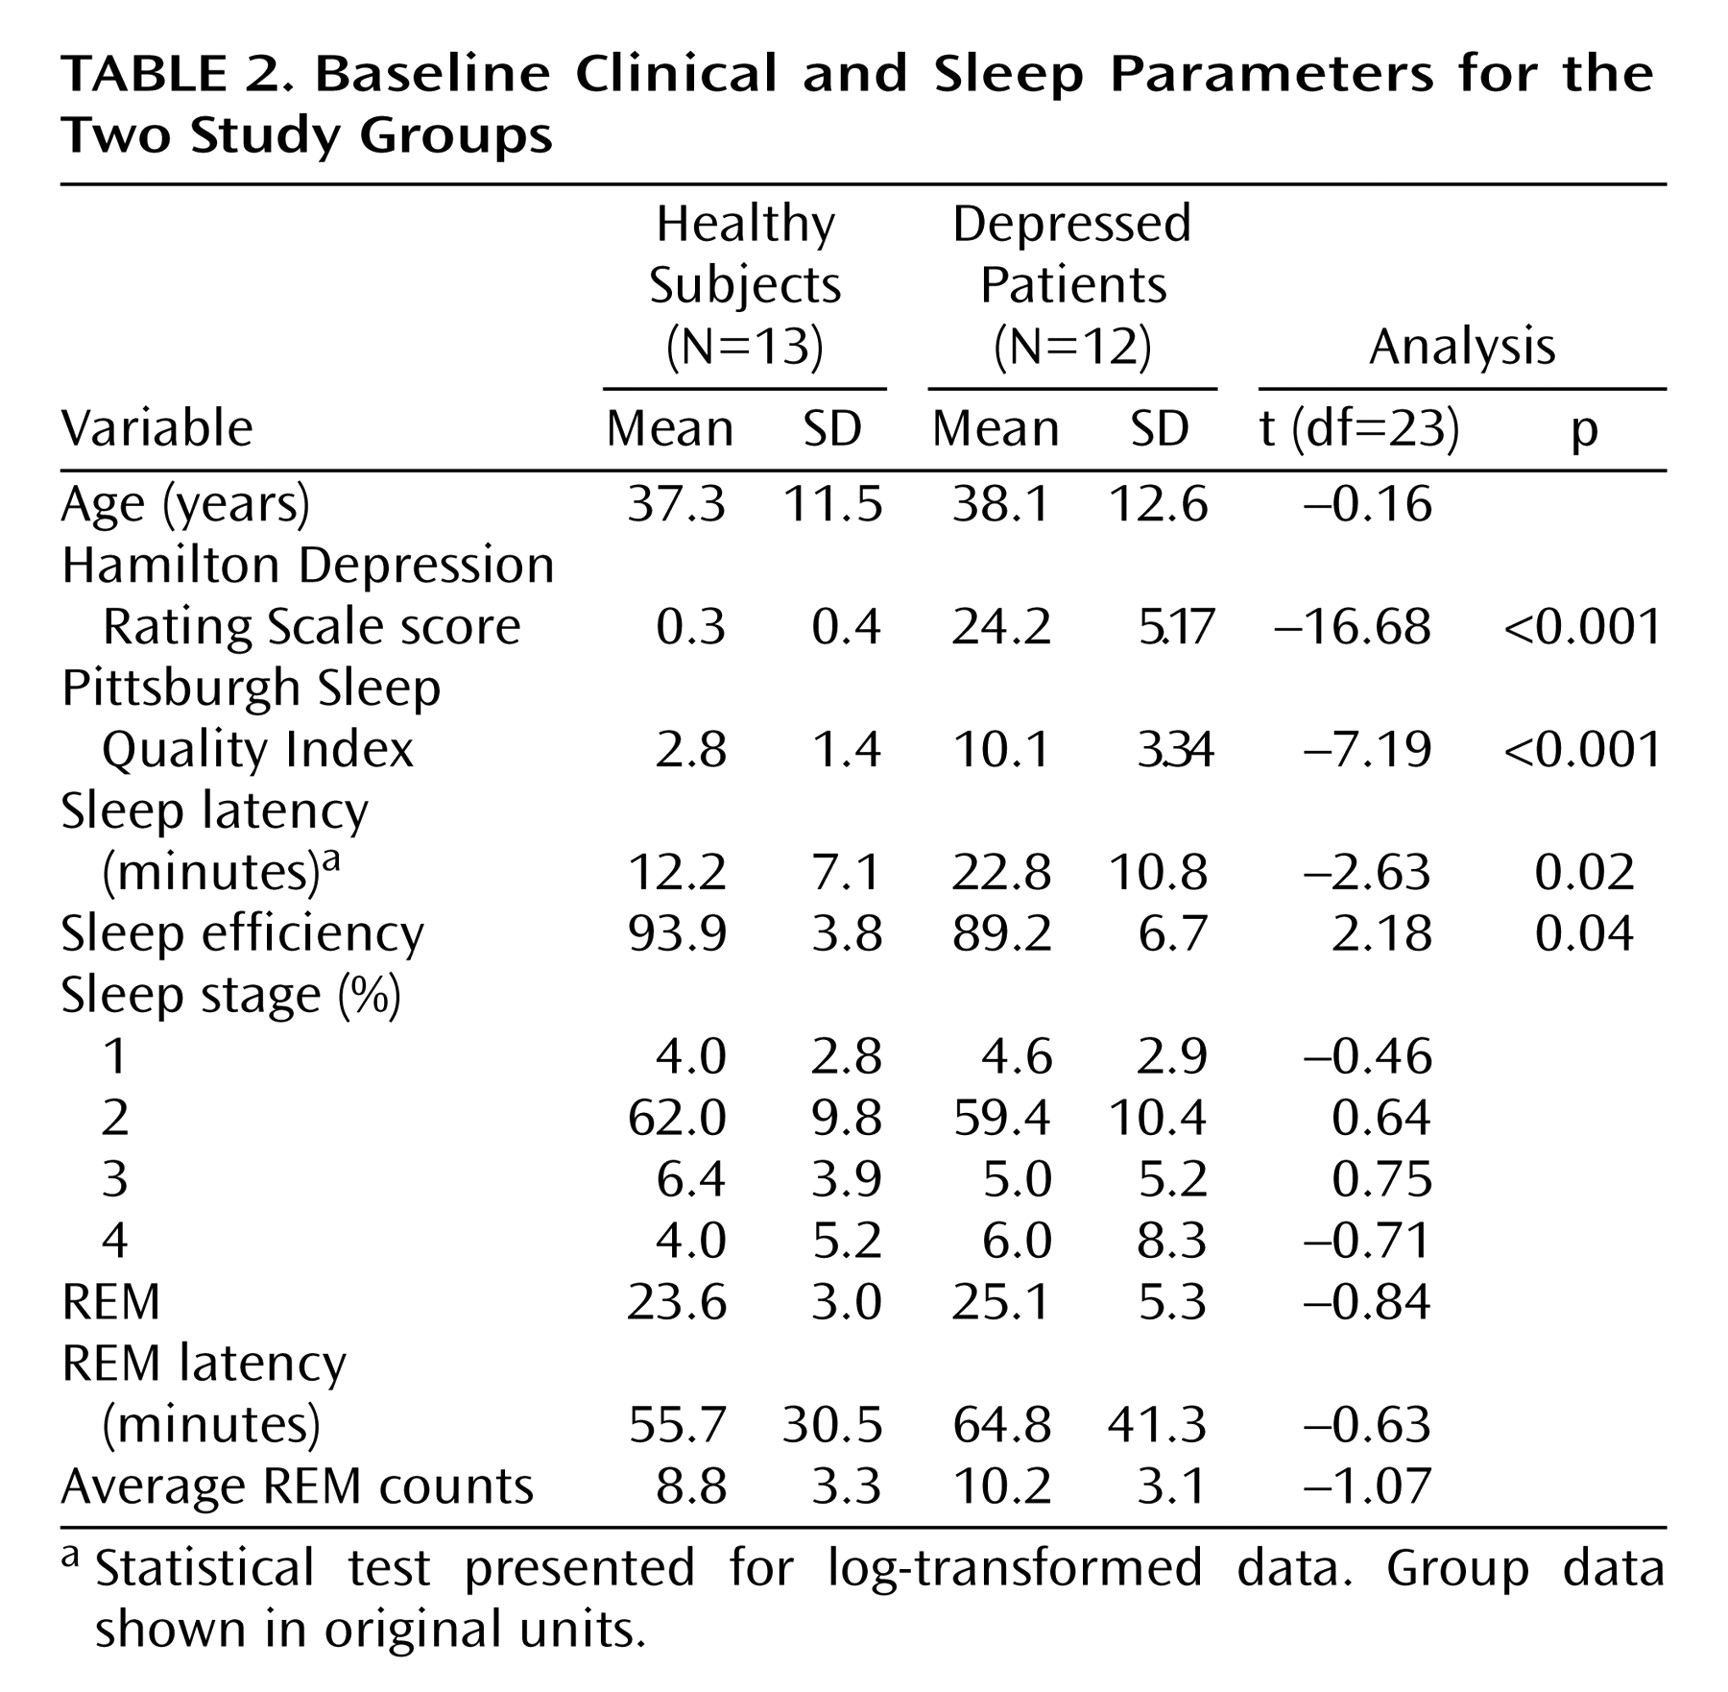
Clinical and sleep parameters for the two study groups are presented in
Table 2. All participants spent more than 80% of the non-REM uptake period in non-REM sleep. The remaining period of the uptake period was composed of epochs of wakefulness. The mean number of epochs of wakefulness during the non-REM uptake period did not differ between healthy subjects (mean=0.44 minutes, SD=0.61) and depressed patients (mean=0.64 minutes, SD=1.12). There were no REM sleep epochs during the non-REM uptake period. All participants maintained wakefulness for 100% of the presleep uptake period.
Absolute Whole Brain Glucose Metabolism
Complete blood data for semiquantitative computations of whole brain glucose metabolism were available for eight of the 12 healthy subjects and nine of the 13 depressed patients. Blood sampling problems prevented obtaining complete blood draw data for the remaining subjects. A two-by-two (group [healthy versus depressed]-by-time [presleep versus non-REM sleep]) analysis of variance did not reveal a significant group-by-time interaction difference from presleep wakefulness to non-REM sleep between the two groups (F=0.35, df=1, 15, p=0.56). There was no significant main effect of group (F=1.61, df=1, 15, p=0.24) or time (F=1.23, df=1, 15, p=0.28).
Relative Regional Metabolic Changes From Presleep to Non-REM Sleep
Healthy subjects
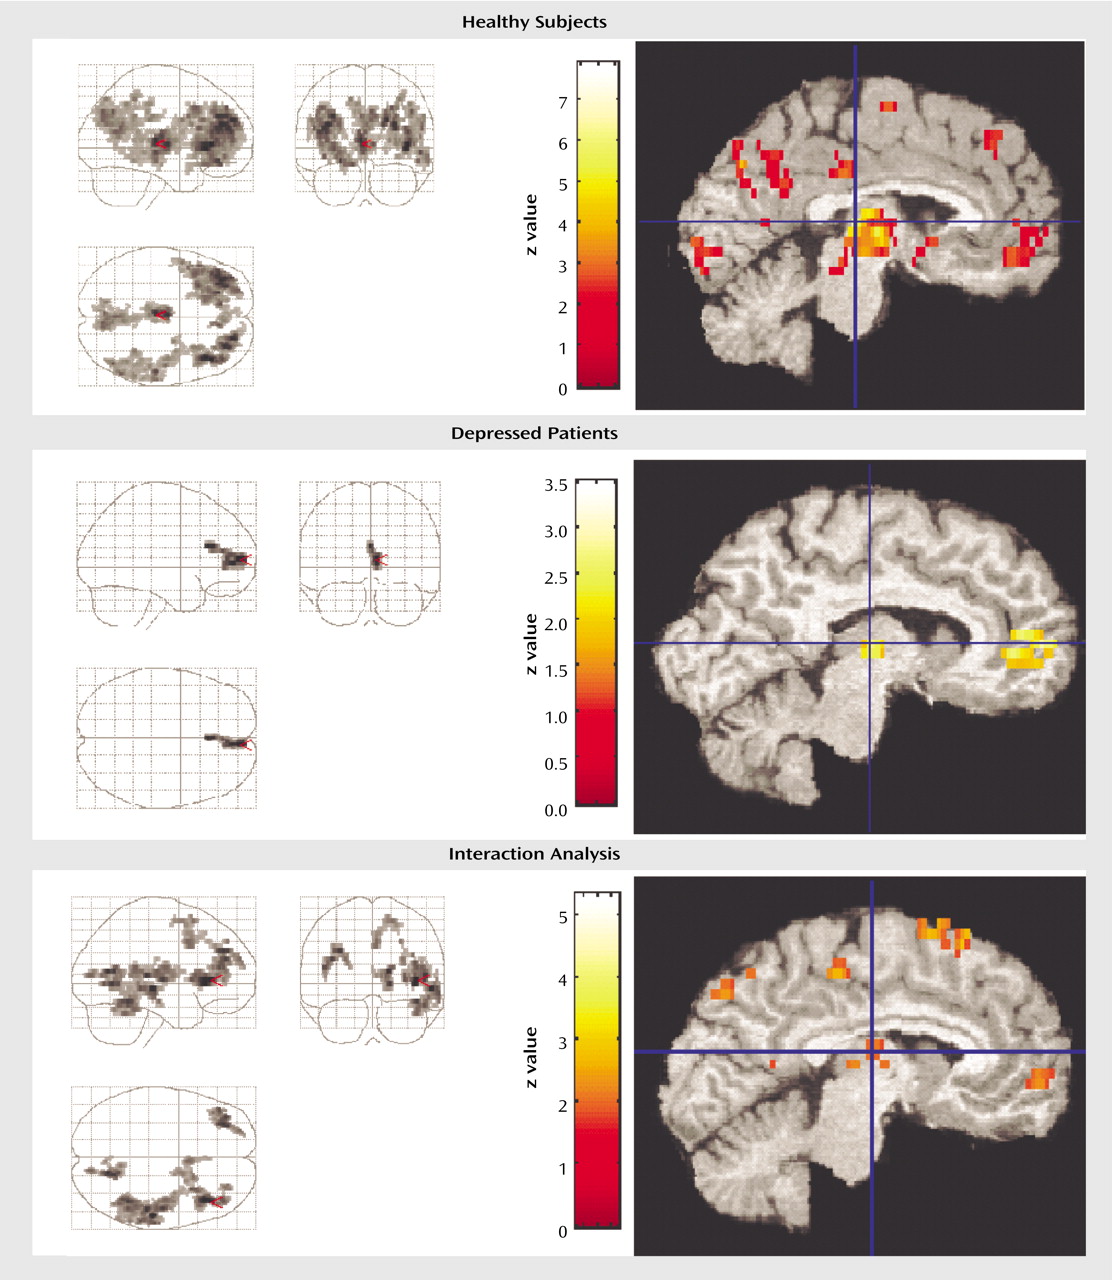
Comparing presleep wakefulness to non-REM sleep, healthy subjects showed reduced relative regional cerebral glucose metabolism in five areas (
Figure 1). The number of contiguous pixels that composed areas of significance, Talairach atlas coordinates for voxels of maximal significance for each of the five regions, and z scores are presented in
Table 3. These areas included the bilateral frontal cortex, the right parietal and temporal cortices, left thalamus, posterior hypothalamus, and rostral midbrain tegmentum including the periaqueductal gray, and red nucleus.
Region of interest analyses confirmed a relative reduction in regional cerebral glucose metabolism from presleep to non-REM sleep in healthy subjects in the right thalamus (
Figure 1) (x=10, y=–18, z=8) (z=4.65, p=0.001) and left thalamus (x=–2, y=–22, z=8) (z=4.20, p=0.001). None of the other regions of interest showed significant reduction in regional cerebral glucose metabolism in non-REM sleep relative to presleep.
Depressed patients
In depressed patients, a small area comprising 169 contiguous pixels showed a significant reduction in relative regional cerebral glucose metabolism from presleep to non-REM sleep (
Figure 1). This area was limited to the right frontal gyrus and included a small area of the dorsal cingulate cortex (Brodmann’s area=10, 32).
As seen in
Figure 1, region of interest analyses indicated a significant reduction in regional cerebral glucose metabolism in the midline dorsomedial thalamus (voxel of maximum significance: x=8, y=–16, z=8) (z=2.43, p=0.04) from presleep wakefulness to non-REM sleep.
Between-group comparison of metabolic change
In order to determine if relative reductions in regional cerebral glucose metabolism from presleep to non-REM sleep significantly differed between depressed patients and healthy subjects, an SPM contrast was performed. This contrast permitted the identification of structures and regions where there was less of a decline in regional cerebral glucose metabolism in presleep versus non-REM sleep in depressed patients relative to healthy subjects. Five areas demonstrated significant differences (
Figure 1 and
Table 4). These areas included the left and right lateral and medial frontal cortex and the right temporal, parietal, and occipital cortices.
Figure 1 demonstrates that the reduction in glucose metabolism observed in frontal regions from wakefulness to non-REM sleep is substantially less extensive in depressed patients than in healthy subjects.
Region of interest analyses indicated that regional cerebral glucose metabolism showed less reduction from presleep wakefulness to non-REM sleep in depressed patients relative to healthy subjects in the left dorsomedial thalamic region (x=–2, y=–14, z=4) (z=2.98, p=0.007) (
Figure 1). None of the other regions of interest showed significant interactions.
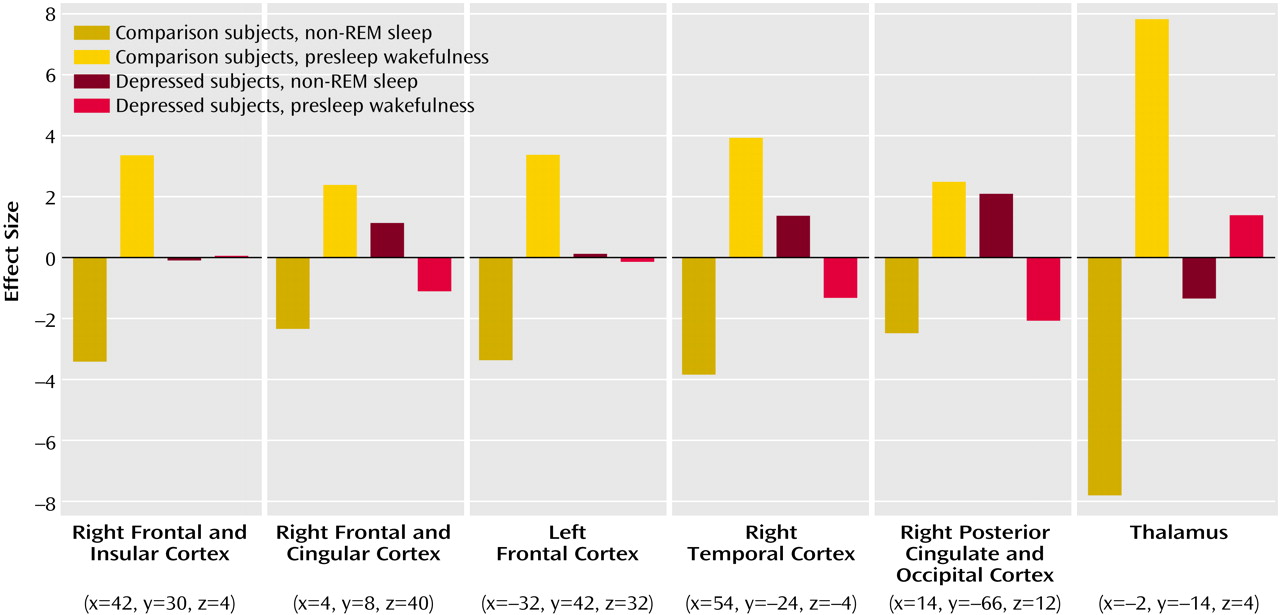
Figure 2 illustrates the mean-corrected parameter estimates of metabolic reduction differences from presleep to non-REM sleep between healthy subjects and depressed patients.
Post Hoc Group Differences in Presleep Wakefulness and Non-REM Sleep
Post hoc analyses indicate that depressed patients showed lower regional cerebral glucose metabolism in left and right frontal areas during both presleep wakefulness and non-REM sleep relative to healthy subjects. During presleep wakefulness, depressed patients showed lower bilateral regional cerebral glucose metabolism in an area composed of 935 contiguous pixels (Talairach coordinates for voxel of maximum significance: x=–6, y=–4, z=56) (z=2.96, p=0.03). This area included the dorsal portion of the anterior cingulate cortex and extended anteriorly into the medial frontal cortex and dorsally into the middle and superior frontal gyri. During non-REM sleep, depressed patients showed lower regional cerebral glucose metabolism than healthy subjects in an area homologous to that observed during presleep wakefulness. This area was composed of 873 contiguous pixels (voxel of maximum significance: x=–6, y=–2, z=56) (z=3.66, p=0.04) and included the midline dorsal anterior cingulate and dorsolateral frontal cortex, including the precentral gyrus.
Discussion
To our knowledge, this is the first study to investigate the patterns of regional cerebral glucose metabolism differences between presleep wakefulness and non-REM sleep in depressed patients and a matched group of healthy subjects. Although there was no significant reduction in whole brain regional cerebral glucose metabolism between presleep wakefulness and non-REM sleep across groups, patterns of relative deactivation between presleep wakefulness and non-REM sleep differed. Depressed patients showed a smaller reduction of relative regional cerebral glucose metabolism between presleep wakefulness and non-REM sleep in frontal regions. This is consistent with the notion that hypofrontality, which characterizes depression during wakefulness, persists during non-REM sleep. Depressed patients also showed less reduction in relative regional cerebral glucose metabolism from presleep wakefulness to non-REM sleep in parietal and temporal regions and the dorsomedial thalamus compared with healthy subjects. These findings suggest that depression is characterized by a smaller cortical and thalamic deactivation from presleep wakefulness to non-REM sleep. This blunted change in regional cerebral glucose metabolism between presleep wakefulness and non-REM sleep may underlie sleep anomalies and subjective complaints of nonrestorative sleep associated with depression.
Whole Brain Metabolism
We did not observe a decline in whole brain glucose metabolism from presleep waking to early non-REM sleep as might be expected from other studies
(12–
18). This lack of difference may be due to the small difference in circadian time between the two scanning sessions. Prior studies have shown that global glucose metabolism declines from morning to evening waking (unpublished study of D.J. Buysse et al.) and from presleep to postsleep waking
(14).
Contrary to Ho and colleagues
(10), depressed patients did not exhibit greater whole brain glucose metabolism relative to healthy subjects during non-REM sleep. The source of discrepancy between the present and previous findings is unclear. The subjects of Ho et al. were all men who were somewhat younger than the participants in the present study, who were mostly women. It is possible that gender and age characteristics of the respective samples may have influenced the findings
(33). A difference in the amount of waking during the non-REM FDG uptake periods across the two studies may also explain this difference.
Relative Regional Cerebral Glucose Metabolism
In healthy subjects, the pattern of decline in relative regional cerebral glucose metabolism from presleep wakefulness to non-REM sleep is consistent with prior studies of blood flow and metabolic activity
(12–
18). This deactivation pattern is also consistent with the notion that relative deactivation in these areas reflects attenuation activity of structures and regions involved in the maintenance of wakefulness
(34) and restoration of heteromodal associative cortices
(17).
Between presleep wakefulness and non-REM sleep, the difference in regional cerebral glucose metabolism observed in depressed patients was not as extensive as the one seen in healthy subjects and was limited to a small region of the midline prefrontal cortex. The interaction analysis confirmed that depressed patients showed less decrease in regional cerebral glucose metabolism from presleep wakefulness to non-REM in the left and right dorsolateral frontal gyri, right medial prefrontal cortex, and dorsal anterior cingulate compared with healthy subjects. Post hoc analyses indicated that relative to healthy subjects, depressed patients showed lower relative regional cerebral glucose metabolism during presleep wakefulness, which most likely prevents further reduction in glucose metabolism during the transition into non-REM sleep. These observations indicate that frontal anomalies characteristic of depression during wakefulness
(35,
36) persist across behavioral states.
The finding that depressed patients showed less deactivation of the dorsomedial thalamus from presleep wakefulness to non-REM sleep than did healthy subjects also supports the overarousal hypothesis
(11). Post hoc analyses revealed that although regional cerebral glucose metabolism in the thalamus and anterior hypothalamus did not differ between depressed patients and healthy subjects during presleep wakefulness, depressed patients failed to show deactivation of the thalamus and anterior basal forebrain during non-REM sleep. Maintenance of metabolic activity in the dorsomedial thalamus, an associative area that projects to both the prefrontal and parietal cortices
(37) across states may underlie the apparent maintenance of frontal and parietal metabolic activity in non-REM sleep also observed in depressed patients compared with healthy subjects.
Conclusions
The present findings suggest that abnormal thalamocortical network function in depression may underlie sleep anomalies and subjective sleep complaints. These results raise the possibility that insomnia complaints more generally may arise from abnormal deactivation of frontal and thalamic areas from presleep wakefulness to non-REM sleep. Further studies are required to determine whether metabolic alterations in frontal and thalamic regions from presleep wakefulness to non-REM sleep constitute a risk marker for depression onset or recurrence and a biomarker of treatment response in depressed patients.


