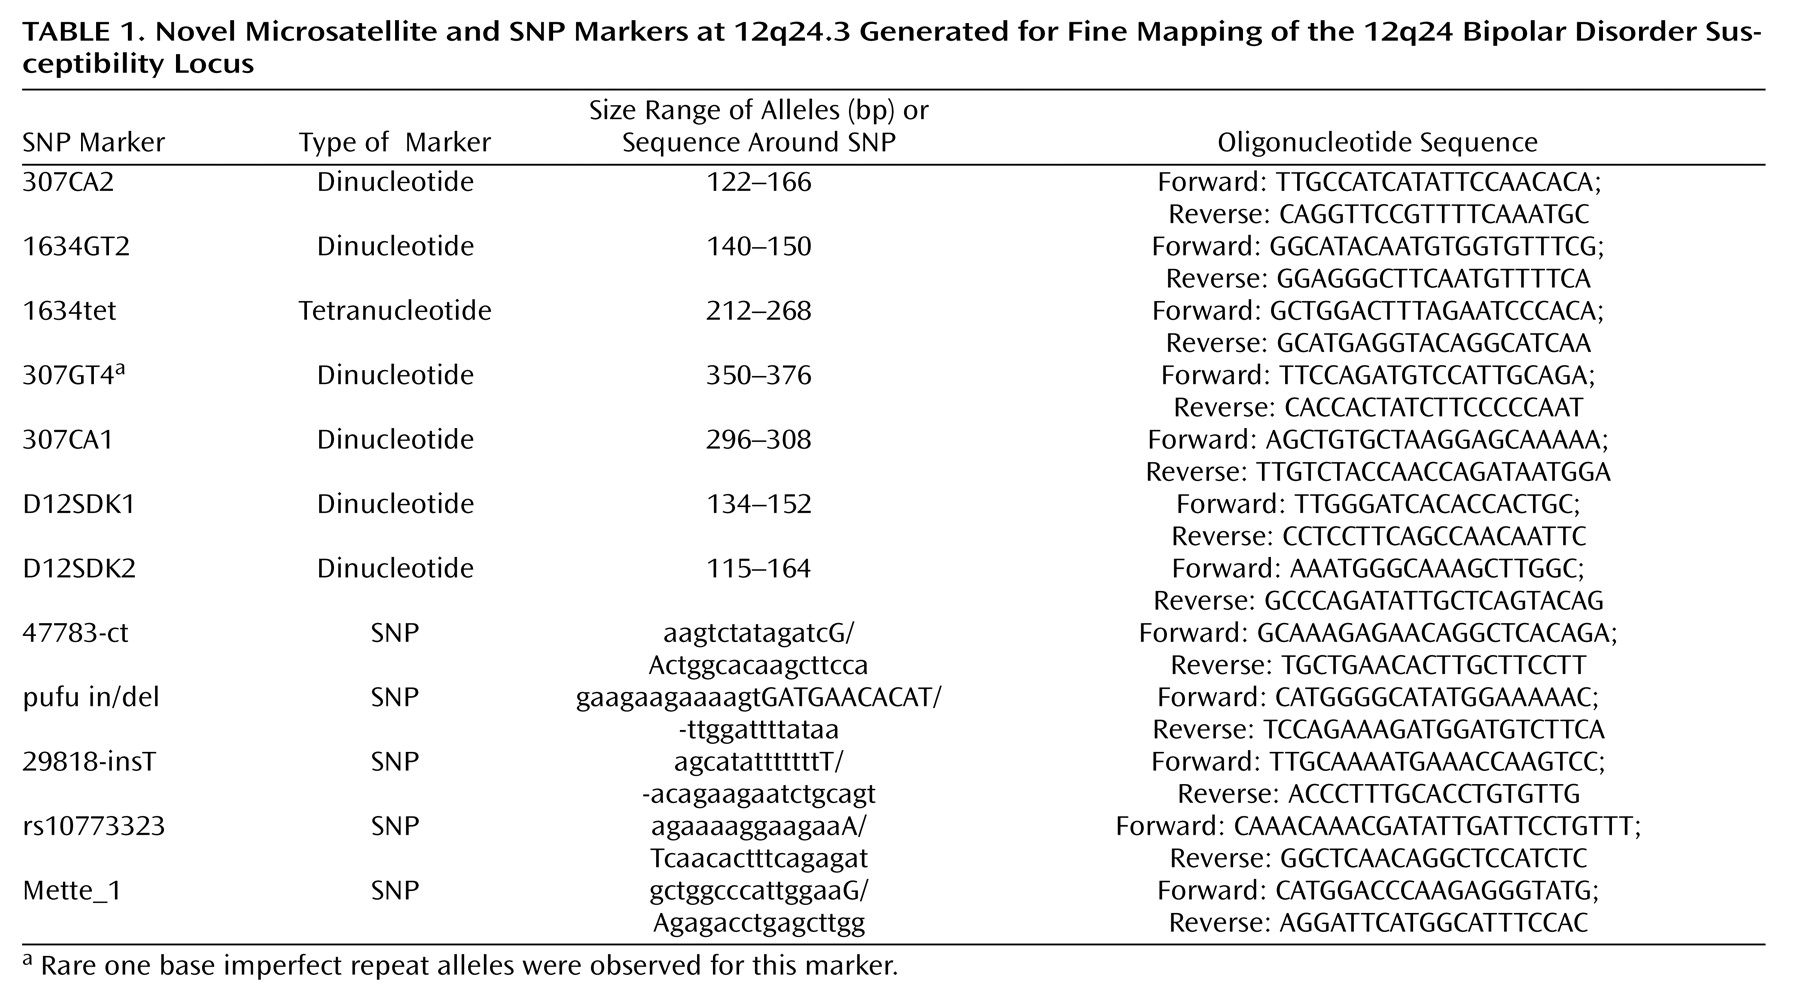
Evidence for allelic association was first found in the cohort from Denmark, and this was used to test for association in the larger U.K. cohort. The following 31 novel and published microsatellite and SNP markers were genotyped: D12S1614, D12S342, AFMb332ZC1, D12S340, D12S1639, D12S324, D12S866, D12S386, 1634GT2, AFMb337ZD5, 1634tet, D12S1634, rs2292446, rs4765108, 307GT4, D12S307, rs7133178, pufu in/del, 47783-ct, Mette_1, rs1212337, rs10773323, rs1194031, 29818-insT, 307CA1, 307CA2, D12SDK2, D12SDK1, D12S1658, GATA41E12, and D12S2075. Primer sequences for the established microsatellite markers are available from the Genome database, and the sequence surrounding the published SNPs is available from the SNP database. We identified and genotyped the following new microsatellite and SNP markers: 1634GT2, 1634tet, 307GT4, pufu in/del, 47783-ct, Mette_1, rs10773323, 29818-insT, 307CA1, 307CA2, D12SDK2, and D12SDK1. The primer sequences for the new microsatellite markers or the sequence surrounding SNPs are shown in
Table 1 as well as their positions on 12q24. All the SNPs and microsatellite markers were found to be in Hardy-Weinberg equilibrium in both the U.K. and Danish bipolar and comparison groups. The empirical levels of significance derived from the CLUMP analysis for microsatellite markers or allelic chi-square tests for SNPs are shown in
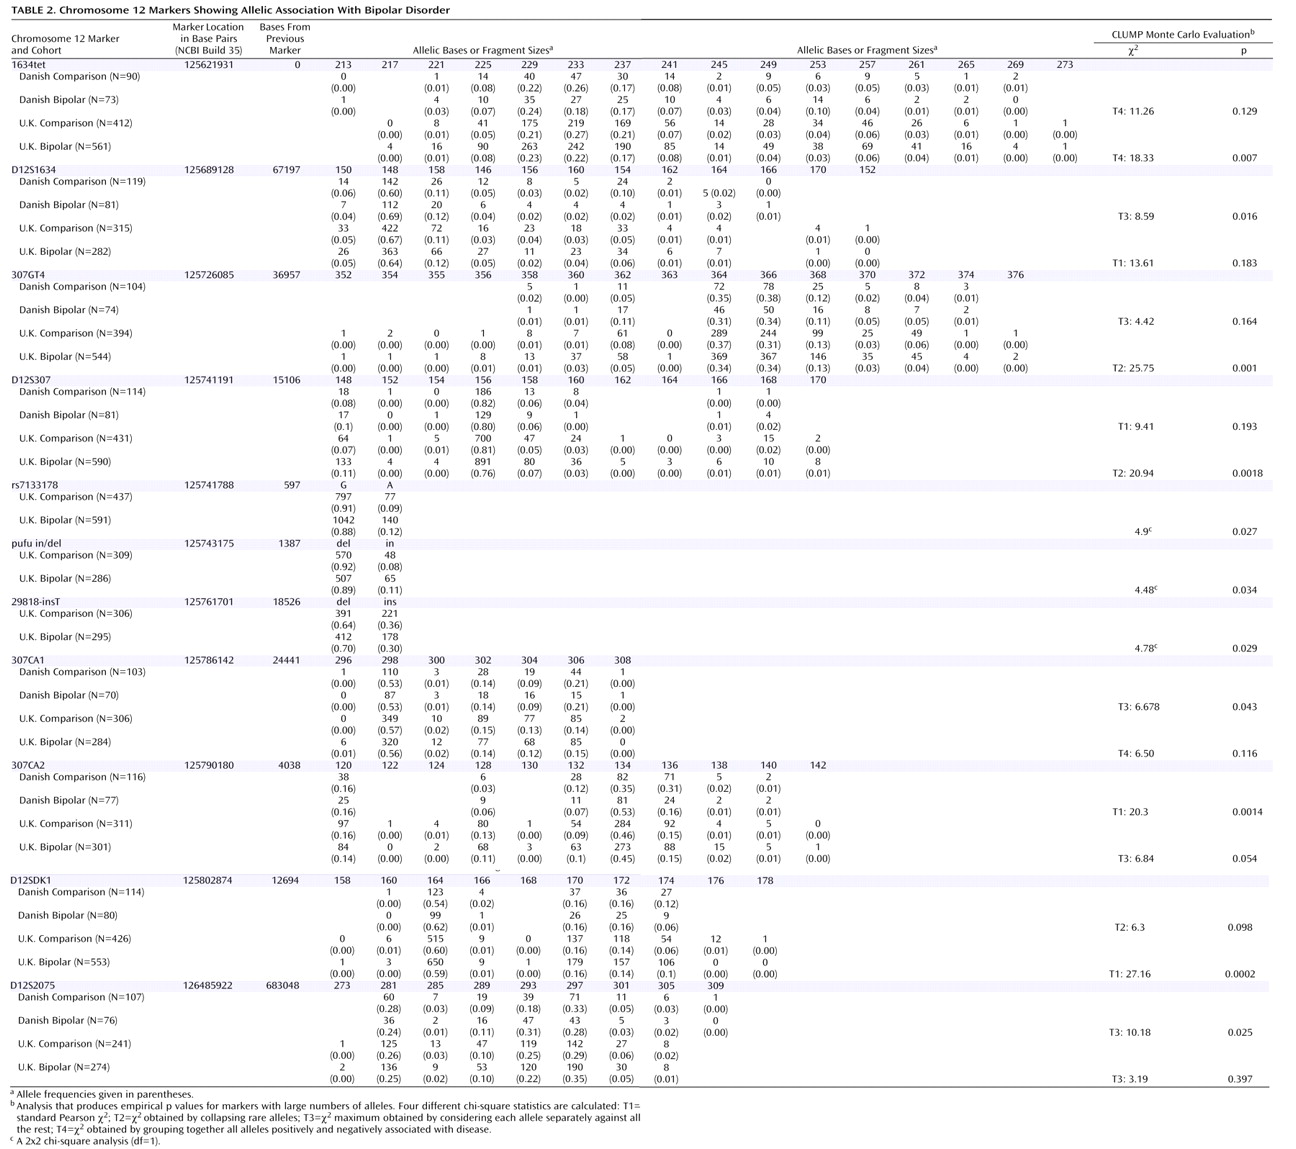
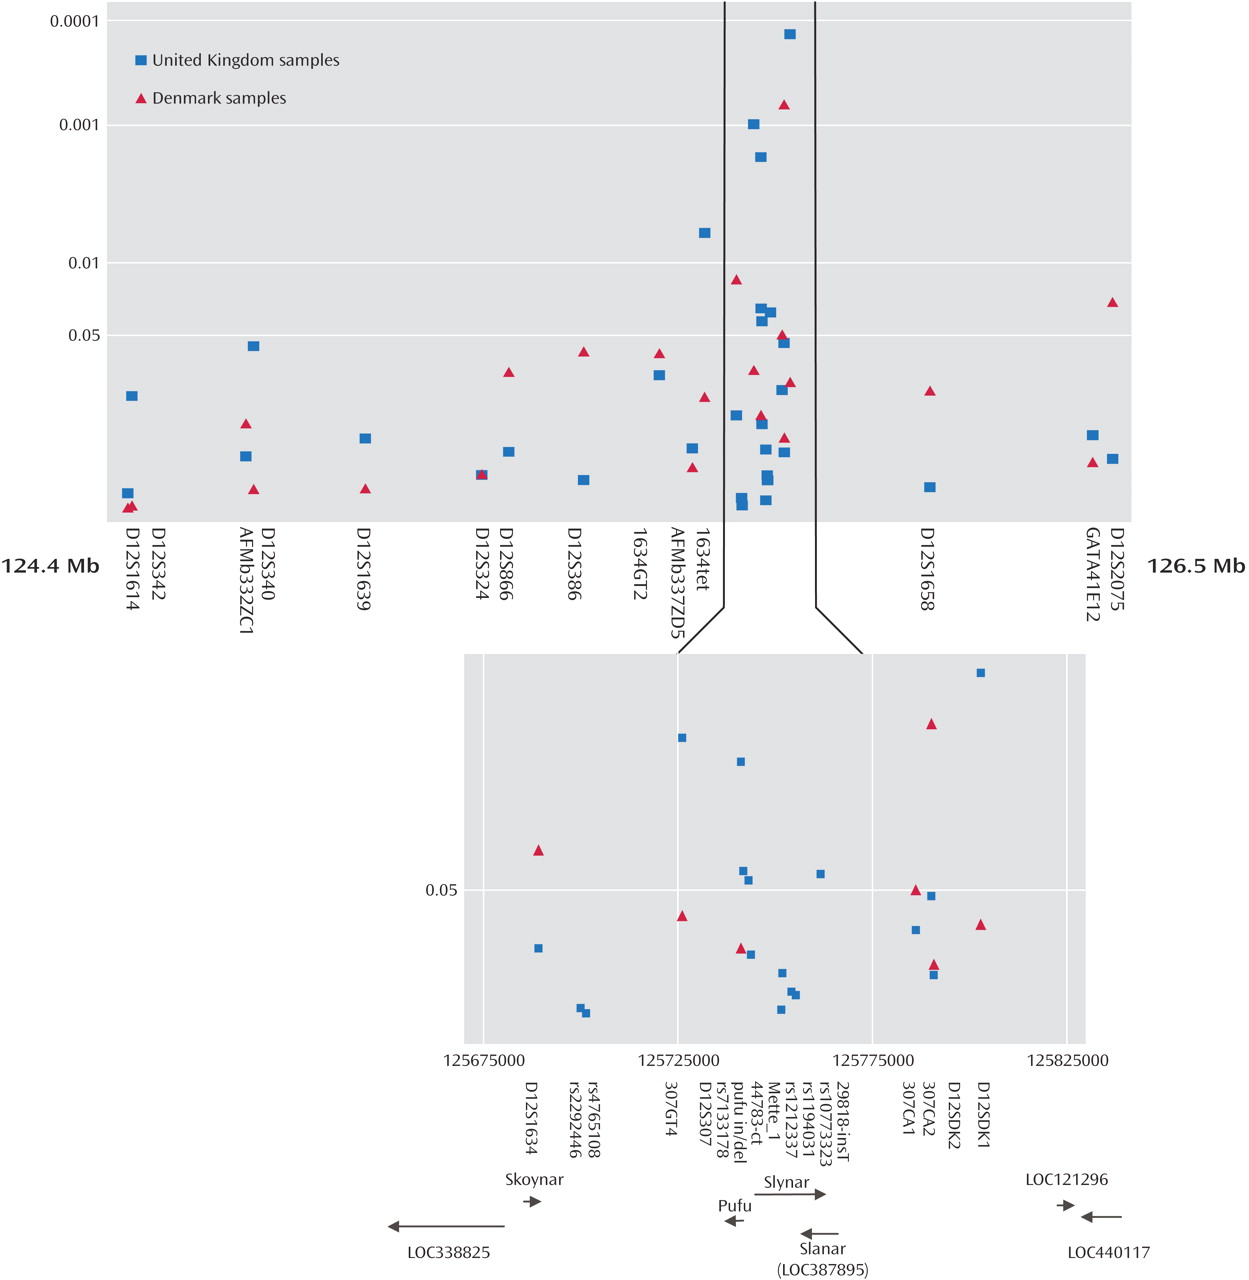
Table 2 and graphically in
Figure 1 . The location of these markers, the interval between markers, the number of alleles observed and the number of individuals genotyped are also shown in
Table 2 . Four markers originally produced significant p values in the Danish sample: D12S1634, 307CA1, 307CA2, and D12S2075. Exactly the same region that was implicated in the Danish cohort was then tested in the U.K. cohort, and seven markers produced significant p values that did not need further correction for the presence of multiple alleles. These were 1634tet, 307GT4, D12S307, rs7133178, pufu in/del, 29818-insT, and D12SDK1 (
Table 2 ).
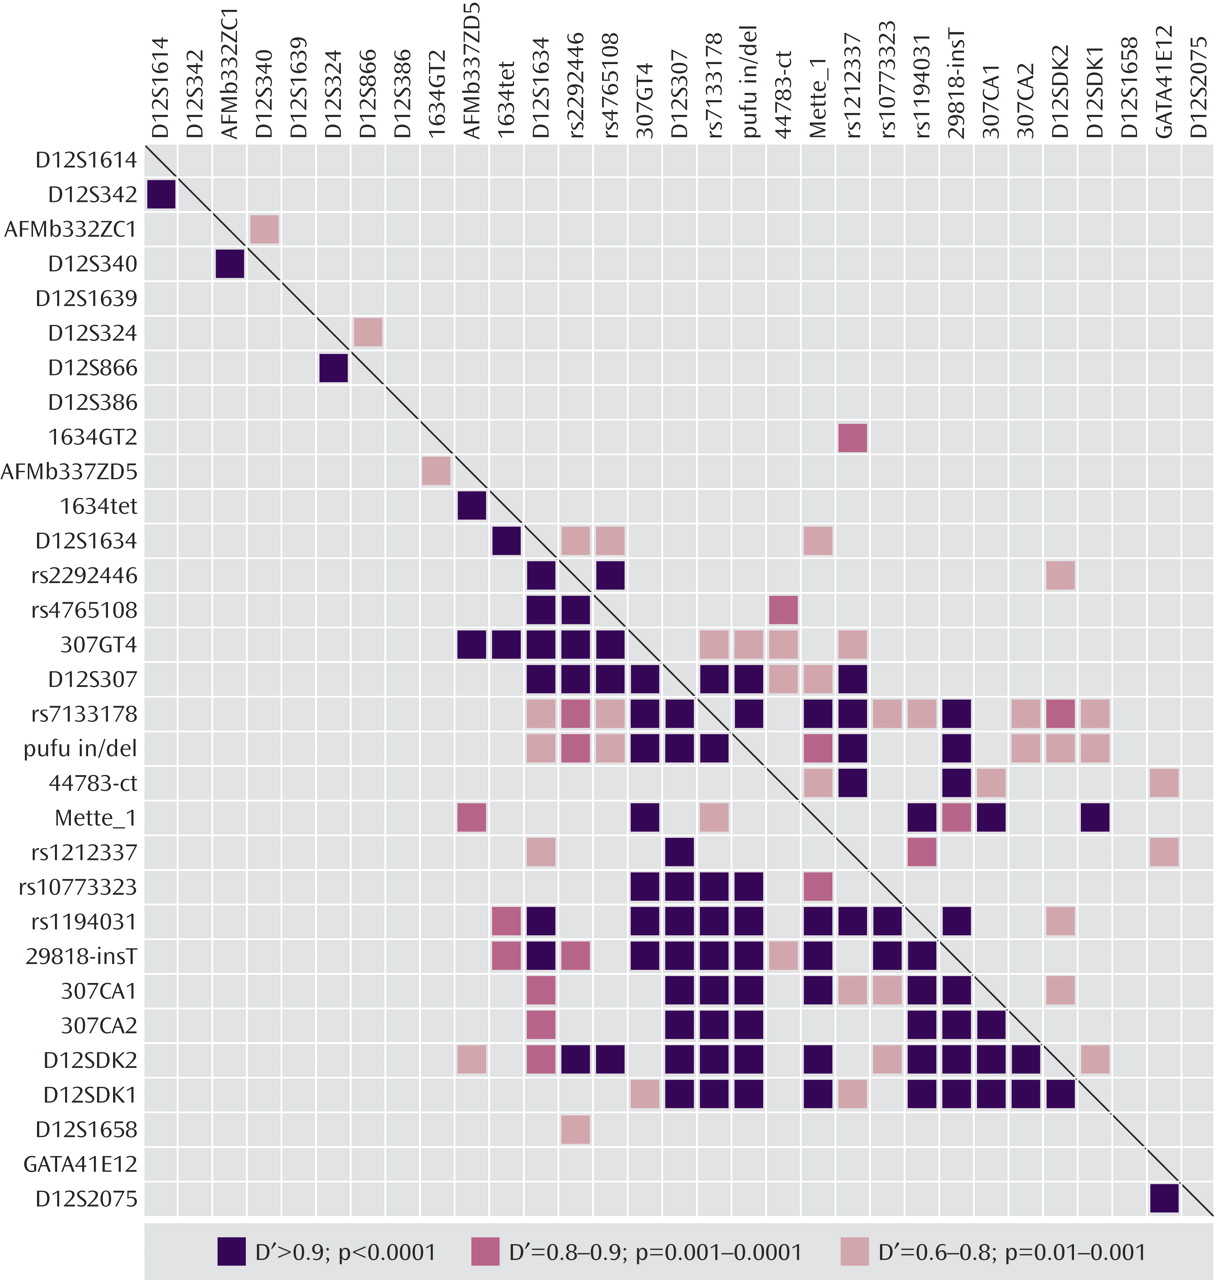
When allele counts for the Danish and U.K. cohorts were combined, six markers produced significant associations: D12S340 (p=0.042 [T3]), 1634GT2 (p=0.01 [T2]), 1634TET (p=0.004 [T2]), 307GT4 (p=0.021 [T3]), D12S307 (p=0.001 [T3]), and D12SDK1 (p=0.003 [T4]). Pairwise marker-to-marker linkage disequilibrium was determined using LDPAIRS. Absolute D′ and significance values for the linkage disequilibrium relationships are shown in
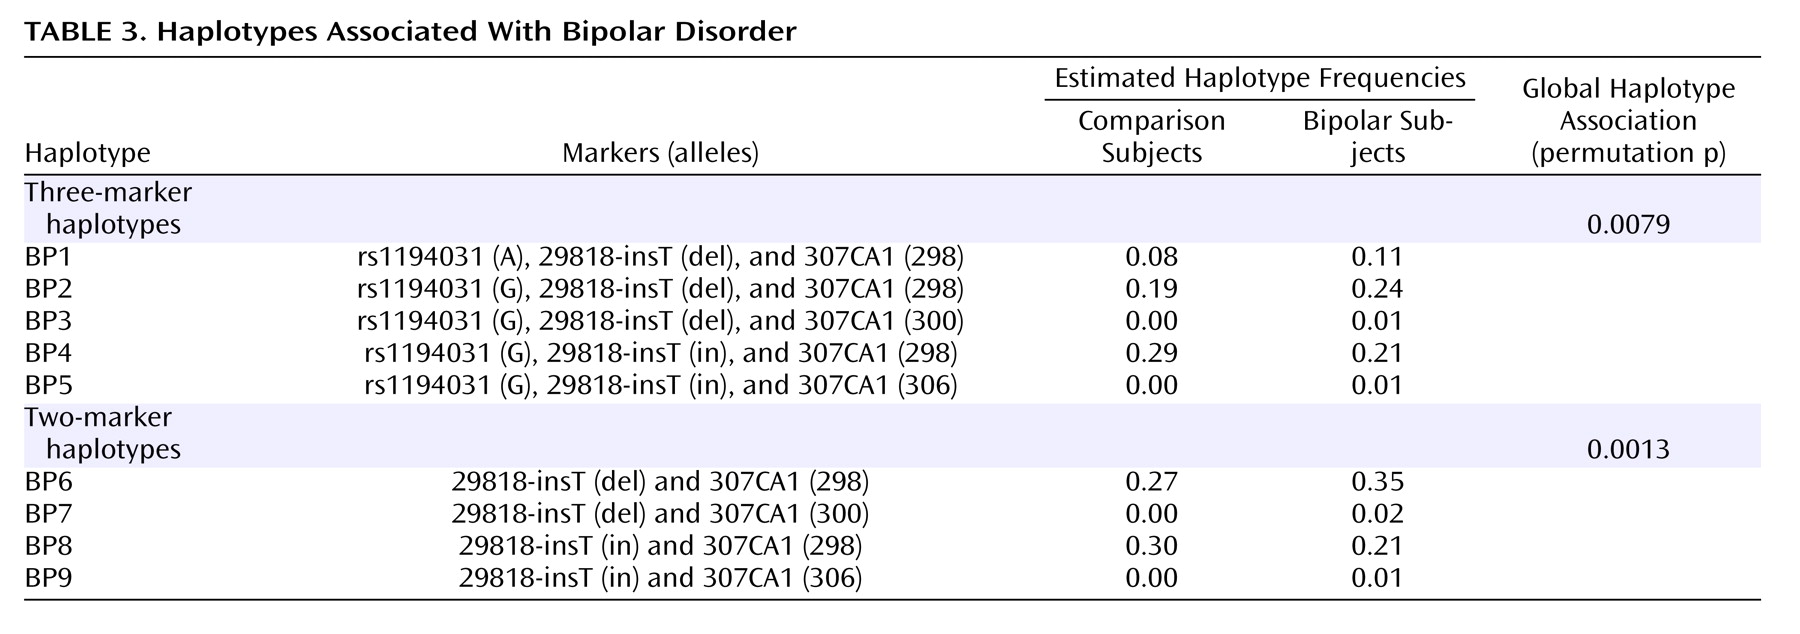
Figure 2 . As expected, stronger linkage disequilibrium was observed in the region where marker density was greatest. Estimated haplotype frequencies for the bipolar and comparison groups using data from pairs or trios of markers that were in pairwise linkage disequilibrium were generated using GENECOUNTING. The most significant three-marker haplotype was found when combining data from markers rs1190431, 29818-insT, and 307CA1 (empirical p=0.0079). Individual two- and three-marker haplotypes, denoted BP1 through BP9, with estimated frequencies that were notably elevated or reduced in bipolar patients relative to comparison subjects are shown in
Table 3 . Two-marker haplotype analysis using 29818-insT and 307CA1 produced a significant empirical p value of 0.0013 and estimated that 35% of bipolar patient chromosomes carry the 12 (BP6) haplotype and for this haplotype to occur in 27% of comparison chromosomes (
Table 3 ). This suggests that the BP6 haplotype may carry an elevated risk for bipolar disorder. The haplotype with alleles G, del, and 298 (BP2) as shown in
Table 3, generated from analysis of data from rs1194031, 29818-insT, and 307CA1 was estimated to occur in approximately 24% of bipolar patient chromosomes and in 19% of comparison chromosomes, again suggesting that this haplotype may carry an elevated risk for bipolar disorder. Similarly haplotype BP1 with A, del, and 298 was estimated to occur in 11% of bipolar patient chromosomes and 8% of comparison chromosomes. Additional haplotypes (BP3–5, BP7–9) that were estimated to be at altered frequency in bipolar patients relative to comparison subjects are also shown in
Table 3 .
