To establish a more accurate prevalence estimate, we conducted a nationwide random telephone survey using a validated screening instrument embedded in a structured interview.
Method
Data and Sampling
The data were generated in the spring and summer of 2004 from our national household telephone survey, which interviewed 2,513 adults ages 18 and older. The survey addressed shopping and buying attitudes and behaviors and their consequences and respondents’ financial and demographic data. The interviews were conducted from the Social and Behavioral Research Institute, California State University, San Marcos, by interviewers with an average of 14 months of experience in health-related telephone surveys and specific training for this project. The Social and Behavioral Research Institute conducts health surveys for the federal Health and Human Services Agency and the Centers for Disease Control and Prevention, numerous health agencies, and academic researchers. The interviewers used a computer-assisted telephone interviewing system that guarded against errors of omission and presentation. As an additional quality control measure, the first author monitored pilot interviews and provided feedback. During the data-collection phase, supervisors monitored performance during random interviews. To obtain informed consent, interviewers identified themselves, the survey organization, the study sponsor and survey topic, and stated that the interview was voluntary, anonymous, included no incentive, was terminable by the respondent at any time, and might be monitored by a supervisor. The interview was conducted with the first person ages 18 or older answering the telephone. Interviews averaged 11.3 minutes.
The sample was obtained through random-digit-dial telephone calls within the continental U.S., stratified by state. All listed and unlisted residential telephone numbers had an equal chance of inclusion. Cell phone numbers were not included. This household sampling method oversamples women and undersamples younger individuals and some minorities. To ensure that busy individuals were represented, telephone numbers were called until finalized or 15 call attempts had been made. A respondent was defined as a person who completed a full or partial interview. A status of “unknown study eligibility” could arise, for example, from persistent busy signals or repeated answers by a telephone answering device. The proportion of those with unknown eligibility who were then assumed eligible was set as equal to the proportion of known eligible persons among people actually reached. Additional response rate information accompanies the online version of this article.
Measurement Scales
To estimate the prevalence of compulsive buying, we used the Compulsive Buying Scale
(16) (available from the first author). The seven scale items reflect a need to spend money (items 1 and 6), awareness that spending behavior is aberrant (item 2), loss of control (items 3 and 4), buying things to improve mood (item 5), and probable financial problems (item 7).
An individual’s Compulsive Buying Scale score was generated from the responses to these seven items through a formula. Individuals whose Compulsive Buying Scale score was ≤1.34 are classified as “compulsive buyers”. This cutoff score (–1.34) was 2 standard deviations below the general population mean in the original study and produced a prevalence estimate of 8.1%
(16) . Further data in support of these score thresholds are presented in a supplement that accompanies the online version of this article. For comparison purposes, we also examined in separate analyses individuals with scores 3 standard deviations below the general population mean in the original study.
Lacking clinical interviews to validate that compulsive buyers suffer from a clinically significant disorder, we investigated one possible measure of “severity” by conducting a post hoc analysis of three preplanned questions that suggest loss of control over buying: how often the individual 1) “just wanted to buy things and did not care what you bought,” 2) “bought something and when you got home were not sure why you bought it,” and 3) “went on a buying binge and could not stop.” The three questions had an internal consistency Cronbach alpha of 0.59. We compared the proportions of compulsive buyers and other respondents who engaged in these behaviors “often” or “almost always” and calculated the mean of the three items’ summed scores (1 for “never” to 5 for “almost always”). In addition, we compared the shopping and buying attitudes and behaviors of the compulsive buyers and other respondents using five other questions not included in the Compulsive Buying Scale.
Data Analysis
The analyses included 1) descriptive and comparison statistics for the sample’s demographics, 2) the prevalence of compulsive buying, 3) cross-tabulation and t test comparisons of those classified as compulsive buyers versus the remaining respondents in terms of demographics and shopping and buying attitudes and behaviors, and 4) logistic regression analysis to investigate the independent contribution of demographic and other variables to prevalence rates in subgroups. The significance level was set at p≤0.05, two-tailed, for comparisons of demographic variables and p≤0.05, one-tailed, for shopping or buying attitudes and behaviors, with compulsive buyers hypothesized to exhibit more maladaptive responses. For each analysis, cases were dropped list-wise when data were missing. Although missing data were minimal, missing cases resulted in some variation in the number of cases used in different analyses.
Results
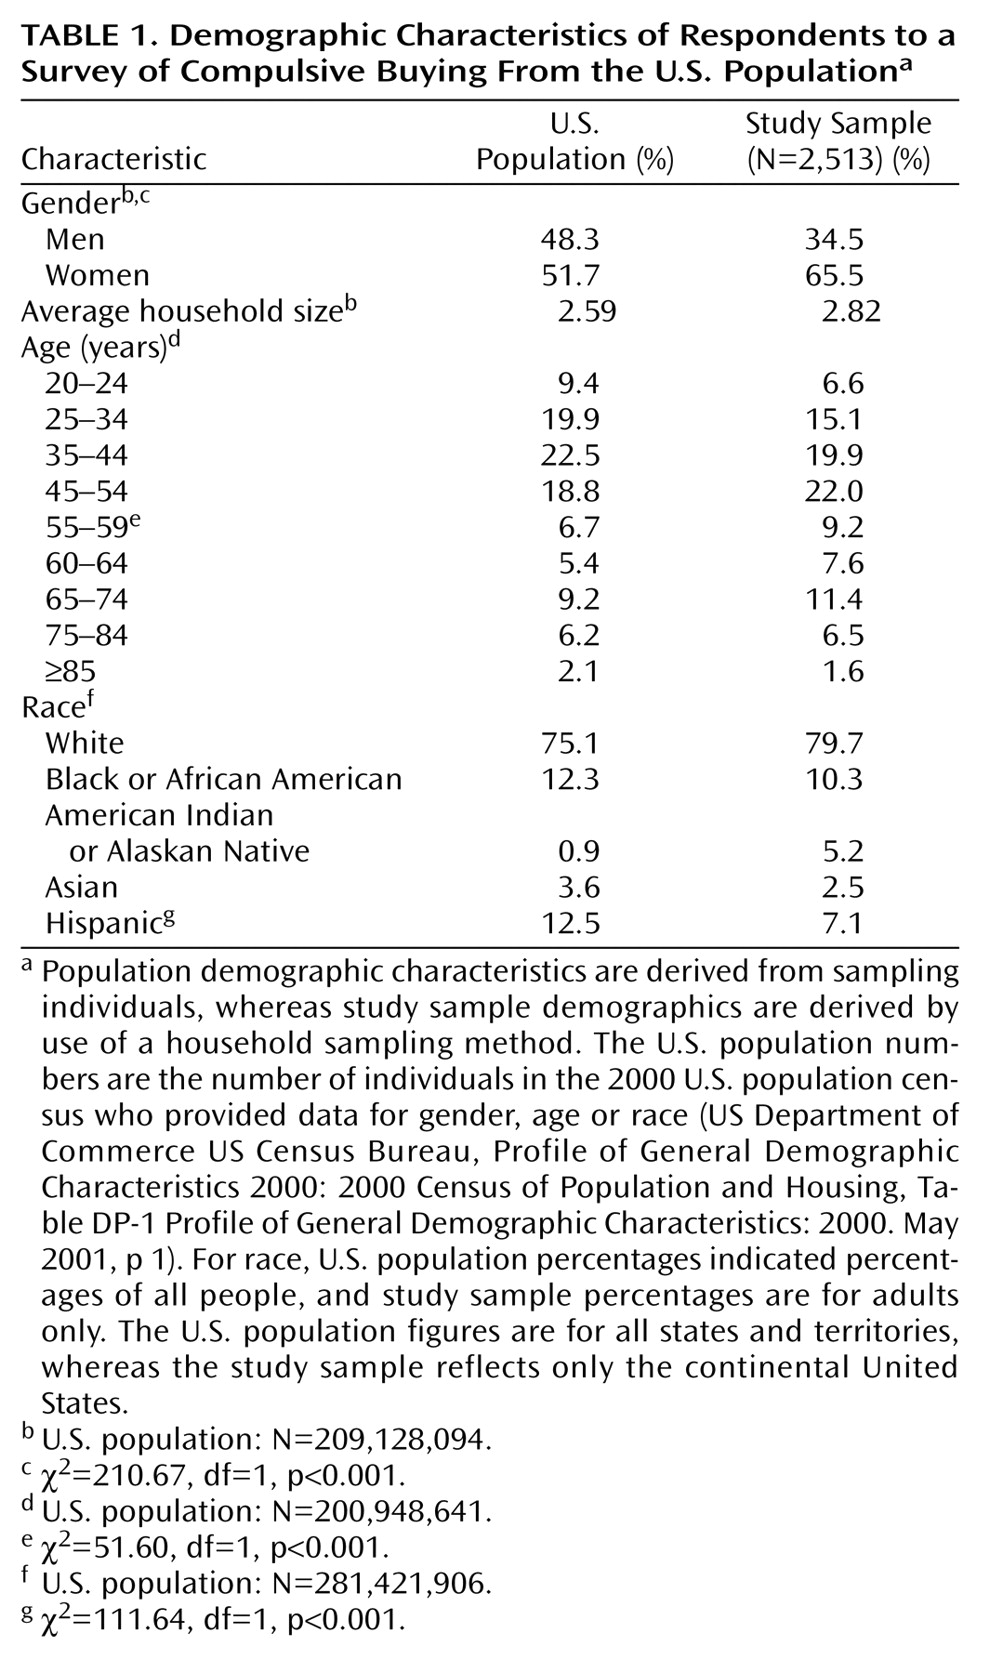
Compared with the U.S. adult population, the respondents included a substantially higher percentage of women and, to a lesser extent, a higher percentage of people ages 55 and older (
Table 1 ). A little over one-half (56.7%) of the respondents were married compared to 52.5% in the U.S. population (χ
2 =17.33, df=1, p<0.001). The respondents’ racial distribution closely resembled that of the U.S. population but included a smaller proportion of Hispanic individuals. Because the study sampling method was stratified by state, the respondents were representative of the U.S. population with regard to distribution by state.
The Compulsive Buying Scale scoring algorithm with a criterion score of ≤1.34 for “compulsive buyers” (i.e., scores ≤2 standard deviations below the mean) gave an estimated point prevalence of compulsive buying of 5.8% and, by gender, a point prevalence for women of 6.0% (90 of 1,501) and one for men of 5.5% (44 of 800). Adjustment of the overall prevalence figure to the gender distribution of the U.S. adult population, i.e., multiplying the gender-specific prevalence figures by the U.S. population gender proportions and summing the results, also gave a point prevalence rate of 5.8%. Using a Compulsive Buying Scale score criterion of 3 standard deviations below the mean for “compulsive buyer” produced an estimated prevalence rate of 1.4% (33 of 2,301). Again, the estimated prevalence was similar for women (1.5%, 23 of 1,501) and men (1.3%, 10 of 800).
Compulsive buyers had a significantly lower mean age (mean=39.7 years, SD=15.7) than other respondents (mean=48.7 years, SD=16.5) (t=6.04, df=2234, p<0.001). The two groups did not differ in the mean number of people per household (mean=3.04, SD=1.80, versus mean=2.83, SD=1.48).
Multiple logistic regression analysis, including income group, gender, age, marital status, and race/ethnicity as predictors of compulsive buying status indicated that only income group (Wald χ 2 =5.79, df=1, p<0.02) and age (Wald χ 2 =11.81, df=1, p=0.001) were significant.
The income distribution of compulsive buyers was shifted significantly toward those with a lower income compared with those of other respondents. A greater proportion of compulsive buyers reported incomes under $50,000 (54.7% versus 39.3%) (χ 2 =10.79, df=1, p=0.001).
The demographic characteristics of those with Compulsive Buying Scale scores 3 standard deviations beyond the normal mean (N=33), including gender distribution and mean number of people per household, closely resembled those of the remaining compulsive buyers (N=101) with scores 2 standard deviations beyond the normal mean.
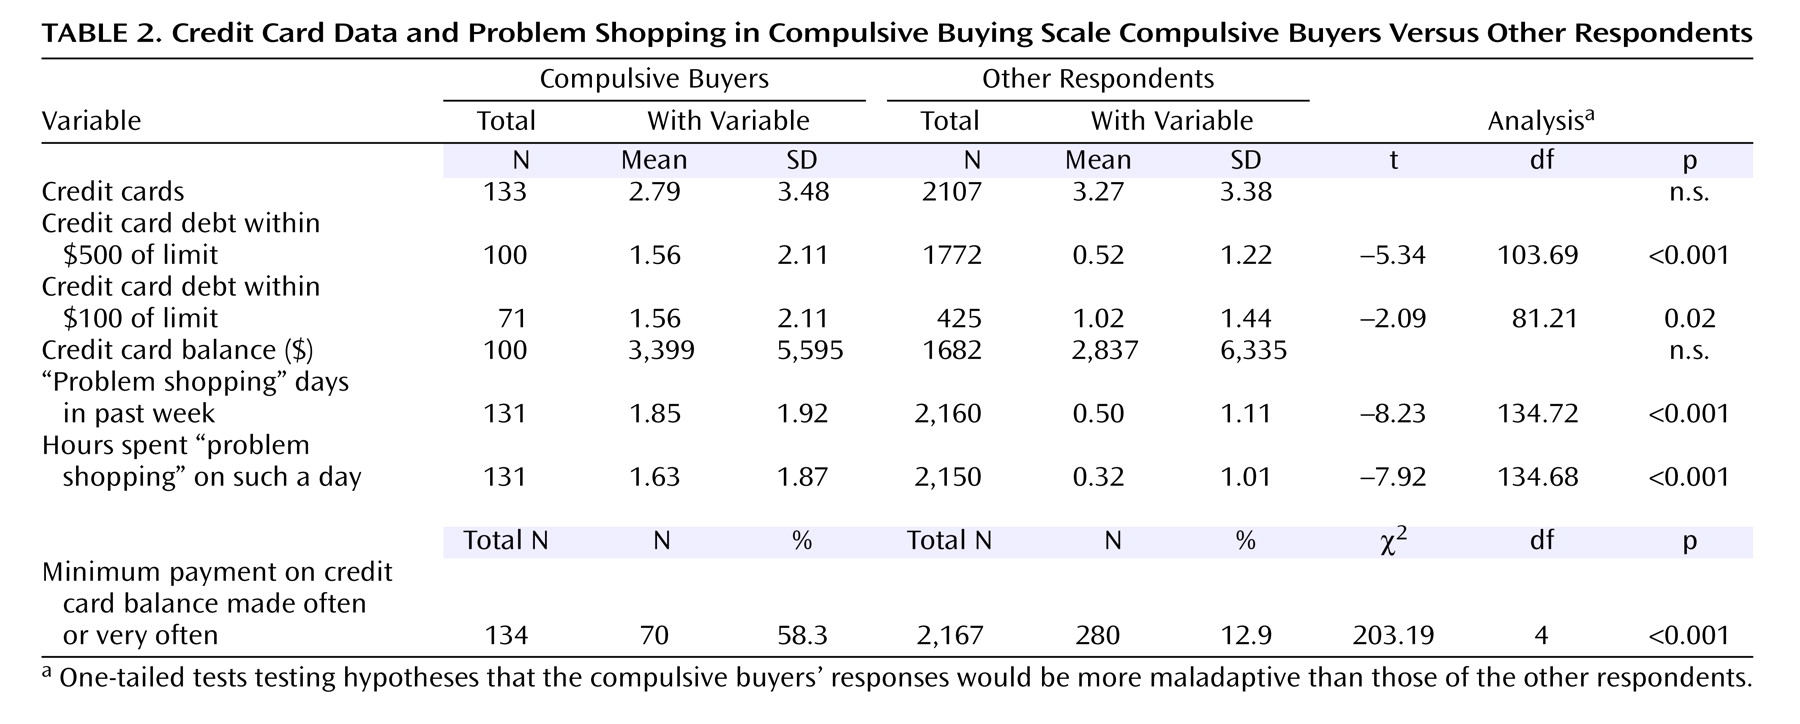
Compulsive buyers did not have more credit cards than other respondents, but more of their cards were within $500 and $100 of the credit limit (
Table 2 ). The compulsive buyers were more than four times as likely as other respondents to “very often” or “often” make the minimum payment on credit card balances (
Table 2 ). This greater propensity was present within each of the eight preplanned income groups between under $10,00 and under $150,000; the number of compulsive buyers with incomes of ≥$150,000 was only four, precluding meaningful description.
Compulsive buyers did not differ significantly from other respondents in mean total credit card balances, but the Compulsive Buying Scale compulsive buyers’ lower income level was a confounding factor. To control for income, we performed a post hoc analysis of total credit card debt. We collapsed the respondents as equally as possible into four income subgroups that became the following: <$25,000 (N=335), $25,000 to <$50,000 (N=403), $50,000 to <$75,000 (N=522), and ≥$75,000 (N=614). The post hoc comparisons indicated a nonsignificant tendency for compulsive buyers to have higher credit card balances in each category, with the largest differences occurring in the <$25,000 ($2,660 versus $1,530) and the ≥$75,000 categories ($6,130 versus $3,850). The large variances within each category, however, limited the power of the analysis.
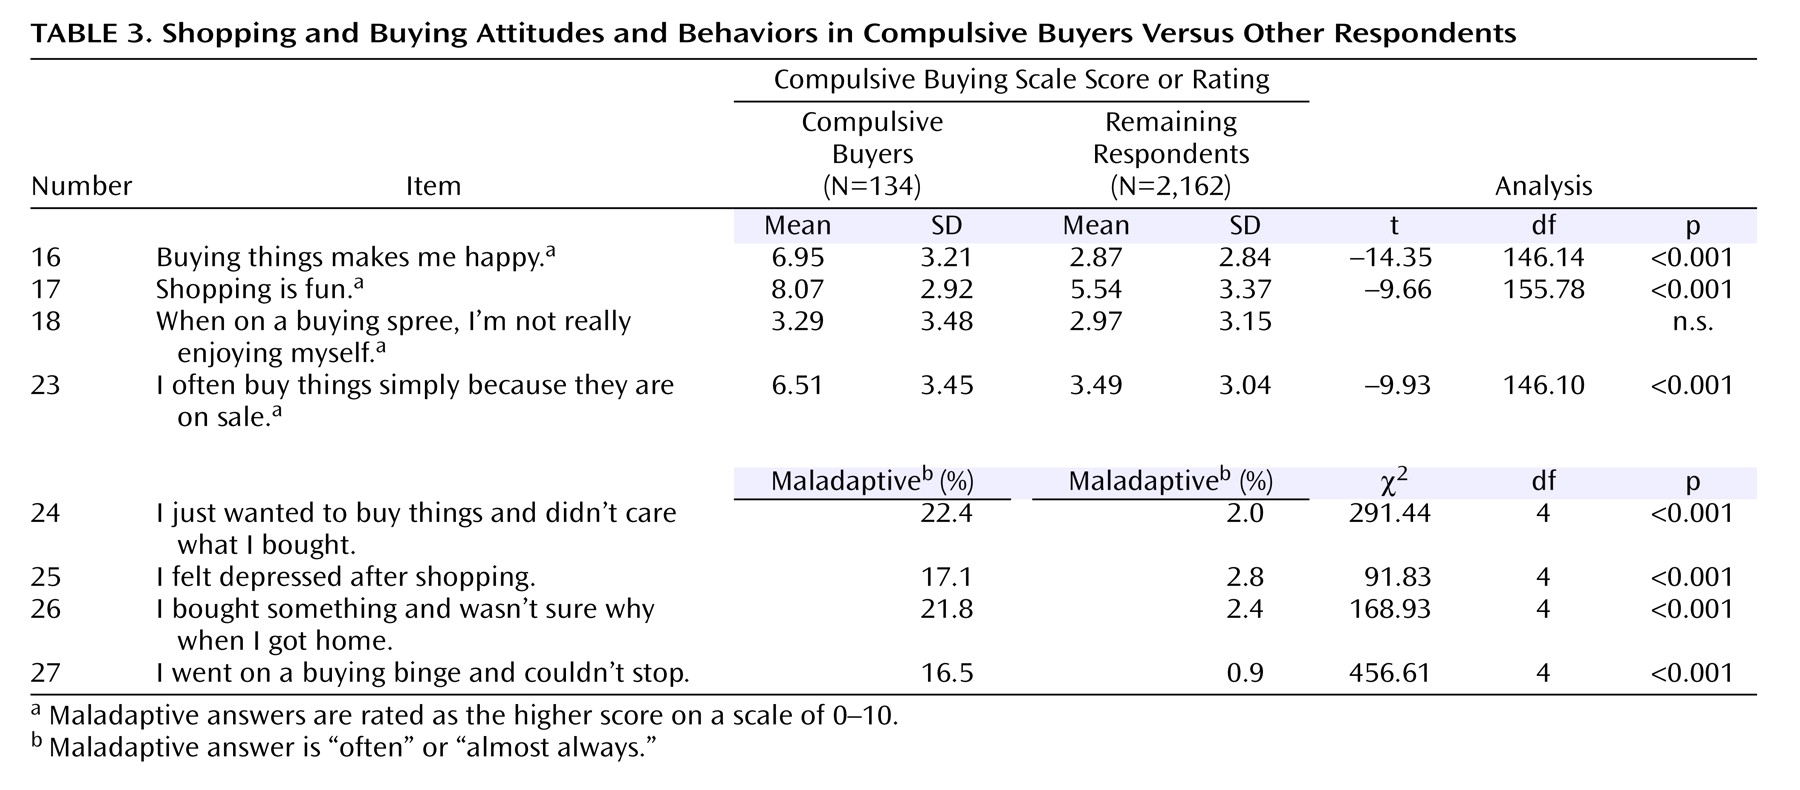
As hypothesized, the compulsive buyers exhibited more maladaptive shopping and buying attitudes and behaviors than the other respondents, thus, supporting the validity of the dichotomy. Compulsive buyers engaged in “problem shopping” more often and for longer periods (
Table 2 ). They took greater pleasure in shopping and buying, more often make senseless and impulsive purchases, more often feel depressed after shopping, and more often experiencing uncontrollable buying binges (
Table 3 ). The compulsive buyers also exhibited substantially higher scores on the post hoc “severity” measure (mean=2.73, SD=0.83, versus mean=1.67, SD=0.54), but given its post hoc nature, no statistical testing was performed.
With regard to the variables displayed in
Table 1,
Table 2, and
Table 3, those with Compulsive Buying Scale scores 3 standard deviations beyond the normal mean differed from the remaining compulsive buyers with scores 2 standard deviations beyond the normal mean only in that a smaller proportion were white (42.4% versus 65.4%; χ
2 =5.1, df=1, p<0.03) and a greater proportion went on buying binges and could not stop “almost always” or “often” (
Table 3, question 27) (30.4% versus 13.8%) (χ
2 =9.78, df=4, p<0.05).
Discussion
This large random sample nationwide telephone survey that used a validated screening instrument suggests that compulsive buying is a common problem among U.S. adults, affecting more than one in 20 adults. Previous research has documented significant suffering and impairment associated with this behavior. The gender-adjusted point prevalence (5.8%) produced by the recommended Compulsive Buying Scale cutoff score was considerably higher than those for major depression (about 1.5%
[22] ) and generalized anxiety disorder (1.5%–3.0%
[23] ), disorders that command substantial clinical and research attention. A self-help book has apparently been apt in referring to compulsive buying as “the smiled-upon addiction”
(24) . An extremely conservative 3 standard deviation Compulsive Buying Scale cutoff point below the respondents’ mean produced a point prevalence estimate (1.4%) similar to those for major depression and generalized anxiety disorder. For both the 2 standard deviation and 3 standard deviation compulsive buyers, the gender-specific prevalence rates were quite similar, as are the identified individuals’ demographic and clinical characteristics.
The validity of the larger prevalence estimate is supported first by the finding, albeit in small samples, that subjects meeting the 2 standard deviation Compulsive Buying Scale criterion almost always meet the suggested clinical diagnostic criteria
(12,
25) and vice versa
(26) . The estimate’s validity is further supported by the observation that the present study’s compulsive buyers exhibited more maladaptive shopping/buying attitudes and behaviors and more adverse financial consequences than the remaining respondents. Finally, the developers of the Compulsive Buying Scale pointed out that using a criterion score of 3 standard deviations below the respondents’ mean “would mean a high likelihood of excluding many people who truly are compulsive buyers.”
Still, without a structured clinical interview such as the Minnesota Impulsive Disorders Interview
(12) administered by a mental health professional, we cannot be certain that any of the compulsive buyers suffered from the clinical condition termed “compulsive buying” or merit clinical attention. As in any telephone survey, some respondents may have exaggerated responses (e.g., income) or been reluctant to admit unpleasant truths (e.g., credit card debt). The prevalence figure derived from the Compulsive Buying Scale may be too high, if, for example, there is a response bias toward considering shopping and buying as prestigious and thus to overstate one’s involvement. The figure could be too high if those meeting the Compulsive Buying Scale criterion do not meet the suggested clinical diagnostic criteria
(5) . The Compulsive Buying Scale does not include items, for example, that reflect preoccupation with buying or buying unneeded items, and the scale’s adverse consequences item is limited to writing uncovered checks. Furthermore, a small proportion of those meeting the Compulsive Buying Scale criterion may have done so because they were hypomanic or manic. Finally, the prevalence figure may be accurate but include many cases with minimal “severity.” Our post hoc severity indices, however, argue against this. Compulsive buyers were significantly more likely to answer in the maladaptive range on each of the index questions (numbers 24, 26, and 27). They also exhibited a substantially higher mean score on the post hoc severity measure, although this measure does not capture all potential aspects of “severity.”
By contrast, the Compulsive Buying Scale prevalence figure may be too low, if, for example, respondents were embarrassed to admit how much time and money they devoted to shopping and buying and the negative consequences. The figure could be too low because we were less successful contacting groups that appear to have a higher prevalence, i.e., younger individuals who more frequently use cell phones and individuals of a lower socioeconomic status who are less likely to have a telephone. It could be too low if compulsive buyers were less likely to be home to answer their telephones (because they were out shopping).
To determine the true prevalence of clinically significant compulsive buying will require administering a structured, validated, diagnostic interview to a large and representative sample of the population. Comparing the diagnostic results of these interviews to the interviewed individuals’ Compulsive Buying Scale scores would provide an indication of the false positive and false negative rates of potential cut-off points, including the cutoff score (–1.34) that we used as our primary criterion. Because a screening instrument’s false positive and false negative rates are specific to the sample examined
(27), we could not use the rates observed in the original Compulsive Buying Scale study
(16) or in a subsequent clinical study
(26) to correct the prevalence figure we observed.
Our estimate is constrained by our rate of response: 56.3%. Although substantial, it does not guarantee that our sample is representative of the U.S. adult population with regard to shopping and buying attitudes and behaviors. This response rate compares favorably, however, with those obtained in nationwide health surveys. Our estimate is also constrained by differences between the study sample and the U.S. adult population. First, the sample contained a smaller proportion of younger individuals and somewhat fewer Hispanic individuals. Logistic regression demonstrated, however, that after we controlled for income and age, race/ethnicity did not contribute to differences in prevalence rates. Third, the sample contained a higher proportion of women. To compensate for this, we provided a gender-adjusted prevalence estimate, but the result was unchanged.
If we accept this study’s point prevalence estimate as approximately accurate, certain additional conclusions follow. First, the widespread opinion
(5,
28 30) that most compulsive buyers are women may be wrong. The difference that we observed between the prevalence in women and men is quite small and contrasts with the marked difference reported in clinical trials in which women constituted 80% to 95% of the participants
(26,
28,
31) . Perhaps women with clinically significant compulsive buying are more willing to seek treatment, as is true for depressive and anxiety disorders
(32) . Perhaps the recruitment strategies used in clinical studies, e.g., daytime television ads or contacting self-help groups, resulted in recruiting a larger proportion of women
(33) . On the other hand, many have argued that shopping and buying consumer goods are more central to women’s social and personal identities than to men’s, putting women at greater risk of becoming compulsive buyers
(33) . Again, further research is needed to clarify potential gender differences.
Second, the younger age of the compulsive buyers compared with the other respondents is consistent with the observation that the clinical disorder tends to start in the late teens to 20s
(34) . Perhaps younger individuals, having less well-established work and marital/partnership identities, suffer more discrepancy between their “real” and “ideal” selves, which is a source of excessive buying
(3) . Perhaps they are ill prepared to manage judiciously the credit cards that flood their mailboxes. The reasons for the association between compulsive buying and younger age, however, remains to be established.
Third, our logistic regression analysis indicated that the prevalence of compulsive buying was inversely related to income. These findings contrast with those of d’Astous, who found a “U-inverted relationship between income and compulsive buying tendencies”
(29, p. 26) and those of O’Guinn and Faber
(6), who found no relationship to income. Black and colleagues
(35), however, found that greater severity of compulsive buying, as indicated by worse scores on the Compulsive Buying Scale, was associated with lower income.
Fourth, the compulsive buyers’ high rates of senseless or impulsive buying and their significantly higher rates of financial stress suggest that financial problems associated with compulsive buying merit serious attention. Many U.S. adults are laboring under their debt burden. For example, 11% of families are suffering debt hardship, i.e., devote more than 40% of their income to debt payment
(36) . Among households of young adults (ages 25–34 years) with incomes below $50,000, a subset that our data suggest are most affected by compulsive buying, this figure is nearly 20%
(37) . In 2002, one in 25 credit card accounts was more than 30 days overdue
(38) . The extent to which compulsive buying plays a role in these troubling figures deserves investigation.
Finally, preliminary evidence suggests that compulsive buyers suffer from abnormally high levels of depression and anxiety
(12) and experience higher rates of comorbid mood and anxiety disorders than comparison groups
(12,
25) . In one study, clinical compulsive buyers were also more likely to suffer from comorbid substance abuse, eating disorders, and other impulse control disorders
(12) . If compulsive buying is associated with these disorders, it deserves clinical and research attention not only for its direct effects but also for the suffering and impairment brought by these comorbid conditions.
There are, however, dangers in a “medicalization” of compulsive buying
(39) : attention is focused on the affected individual, who is singled out for psychotherapy or drug treatment. Meanwhile, the possible social contributions to the disordered behavior, e.g., easy credit, inadequate money management training and skills, predatory interest rates, and dilution of family structure are ignored, and social interventions, such as consumer education, and further regulation of the credit card industry go unstudied.


