Increased brain size is one of the most consistent neurobiological findings in autism
(1,
2) and appears to be associated with cortical gray matter enlargement involving mostly the frontal and temporal lobes
(3) . While increases in cerebral size and lobar size have been reported, the exact pathophysiology of these volumetric alterations remains to be determined
(3,
4) . Cortical and lobar gray matter volumes are correlated with brain surface and cortical thickness, which is observed in healthy populations and in individuals with neuropsychiatric disorders
(5) . Hence, an increase in cortical volume in autism could be related to an increase in its surface area, its thickness, or both
(4,
5) . A recent preliminary investigation of the gyrification patterns in autism revealed an increase in cortical folding in the frontal lobe, suggesting a possible increase in the total cerebral surface area
(4) . In light of these observations, our study was conducted in order to examine cortical thickness in a group of children with autism.
Method
The participants were 17 boys with autism and 14 healthy male comparison subjects between 8 and 12 years of age. The diagnosis of autism was established through the administration of the Autism Diagnostic Interview–Revised and the Autism Diagnostic Observation Schedule. Children with secondary autism, such as tuberous sclerosis, were excluded. Comparison subjects were screened by face-to-face interview, and individuals with family history of any neuropsychiatric disorder, such as autism, learning disability, affective disorders, and schizophrenia, were not included. Potential subjects with a history of birth asphyxia, head injury, or a seizure disorder were also excluded. All comparison subjects had a full-scale IQ score >70 and no learning disability, as assessed by the Wide-Range Achievement Test, Revised. Exclusions were based on history and physical examination as well as laboratory testing when indicated. The WISC-III was administered to measure full-scale IQ, verbal IQ, and performance IQ. The methodology of the study was approved by our institutional review board. Written informed consent was obtained from parents, and assent was obtained from all children.
Neuroimaging scans were procured using a GE 1.5-T Signa scanner. First, a T
1 -weighted spoiled gradient recall (SPGR) sequence was acquired with the following parameters: slice thickness=1.5 mm, slice numbers=124; time to echo (TE)=5 msec; repetition time (TR)=25 msec; flip angle=40°, number of excitations=1; field of view: 24 cm; matrix: 256x192. Proton density and T
2 -weighted images were then obtained with the following parameters: slice thickness=5 mm; TE=17 msec for proton density or 102 msec for T
2 ; TR=2500 msec; number of excitations=1; field of view=24 cm; matrix: 256x192. Magnetic resonance imaging (MRI) data were identified by scan number in order to retain blindness. MRI data were analyzed by using Analysis of Images, Networks and Systems Software
(7) (BRAINS), while applying previously published methodologies of cortical thickness and total brain volume measurements
(6,
7) . The initial step of surface analysis in BRAINS is the creation of a triangle-based isosurface, using the parametric center of the cortex as the outer boundary of the brain. Cortical thickness is calculated from vectors that are normal to each triangular surface, and the shortest distance to 50% gray matter and 50% white matter is defined as the thickness
(6) .
All measurements from the autistic children were compared with the healthy children using Student’s t test. Pearson’s correlation coefficients were used to examine the relationships between total brain volume, IQ measures, and cortical thickness. Spearman’s rho correlation coefficients were used to examine the associations between Autism Diagnostic Interview–Revised and Autism Diagnostic Observation Schedule scores with cortical thickness measurements. A two-tailed statistical significance level was set at p<0.05.
Results
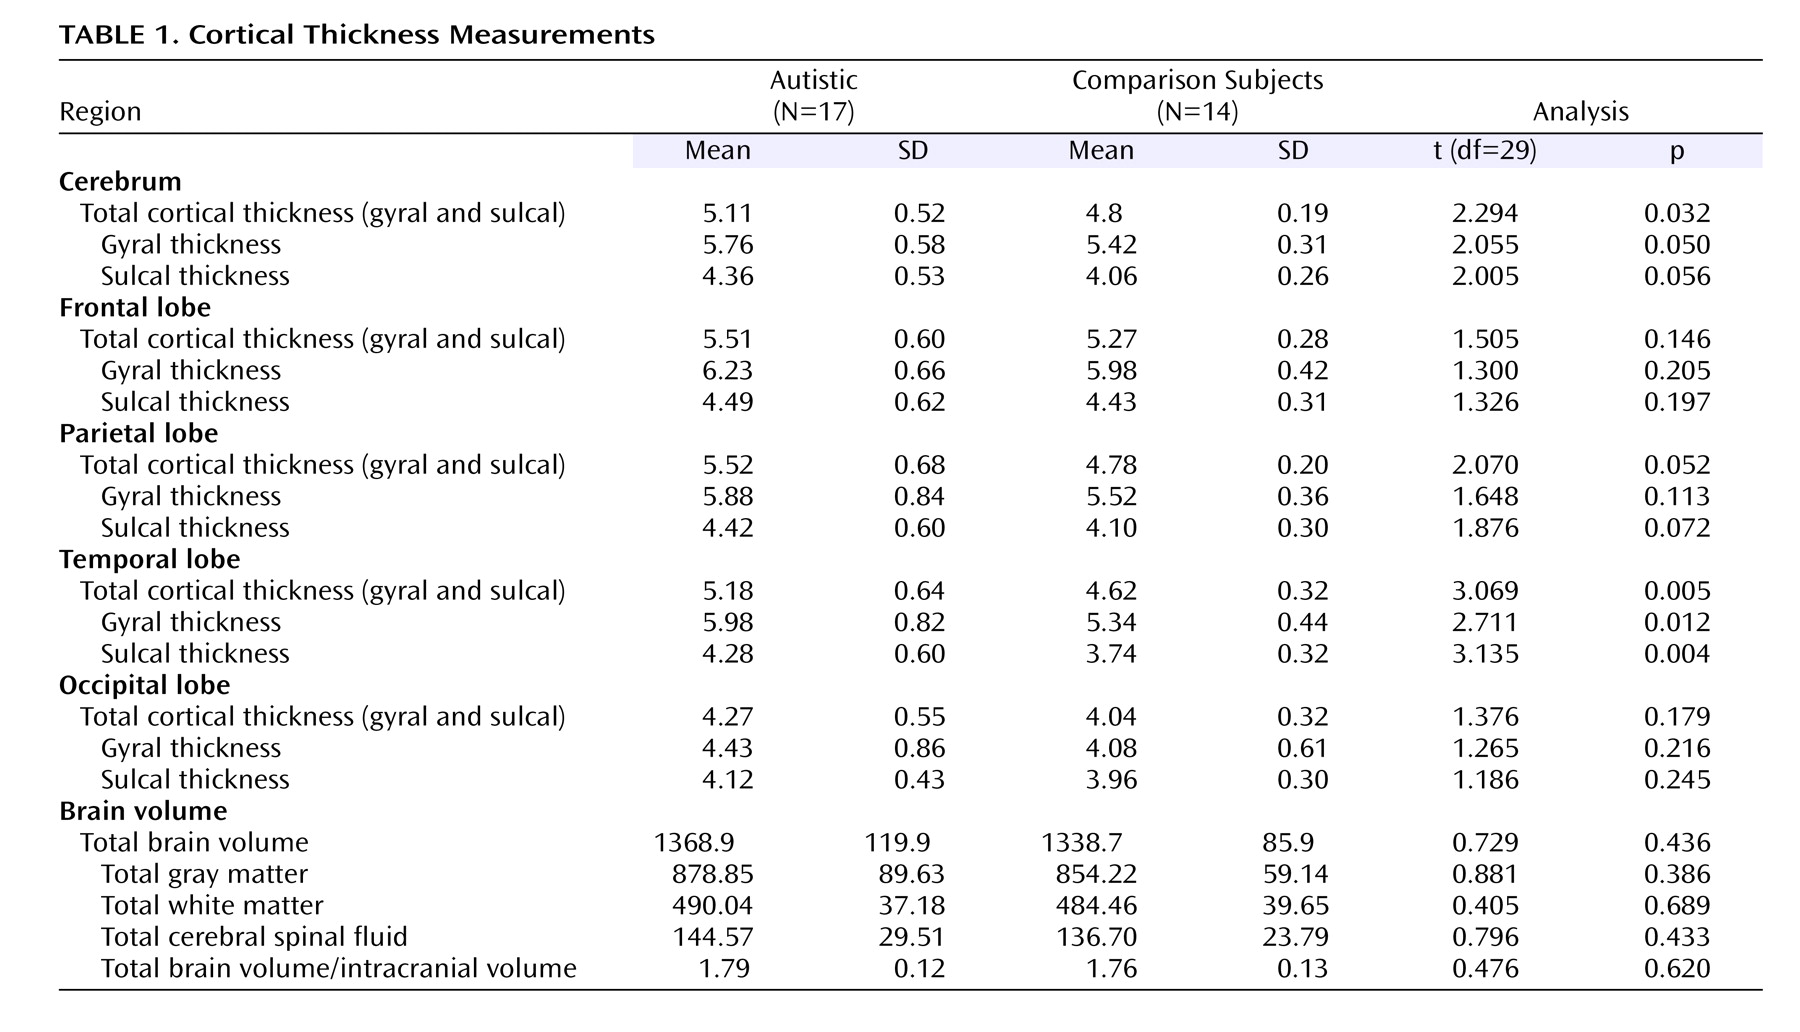
No age differences were observed between the autistic group (mean=10.5 years [SD=1.5]; range=8.1–12.9) and comparison group (mean=10.7 years [SD=1.4]; range=8.9–13.0). However, the autistic group had lower full-scale IQ scores (mean=90.7 [SD=18.4]; range=64–128) than the comparison group (mean=110.9 [SD=12.2]; range=91–130) (t=–3.498, df=29, p<0.005). Children with autism had a mean score of 55.9 on the Autism Diagnostic Interview–Revised (SD=9.6; range=41–67) and 15.6 on the Autism Diagnostic Observation Schedule (SD=2.7; range=11–19). Differences in cortical thickness were found between the two groups, and results are summarized in
Table 1 . No differences in total brain volume or in any of the global volumetric measures were observed between the two groups (
Table 1 ), and no association was found between total brain volume and IQ measures in either group. Similarly, no relationship was found between cortical thickness and IQ measures, except for performance IQ in the autistic group (r
s =–0.500, p=0.041). In addition, no significant correlations were found between cortical thickness and clinical features as measured by Autism Diagnostic Interview–Revised and Autism Diagnostic Observation Schedule items.
Discussion
To our knowledge, this is the first neuroimaging study to report abnormal cortical thickness in autism, which is consistent with evidence from neuropathological studies describing areas of increased cortical thickness
(8) . Findings in this study were most obvious in the temporal lobe, which is concordant with several investigations reporting various anomalies in the temporal lobe in autism, including decreased size of the left planum temporal, bilateral reduction of temporal perfusion, and abnormal activation of the superior temporal sulcus in response to vocal sounds
(9,
10) .
In our analysis, gyral thickness was increased relative to sulcal thickness in both patients and healthy subjects, which is consistent with normal human brain cytoarchitecture
(5,
7) . This regional differentiation is important, since sulcal and gyral areas have distinct histological and neurochemical characteristics with different functional specializations
(7) . Our findings also support evidence of aberrant cerebral connectivity observed in autism
(11), since convolutional development and cortical architecture are interrelated
(4,
5,
7) and are important markers of cerebral development and neuronal connections
(4,
5,
7) . In fact, neural trajectories differ, depending on their localization with tangential orientation and long connections in the sulcal regions, in contrast to vertical, shorter trajectories in the gyral areas
(7) . Hence, surface architecture, as determined by a complex gyrification process, may affect the development of the underlying neural circuitry
(4,
5,
7) .
Our findings of cortical thickness in autistic patients should be considered with caution, taking into consideration the preliminary nature of our investigation and the inability to control for all confounding factors, such as total brain volume and IQ measures, because of the small group size. In addition, a relationship between IQ and total brain volume was not observed, which is consistent with several other investigations examining the association of cognitive function and volumetric measurements
(1,
2) . However, our finding is not concordant with evidence from developmental studies of healthy and intellectually disabled individuals indicating the existence of positive correlations between brain size and IQ
(12) . Finally, the nonsignificant increase in total brain volume in our patient group, relative to comparison subjects, is inconsistent with several previous reports of brain enlargement in children with autism
(1 –
3) and could be related to the small study group size or to the possible age-related changes observed in the disorder
(1,
3) . Larger studies examining cortical architecture as well as total brain volume and their relationships with cognitive measures and clinical features are warranted before conclusive results can be determined.


