Abstract

OBJECTIVE: The goal of this study was to assess brain glucose metabolism and its relationship to dissociation measures and clinical symptoms in DSM-IV depersonalization disorder. METHOD: Positron emission tomography scans coregistered with magnetic resonance images of eight subjects with depersonalization disorder were compared to those of 24 healthy comparison subjects. The two groups did not differ in age, sex, education, performance on a baseline neuropsychological battery, or performance on a verbal learning task administered during [18F]fluorodeoxyglucose uptake. A cortical analysis by individual Brodmann’s areas was performed. RESULTS: Compared to the healthy subjects, subjects with depersonalization disorder showed significantly lower metabolic activity in right Brodmann’s areas 22 and 21 of the superior and middle temporal gyri and had significantly higher metabolism in parietal Brodmann’s areas 7B and 39 and left occipital Brodmann’s area 19. Dissociation and depersonalization scores among the subjects with depersonalization disorder were significantly positively correlated with metabolic activity in area 7B. CONCLUSIONS: Depersonalization appears to be associated with functional abnormalities along sequential hierarchical areas, secondary and cross-modal, of the sensory cortex (visual, auditory, and somatosensory), as well as areas responsible for an integrated body schema. These findings are in good agreement with the phenomenological conceptualization of depersonalization as a dissociation of perceptions as well as with the subjective symptoms of depersonalization disorder.
Although depersonalization disorder is one of the four major dissociative disorders, it is a poorly researched condition, and very little is known about its biological underpinnings. The hallmark of depersonalization is an altered subjective experience regarding the familiarity of self and surroundings, a dissociation of perceptions with intact reality testing. Thirty subjects with DSM-III-R depersonalization disorder have been described (1), showing a mean age of onset in adolescence, an often chronic unremitting course associated with significant morbidity, frequent comorbidity with mood and anxiety disorders but no consistent association with any such disorder, and poor response to pharmacotherapy with the possible exception of benzodiazepines and selective serotonin reuptake inhibitors (SSRIs). Neuropsychological testing has revealed selective deficits in attention, short-term memory, and spatial reasoning (2).
The neurochemistry of depersonalization is poorly understood and does not provide clear indication of a neuroanatomical center. Depersonalization can be induced in subjects not suffering from the disorder by means of a pharmacological challenge with tetrahydrocannabinol (THC) (3) or the partial serotonin agonist m-CPP (4). Attempts at localizing depersonalization, although not in depersonalization disorder per se (512), have yielded contradictory results regarding activation, laterality, and regional involvement. Half a century ago, Penfield and Rasmussen (13) noted “illusions of unfamiliarity, strangeness and remoteness,” the descriptions of which reflect typical depersonalization experiences. They claimed that these perceptual illusions could be produced by stimulation of the cortex only in the temporal region, perhaps extending somewhat into the occipital cortex (p. 173). In “G.A.,” “queer sensations of not being present and floating away” were produced by stimulation of the superior temporal gyrus. “D.A.” experienced illusions of being “far off and out of this world,” produced by stimulation of the middle temporal gyrus. It is of interest that Penfield and Rasmussen postulated that depersonalization states involve an “alteration in the usual mechanism of comparison of immediate sensory perception with memory records.”
Some lines of evidence are consistent with this temporal lobe hypothesis of depersonalization. The epilepsy literature describes depersonalization with seizures. In a series of 32 cases, 11 manifested depersonalization, four with a left-sided focus, three with a right-sided focus, and four with general dysrhythmia (5). In another series of 71 epileptic patients in whom dissociative symptoms were quantified, depersonalization was most commonly induced by partial complex seizures, more so with left-sided foci, but Dissociative Experiences Scale scores were modest compared to those of patients with psychiatric dissociative disorders (6). In a single case study of a patient with primary depersonalization disorder, brain electrical mapping revealed left hemispheric frontotemporal activation (14).
A neurobiological model of depersonalization proposed recently by Sierra and Berrios (15) is theoretically extrapolated from the experiential narratives of depersonalized subjects, the neurological literature, and findings in cognitive neuroscience. Its basic premise is bilateral corticolimbic disconnection with prefrontal activation and limbic inhibition resulting in hypoemotionality and attentional difficulties. To our knowledge, this model has not been subjected to empirical examination of the frontal cortex and limbic system in depersonalization disorder.
In addition, the subjective symptoms encountered in depersonalization disorder are overwhelmingly perceptual in nature, involving primarily the visual and somatosensory modalities. Therefore, examination of sensory activity in the parietooccipital cortex would be of great interest.
In summary then, the goal of the present study was to localize brain function abnormalities associated with depersonalization disorder, with a particular focus on the temporal lobe hypothesis, the frontolimbic disconnection hypothesis, and the function of the sensory cortical network.

Method

Subjects

Four male and four female subjects with DSM-IV depersonalization disorder were recruited. All met the criteria for the disorder as assessed by a semistructured clinical interview as well as by the Structured Clinical Interview for DSM-IV Dissociative Disorders (16). DSM-IV stipulates that in order to meet the diagnostic criteria for depersonalization disorder, an individual must experience persistent or recurrent depersonalization that leads to significant distress and/or dysfunction and does not exclusively occur in the context of another disorder, for example, depressive episodes, panic attacks, substance abuse, or temporal lobe epilepsy. Demographic characteristics are included in Table 1. Mean age at onset was 17.6 years (SD=13.5, range=3–41), with a mean duration of 246 months (SD=198, range=14–480). The course of the disorder was continuous from onset in seven subjects; one subject had episodic depersonalization from age 6–12, which then became continuous. All subjects were therefore experiencing depersonalization at the time of imaging. Some typical descriptions of depersonalization experiences by these subjects included feeling “off base,” “under water,” “floating,” “like a dead person,” as if “I’m here but not here,” “detached from my body,” “going through the motions,” “like a robot,” “emotionless,” in a “brain fog,” and “like my mind is a blank.” Derealization often accompanied depersonalization: “like a big pane of glass between me and the world,” “invisible filters,” and “detached from the environment.” Dissociative symptoms were quantified by the Dissociative Experiences Scale (17) and its depersonalization factor (18). Subjects had a mean Dissociative Experiences Scale score of 21.4 (SD=8.7) and a mean Dissociative Experiences Scale depersonalization score of 52.2 (SD=25.1). Five subjects had never received psychotropic treatment; one subject had transiently responded to imipramine. The symptoms of this subject plus two others had been refractory to several medications including SSRIs, bupropion, lithium, stimulants, benzodiazepines, venlafaxine, monoamine oxidase inhibitors, typical and atypical antipsychotics, and buspirone. Four subjects received weekly psychotherapy for 1–3 years; they typically described the therapy as helpful in other respects but not with the alleviation of depersonalization symptoms.
Subjects with depersonalization disorder were matched in a 1:3 ratio to 12 male and 12 female healthy comparison subjects who were free of lifetime axis I and axis II disorders and were without family psychiatric histories in first-degree relatives. Their demographic characteristics are included in Table 1. Subjects in both groups were free of medical and neurological illness, were medication-free for at least 6 weeks, and had normal results from baseline routine laboratory evaluations, including a negative toxicology screening and pregnancy test. Subjects gave written informed consent after listening to a complete description of the study and were compensated for their participation.
All subjects were right-handed on the basis of the Edinburgh Handedness Inventory (19). In order to compare neuropsychological functioning, a brief neuropsychological battery was administered to all subjects, with the exception of three healthy comparison subjects. The abbreviated vocabulary subtest of the WAIS is the best single correlate with general IQ (20). The Wisconsin Card Sorting Test (21) measures problem solving, executive functioning, and cognitive flexibility. The Benton Line Orientation (22) measures visuospatial perception that does not rely on memory. The Finger Tapping Test (23) measures motor speed and finger dexterity for each hand. The Controlled Oral Word Association Test and the animal naming test measure verbal fluency (24). The two groups did not significantly differ on any of these tests (Table 1).

Imaging Procedures

Positron emission tomography (PET) scans were obtained with a head-dedicated scanner (model 2048, GE Medical Systems, Madison, Wis.) with a measured resolution of 4.5 mm in plane (4.2–4.5 across 15 planes) and 5.0 mm axially. Two sets of 15 images were acquired to achieve a 16-cm axial field of view. PET images were reconstructed with blank and transmission scans for measured attenuation correction by using the Hanning filter (width=3.15 mm). As a control for mental activity during the 35-minute [18F]fluorodeoxyglucose (FDG) uptake period, the subjects were given a variant of the California Verbal Learning Test modified for use in an imaging experiment, which was described in greater detail elsewhere (25). Sixteen word lists were serially presented on a screen; there were 2-second interword intervals and four semantic categories. Subjects read the words aloud, and after each presentation, they were asked to recall the words as best as they could. Each list was presented five times; and a total of four lists were used to fill the entire 35-minute uptake period. Ears were not plugged, and the test was administered in a darkened, sound-attenuated room. The two groups did not differ in performance (number correct—subjects with depersonalization disorder: mean=11.93, SD=2.07; healthy comparison subjects: mean=12.89, SD=1.52; t=1.43, df=30, p=0.16) (perseverations—subjects with depersonalization disorder: mean=0.62, SD=0.54; healthy comparison subjects: mean=0.87, SD=1.11; t=0.60, df=30, p=0.55) (intrusions—subjects with depersonalization disorder: mean=0.08, SD=0.12; healthy comparison subjects: mean=0.07, SD=0.06; t=0.36, df=30, p=0.72) (semantic clustering—subjects with depersonalization disorder: mean=7.46, SD=3.02; healthy comparison subjects: mean=7.51, SD=2.34; t=0.05, df=30, p=0.96).
All participants received a magnetic resonance imaging (MRI) scan that was used as an anatomical template. For each participant, the same individually molded thermoplastic face mask was used during both PET and MRI scans to keep the head stationary and to permit accurate coregistration of PET and MRI images. MRI axial acquisitions were acquired with a 1.5-T Signa 5x system (GE Medical Systems, Madison, Wis.) with the following parameters: TR=24 msec, TE=5 msec, flip angle=40, slice thickness=1.2 mm, pixel matrix=256 × 256, and field of view=23 cm. MRIs were segmented by using a point of rarity between gray and white values in the intensity histogram, and segmentation was validated by stereological measurement and test-retest reliability across 16 independent scans performed 8 weeks apart.
Once all the PET and MRI images were coregistered by a method previously described (25), an analysis of relative glucose metabolism by Brodmann’s areas was conducted. This was carried out on coronal slices on the basis of a digitized version of an atlas that includes 33 coronal slice maps of Brodmann’s areas defined by microscopic examination of a single entire postmortem brain (RH Perry, AE Oakley, and EK Perry, personal communication, 1996). The technique by which nine prefrontal Brodmann’s areas were stereotactically assessed has been detailed elsewhere (26). Similar procedures were employed to assess the other Brodmann’s areas. Six separate analyses of functionally distinct brain areas were conducted for the prefrontal cortex, precentral cortex, cingulate gyrus, temporal lobe, parietal lobe, and occipital lobe. In addition, given that multisensory perceptual alterations are a hallmark symptom of depersonalization, we compared the two groups in total brain sensory cortical activity.
The dependent measure for all PET data analyses was relative glucose metabolic rate, expressed as the mean activity value in nanocuries, for all gray matter pixels in each of the cortical regions of interest, divided by the mean activity value for the whole brain.

Statistical Analyses

Because we were evaluating frontal, temporal, and parietooccipital hypotheses, we chose cortical surface analysis methods rather than slice statistical probability mapping. A three- or four-way mixed factorial analysis of variance (ANOVA) design was employed for each primary analysis. The first variable consisted of the two subject groups, and the remaining variables were all repeated measures consisting of the two hemispheres and Brodmann’s areas. For the prefrontal and temporal analyses, a hierarchical grouping of adjacent cortical areas referred to as regions was used (Table 1). For the cingulate, precentral, parietal, and occipital analyses, only one level of repeated measures was used. All analyses involving repeated measures with more than two levels used Greenhouse-Geisser epsilon corrections to adjust probabilities for repeated measures F values. For each ANOVA, if a higher-order interaction effect was statistically significant, we then examined lower-order effects by post hoc tests.
Within the depersonalization disorder group, Pearson’s correlations were performed between dissociation scores and relative glucose metabolic rates for Brodmann’s areas that differed significantly from those of the healthy comparison group. All analyses were two-tailed.

Results

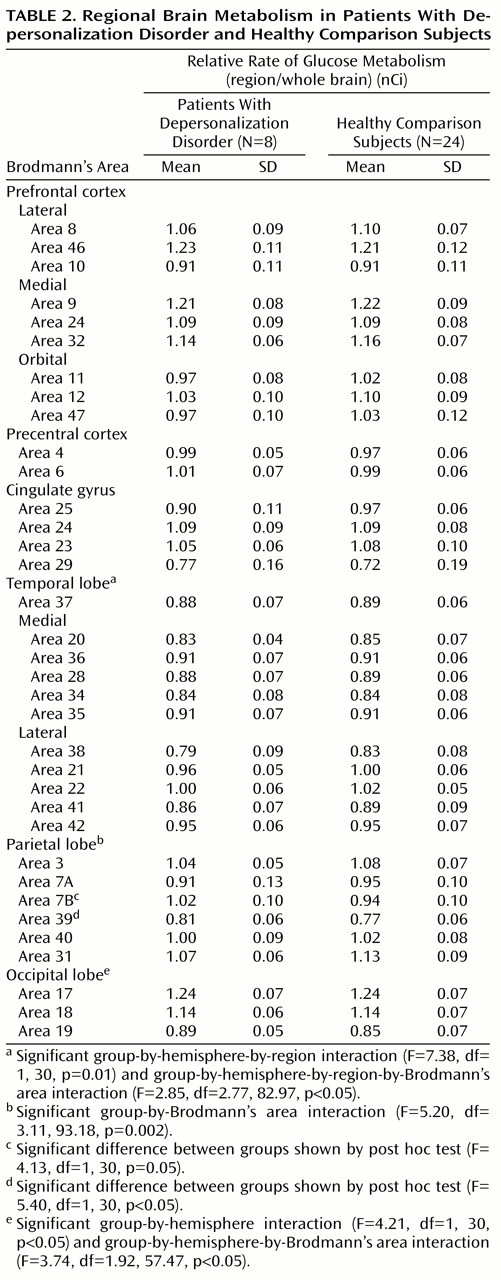
Each analysis was examined for main effect of group and for all higher-order interaction effects. Results are summarized in Table 2, and findings were as follows. No statistically significant differences were found for the prefrontal cortex, precentral cortex, or cingulate cortex.
The temporal lobe was subdivided into medial and lateral regions, each with five Brodmann’s areas. There was a significant group-by-hemisphere-by-region interaction and a significant group-by-hemisphere-by-region-by-Brodmann’s area interaction (Table 2). Post hoc comparisons revealed that the depersonalization disorder group had significantly lower metabolic rates in area 22 of the right superior temporal gyrus (subjects with depersonalization disorder: mean=1.06, SD=0.06; healthy comparison subjects: mean=1.11, SD=0.06; t=2.24, df=30, p<0.05) and in area 21 of the middle temporal gyrus (subjects with depersonalization disorder: mean=0.99, SD=0.05; healthy comparison subjects: mean=1.04, SD=0.05; t=2.61, df=30, p=0.01).
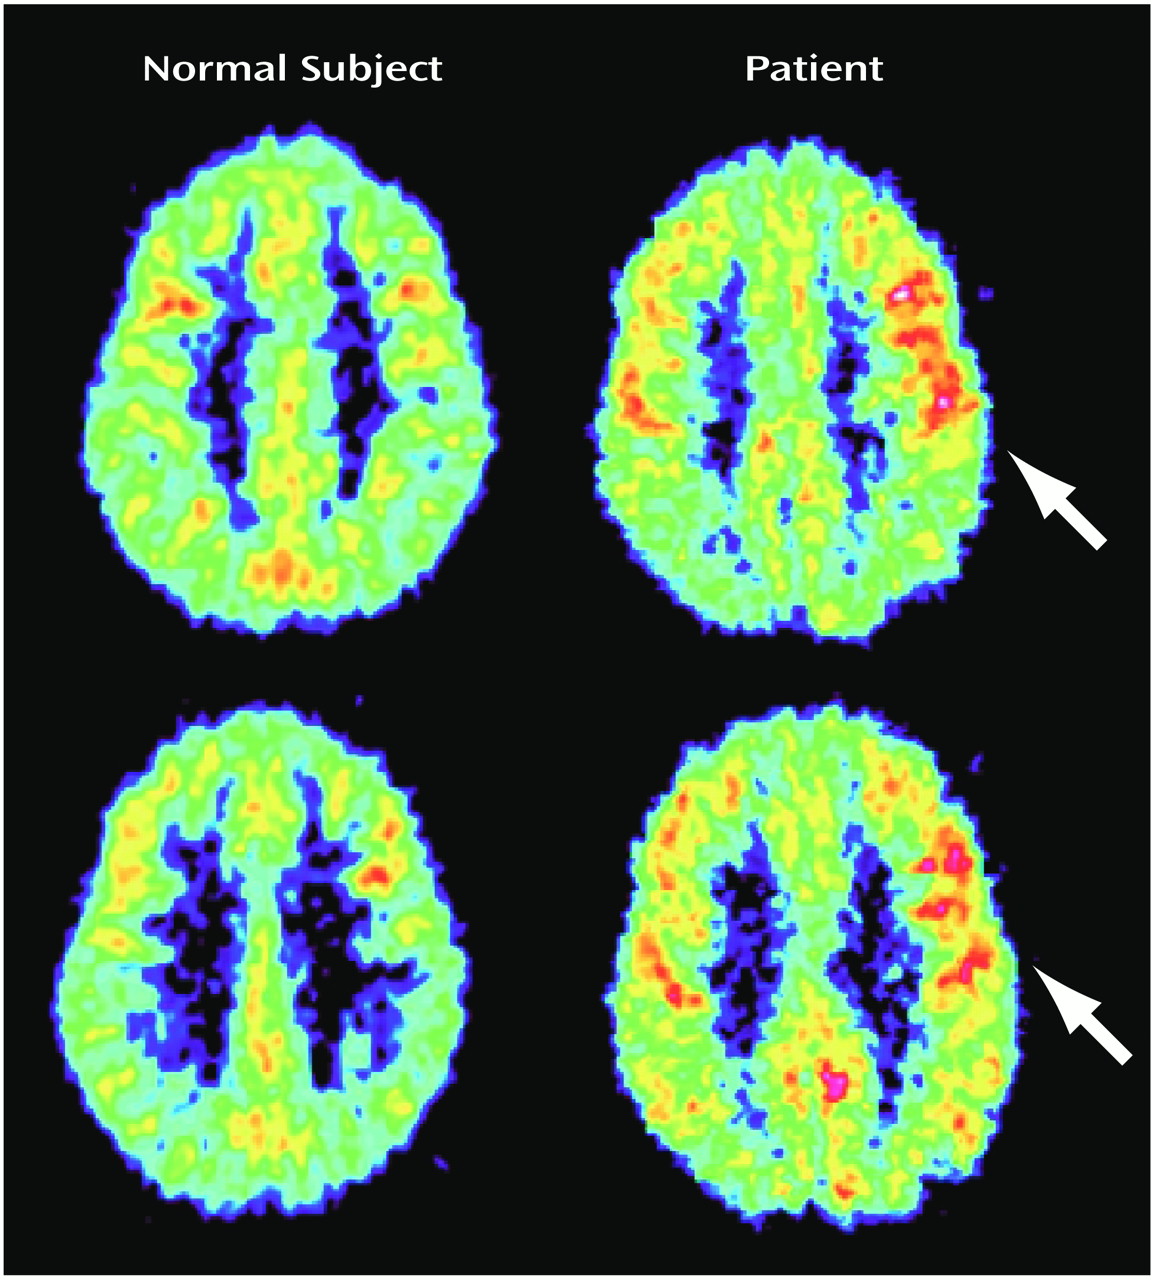
The parietal lobe revealed a significant group-by-Brodmann’s area interaction (Table 2). Post hoc between-group comparisons by Brodmann’s area revealed significantly higher metabolic rates in the depersonalization disorder group for areas 7B and 39 (Figure 1 and Table 2). There was a significant positive correlation of relative glucose metabolic rate with total Dissociative Experiences Scale score and Dissociative Experiences Scale depersonalization score for area 7B (r=0.84, df=6, p<0.01, and r=0.74, df=6, p<0.05, respectively).
The occipital lobe revealed a significant group-by-hemisphere interaction effect and a significant group-by-hemisphere-by-Brodmann’s area interaction (Table 2). Post hoc comparisons revealed a significant group-by-Brodmann’s area interaction for the left occipital lobe (F=3.28, df=1.62, 48.54, p=0.05); left area 19 was significantly more active in the depersonalization disorder group (subjects with depersonalization disorder: mean=0.90, SD=0.05; healthy comparison subjects: mean=0.83, SD=0.07; t=2.37, df=30, p<0.05).
Subsequently, an analysis of the whole brain sensory association cortex was conducted, organized into four functional associative regions consisting of two Brodmann’s areas each (temporal areas 22 and 37, occipital areas 18 and 19, parietal multimodal areas 39 and 40, and parietal somatosensory areas 7B and 23). There was a significant group-by-hemisphere interaction (F=5.49, df=1, 30, p<0.05), with a tendency for depersonalization subjects to have more active association areas in the left hemisphere. There was also a significant group-by-associative-region-by-Brodmann’s area interaction (F=4.78, df=1.78, 53.26, p=0.01), demonstrating that depersonalization disorder subjects had an extensive pattern of altered metabolic activity in the major sensory association areas across brain lobes.

Discussion

The main findings of this first (to our knowledge) functional imaging study of depersonalization disorder point to metabolic abnormalities primarily in the posterior cortex. Subjects with depersonalization disorder differed in relative glucose metabolic rate from comparison subjects in portions of the sensory cortex in the temporal, parietal, and occipital lobes. These specifically included right temporal area 22 (auditory association area), parietal areas 7B (somatosensory association area) and 39 (multimodal association area), and left occipital area 19 (visual association area). Depersonalization disorder subjects were characterized by greater activity than comparison subjects in all these areas, with the exception of area 22, where activity was lower. Analyses of the relative glucose metabolic rate in whole brain sensory cortex confirmed an extensive pattern of significant between-group differences.
These data do not support the primacy of temporal lobe phenomena in depersonalization, described in the introduction (5, 6, 13, 14), but rather, they implicate more extensive associational brain networks, given the prominent occipital and parietal findings. The perceptual alterations that are hallmark symptoms of depersonalization prmarily involve two sensory modalities, visual and somatosensory, although auditory disturbances can also be described. There is a hierarchy of sensory processing in the brain, from primary sensory areas to unimodal and then polymodal association areas and finally to the prefrontal cortex (27). Unimodal association areas showed more activity in depersonalization disorder subjects, both in occipital area 19 of the prestriate visual cortex and parietal area 7B, which is believed to be central to high-order integration within the somatosensory system (28). Dissociation and depersonalization scores showed a strong positive correlation with area 7B activity. Multimodal sensory integration occurs in the region of the parietal-temporal-occipital junction or the inferior parietal lobule (27, 29). Area 39, which corresponds to the angular gyrus and is implicated in somatosensory-visual-auditory integration, was again more active in depersonalization disorder subjects.
It is, however, possible that the differences in metabolic activity identified in this study were somehow related to the task performance itself, although the absence of performance differences on the verbal memory task administered during FDG uptake renders this less likely. In addition, since greater prefrontal activation was not seen in depersonalization, a stronger effort by the depersonalization disorder subjects to achieve similar task scores appears a less likely explanation (30). It is possible that the greater activation observed in depersonalization disorder reflects compensatory adjustment (31), as processing is shifted from right temporal lobe areas 22 and 21 to parietooccipital regions. Such a shifting of cognitive function has been observed with aging (25, 32, 33).
The altered subjective experience of the relationship of the self to the physical body is a uniquely fascinating aspect of depersonalization disorder, as elaborately described by Schilder (34). Individuals with depersonalization disorder commonly feel detached from their physical selves. Disturbances of body schema are primarily based at the parietal-occipital junction around the angular gyrus, where visual and somatosensory information is integrated to provide an intact well-integrated body image (35), which again includes area 39. Indeed, Ackner (36) described inferior parietal and angular tumors manifesting with depersonalization. Maximum overlap of structural lesions in neurology patients suffering from neglect has been found to concentrate in the right inferior parietal lobule (37). We speculate that body schema distortions characteristic of depersonalization might be more subtle, functionally based, less neurologically damaged versions of well-known parietal lobe neurological syndromes such as neglect, finger agnosia, and hemidepersonalization. The psychiatric version might be characterized by an “as if” quality to the experience of bodily detachment, whereas in the neurological version, entire body parts or sides are treated as truly absent or not part of the self.
Additional subjective depersonalization experiences might be accounted for by the dysfunctional areas localized in this study. Depth perception is associated with the visual association cortices of areas 18 and 19 (38) and with the parietal association cortex (39). This might explain the flattened, two-dimensional perspective commonly described in depersonalization. Visuoconstructive abilities such as block constructions and the block design subtest of the WAIS have been localized to the posterior parietal area (38), and dysfunction here could be associated with the inferior WAIS block design performance in depersonalization (2). Subjects with depersonalization sometimes describe difficulty evoking visual imagery, which is thought to be mediated by visual association areas 18 and 19 and by higher-order visual cortical centers at the occipital-temporal-parietal junction (38).
There have been several studies addressing the possible nature and localization of brain dysfunction associated with the symptom of depersonalization (712), although not in subjects with depersonalization disorder. Depersonalization is a common sequel to traumatic head injury, and it appears more likely to occur after mild injury and with high comorbidity for posttraumatic stress disorder, suggesting that predictable anatomical correlates are unlikely in this population (7). In a single subject without other psychiatric history, a quantitative EEG of alcohol-induced transient depersonalization revealed generalized slowing attributed to metabolic encephalopathy (8). In contrast to subjects with panic disorder without depersonalization, subjects with depersonalization during panic attacks show bilateral unresponsiveness and slowing on EEG during normally expected, odor-stimulated temporolimbic activation (9).
We located three functional imaging studies describing the induction of depersonalization in healthy volunteers. Intravenous infusion of THC in 59 subjects resulted in an increase in global cerebral blow flow, most pronounced in the right hemisphere, frontal lobes, and anterior cingulate, with a relative decrease in subcortical structures (10). THC-induced depersonalization was significantly positively correlated with right frontal and right cingulate blood flow. The authors proposed that depersonalization may be a state of heightened activation and emotional consciousness resulting from a cingulate-mediated decoupling between cortical and subcortical structures. In a PET study of psilocybin-induced psychosis in seven healthy volunteers, increases in ventral striatum dopamine significantly correlated with depersonalization (11). However, depersonalization did not appear to be a pure state but rather was associated with significant mood and psychotic-like disturbances. Similarly, in a PET study of amphetamine-induced manic-like states in 10 healthy volunteers, there was a widespread increase in cerebral metabolism that was significant for the anterior cingulate, striatum, and thalamus (12), but again, mood changes were more prominent than depersonalization.
These studies taken together yield interesting but contradictory results regarding brain changes associated with depersonalization, including laterality versus bilaterality, activation versus slowing, localization versus diffuseness, and the regions possibly implicated, such as the frontal, temporal, anterior cingulate, and subcortical areas. These discrepancies could be due to methodological differences as well as sample heterogeneity, i.e., subjects experiencing depersonalization as a symptom in the context of another condition such as epilepsy, encephalopathy, traumatic brain injury or panic disorder, or normal subjects undergoing chemical induction of depersonalization, among other symptoms, by means of various pharmacological agents. It is unclear whether all of these states are phenotypically equivalent to primary depersonalization disorder.
A theoretically extrapolated neurobiological model of depersonalization was proposed recently by Sierra and Berrios (15). Its basic premise is bilateral corticolimbic disconnection, with left medial prefrontal activation and reciprocal amygdala inhibition resulting in hypoemotionality and decreased arousal, and right dorsolateral prefrontal activation with reciprocal anterior cingulate inhibition leading to hypervigilance, attentional difficulties, and mind emptiness. Our own data did not demonstrate changes in prefrontal or cingulate activity and thus do not lend support to this model. Some of the studies previously summarized support the model with regard to prefrontal activation and amygdala inhibition (10), whereas findings of cingulate activation (10, 12) contradict the model. Sierra and Berrios also suggested that in order to explain how depersonalization can be sensory-modality specific in different patients, the putative disconnection may occur at an earlier stage of emotional processing; such an hypothesis is more in accordance with the sensory cortical findings of this study.
In conclusion, the findings of this first (to our knowledge) functional imaging study of depersonalization disorder suggest abnormalities primarily along sequential hierarchical areas, unimodal and cross-modal, of the visual, somatosensory, and auditory processing pathways, as well as in areas responsible for an integrated body schema. They seem to be in good concordance with the phenomenological conceptualization of depersonalization disorder as the dissociative disorder in which there is a failure to integrate perception with the sense of self, as well as with specific experiences that subjects describe. Further clarification of the role of the limbic system and the amygdala, in particular, is needed, as affective memory connections to past experience could play an important role in making new perceptions feel familiar and real (40). The limitations of this study include the relatively small study group size, the use of a memory rather than a depersonalization induction task, and the use of relative rather than absolute metabolic rate of glucose. Depersonalization is a relatively rare disorder, but we have increased the study’s statistical power by adding a larger group of age- and sex-matched healthy comparison subjects. The study would have required 44 patients for it to be able to detect a group difference in the dorsolateral prefrontal cortex given the observed effect size, but we did confirm parietal, occipital, and temporal lobe differences that had much larger effect sizes. We considered a variety of cognitive or introspective tasks, but the validity and reliability of memory tasks, task applicability to healthy comparison subjects, and moreover, the possible relationship of memory function to the illusion of unfamiliarity recommended the current task. Last, we examined metabolism relative to whole brain metabolic rate rather than absolute rate, in micromoles per 100 grams per minute. This analysis of ratio numbers allows individual differences in global brain metabolic rates to be removed, a correction made with either ratios or linear covariance in a large majority of current reports. If a small number of small areas had similar values in absolute metabolic rates in both groups while the remaining large areas of the brain had higher metabolic rates in the patient group, misleading lower rates in the small areas could possibly be reported for patients. However, it is well known that sensory task activation tends to be expressed with greater statistical power when correction for global brain variation is removed. Higher test-retest correlations over time have been observed with ratio than with absolute metabolic rate data (41), as well as with blood flow data from single photon emission computed tomography (42), suggesting that ratio data are appropriate for examination of regional metabolic trait differences between groups. Furthermore, the nature of the limited and specific behavioral deficits of depersonalization do not suggest a large and diffuse cortical change but rather one focused on limited cortical areas, as noted earlier.
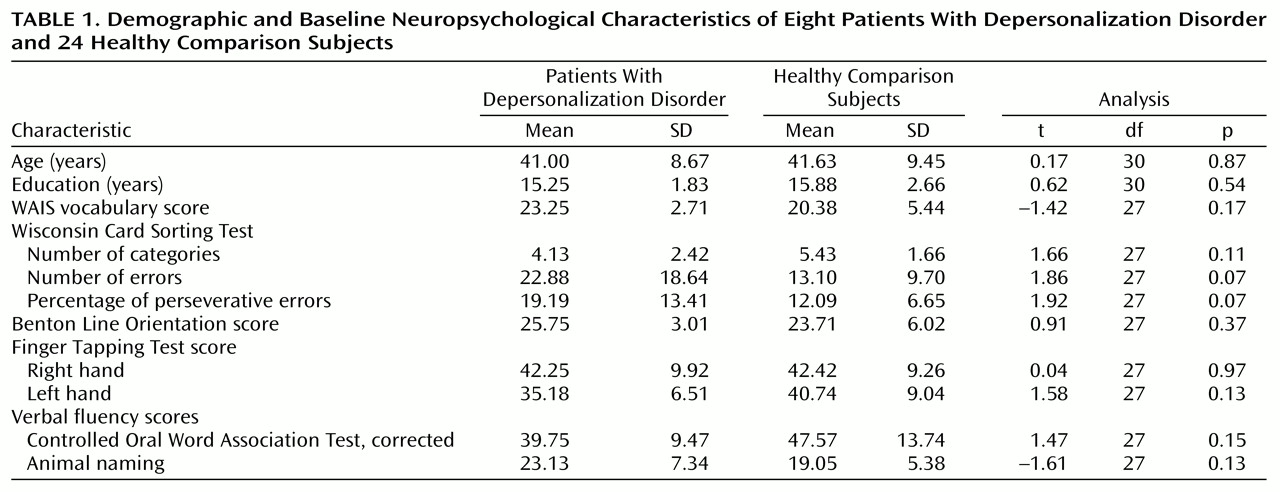
TABLE 1
TABLE 2
Figure 1. PET Images of the Brains of a Healthy Comparison Subject and a Patient With Depersonalization Disorder at Two Consecutive Levels in the Parietal Lobea
aHigher relative metabolic activity (region/whole brain) in the patient with depersonalization disorder occurred in the parietal association areas in more dorsal (Brodmann’s area 7B) and ventral (Brodmann’s area 39) regions.

Footnote

Received Oct. 19, 1999; revision received May 8, 2000; accepted May 15, 2000. From the Department of Psychiatry, Mount Sinai School of Medicine. Address reprint requests to Dr. Simeon, Psychiatry Box 1230, Mount Sinai School of Medicine, One Gustave Levy Place, New York, NY 10029; daphne.simeon@ mssm.edu (e-mail).Supported in part by NIMH grants MH-55582 (to Dr. Simeon) and MH-40071 (to Dr. Buchsbaum). The Dana Foundation provided support for the healthy comparison group.

References

1.
Simeon D, Gross S, Guralnik O, Stein DJ, Schmeidler J, Hollander E: Feeling unreal:30 cases of DSM-III-R depersonalization disorder. Am J Psychiatry 1997; 154:1107–1113
2.
Guralnik O, Schmeidler J, Simeon D: Feeling unreal: cognitive processes in depersonalization. Am J Psychiatry 2000; 157:103–109
3.
Melges FT, Tinklenber JR, Hollister LE, Gillespie HK: Temporal disintegration and depersonalization during marijuana intoxication. Arch Gen Psychiatry 1970; 23:204–210
4.
Simeon D, Hollander E, Stein DJ, DeCaria C, Cohen LJ, Saoud JB, Hwang M: Induction of depersonalization by the serotonin agonist m-CPP. Psychiatry Res 1995; 138:161–164
5.
Kenna JC, Sedman G: Depersonalization in temporal lobe epilepsy and the organic psychoses. Br J Psychiatry 1965; 111:293–299
6.
Devinsky O, Putnam F, Grafman J, Bromfield E, Theodore WH: Dissociative states and epilepsy. Neurology 1989; 39:835–840
7.
Grigsby J, Kaye K: Incidence and correlates of depersonalization following head trauma. Brain Injury 1993; 7:507–513
8.
Raimo EB, Roemer RA, Moster M, Shan Y: Alcohol-induced depersonalization. Biol Psychiatry 1999; 45:1523–1526
9.
Locatelli M, Bellodi L, Perna G, Scarone S: EEG power modifications in panic disorder during a temporolimbic activation task: relationships with temporal lobe clinical symptomatology. J Neuropsychiatry Clin Neurosci 1993; 5:409–414
10.
Mathew RJ, Wilson WH, Chiu NY, Turkington TG, Degrado TR, Colemna RE: Regional cerebral blood flow and depersonalization after tetrahydrocannabinol administration. Acta Psychiatr Scand 1999; 100:67–75
11.
Vollenweider FX, Vontobel P, Hell D, Leenders KL:5-HT modulation of dopamine release in basal ganglia in psilocybin-induced psychosis in man—a PET study with [11C]raclopride. Neuropsychopharmacology 1999; 20:424–433
12.
Vollenweider FX, Maguire RP, Leenders KL, Mathys K, Angst J: Effects of high amphetamine dose on mood and cerebral glucose metabolism in normal volunteers using positron emission tomography (PET). Psychiatry Res Neuroimaging 1998; 83:149–162
13.
Penfield W, Rasmussen T: The Cerebral Cortex of Man: A Clinical Study of Localization of Function. New York, Macmillan, 1950, pp 157–181
14.
Hollander E, Carrasco JL, Mullen LS, Trungold S, DeCaria C, Towey J: Left hemispheric activation in depersonalization disorder: a case report. Biol Psychiatry 1992; 31:1157–1162
15.
Sierra M, Berrios GE: Depersonalization: neurobiological perspectives. Biol Psychiatry 1998; 44:898–908
16.
Steinberg M: Interviewer’s Guide to the Structured Clinical Interview for DSM-IV Dissociative Disorders (SCID-D). Washington, DC, American Psychiatric Press, 1993
17.
Bernstein EM, Putnam FW: Development, reliability, and validity of a dissociation scale. J Nerv Ment Dis 1986; 174:727–735
18.
Simeon D, Guralnik O, Gross S, Stein DJ, Schmeidler J, Hollander E: The detection and measurement of depersonalization disorder. J Nerv Ment Dis 1998; 186:536–542
19.
Oldfield RC: The assessment and analysis of handedness: the Edinburgh Inventory. Neuropsychologia 1971; 9:97–113
20.
Wechsler D: Manual for the Wechsler Adult Intelligence Scale—Revised. San Antonio, Tex, Psychological Corp, 1981
21.
Heaton RK, Chelune GJ, Talley JL, Kay GG, Curtiss G: Wisconsin Card Sorting Test Manual. Odessa, Fla, Psychological Assessment Resources, 1993
22.
Benton AL, Hamsher K de S, Varney NR, Spreen O: Contributions to Neuropsychological Assessment: A Clinical Manual. New York, Oxford University Press, 1983
23.
Reitan RM: Manual for Administration of Neuropsychological Test Batteries for Adults and Children. Tucson, Ariz, Reitan Neuropsychological Laboratory, 1979
24.
Spreen O, Benton AL: Neurosensory Center Complete Examination for Aphasia (NCCEA). Victoria, BC, University of Victoria Neuropsychological Laboratory, 1977
25.
Hazlett EA, Buchsbaum MS, Mohs RC, Spiegel-Cohen J, Wei TC, Azueta R, Haznedar MM, Singer MB, Shihabuddin L, Luu-Hsia C, Harvey PD: Age-related shift in brain region activity during successful memory performance. Neurobiol Aging 1998; 19:437–445
26.
Hazlett EA, Buchsbaum MS, Haznedar MM, Singer MB, Germans MK, Schnur DB, Jimenez EA, Buchsbaum BR, Troyer BT: Prefrontal cortex glucose metabolism and startle eyeblink modification abnormalities in unmedicated schizophrenia patients. Psychophysiology 1998; 35:186–198
27.
Fuster J: The Prefrontal Cortex: Anatomy, Physiology and Neuropsychology of the Frontal Lobe, 3rd ed. Philadelphia, Lippincott-Raven, 1997
28.
Paulesu E, Frackowiak RSJ, Bottini G: Maps of somatosensory systems, in Human Brain Function. Edited by Frackowiak RSJ, Friston KJ, Frith CD, Dolan RJ, Mazziotta JC. New York, NY, Academic Press, 1997, pp 183–242
29.
Stuss DT, Benson DF: The Frontal Lobes. New York, Raven Press, 1986
30.
Furey ML, Pietrini P, Haxby JV, Alexander GE, Lee HC, VanMeter J, Grady CL, Shetty U, Rapoport SI, Schapiro MB, Freo U: Cholinergic stimulation alters performance and task-specific regional cerebral blood flow during working memory. Proc Natl Acad Sci USA 1997; 94:6512–6516
31.
Haxby JV, Grady CL, Ungerleider LG, Horwitz B: Mapping the functional neuroanatomy of the intact human brain with brain work imaging. Neuropsychologia 1991; 29:539–555
32.
Grady CL, McIntosh AAR, Bookstein F, Horwitz B, Rapoport SI, Haxby JV: Age-related changes in regional cerebral blood flow during working memory for faces. Neuroimage 1998; 8:409–425
33.
Cabeza R, McIntosh AR, Tulving E, Nyberg L, Grady CL: Age-related differences in effective neural connectivity during encoding and recall. Neuroreport 1997; 8:3479–3483
34.
Schilder P: The Image and Appearance of the Human Body. New York, International Universities Press, 1950
35.
Benton A, Sivan AB: Disturbances of body schema, in Clinical Neuropsychology, 3rd ed. Edited by Heilman KM, Valenstein E. Oxford, UK, Oxford University Press, 1993, pp 123–140
36.
Ackner B: Depersonalization, I: aetiology and phenomenology. J Ment Sci 1954; 100:838–872
37.
Vallar G, Perani D: The anatomy of unilateral neglect after right hemisphere stroke lesions: a clinical CT/scan correlation study in man. Neuropsychologia 1986; 24:609–622
38.
Benton A, Tranel D: Visuoperceptual, visuospatial, and visuoconstructive disorders, in Clinical Neuropsychology, 3rd ed. Edited by Heilman KM, Valenstein E. Oxford, UK, Oxford University Press, 1993, pp 165–213
39.
Sakata H, Taira M, Kusunoki M, Murata A, Tanaka Y: The parietal association cortex in depth perception and visual control of hand action. Trends Neurosci 1997; 20:350–357
40.
Cahill L, Babinsky R, Markowitsch HJ, McGaugh JL: The amygdala and emotional memory. Nature 1995; 377:295–296
41.
Bartlett E, Brodie J, Wolf A, Christman D, Laska E, Meissner M: Reproducibility of cerebral glucose metabolic measurements in resting human subjects. J Cereb Blood Flow Metab 1988; 8:502–512
42.
Gullion CM, Devous MD Sr, Rush AJ: Effects of four normalizing methods on data analytic results in functional brain imaging. Biol Psychiatry 1996; 40:1106–1121

Information & Authors

Information

Published In

Go to American Journal of Psychiatry
American Journal of Psychiatry
Pages: 1782 - 1788
PubMed: 11058475

History

Published online: 1 November 2000
Published in print: November 2000

Authors

Details

Erin A. Hazlett, Ph.D.
Jacqueline Spiegel-Cohen, M.Sc.
Monte S. Buchsbaum, M.D.

Metrics & Citations

Metrics

Citations

Export Citations

If you have the appropriate software installed, you can download article citation data to the citation manager of your choice. Simply select your manager software from the list below and click Download.

For more information or tips please see 'Downloading to a citation manager' in the Help menu.

Format
Citation style
Style
Copy to clipboard

View Options

View options

PDF/EPUB

View PDF/EPUB

Get Access

Login options

Already a subscriber? Access your subscription through your login credentials or your institution for full access to this article.

Personal login Institutional Login Open Athens login
Purchase Options

Purchase this article to access the full text.

PPV Articles - American Journal of Psychiatry

PPV Articles - American Journal of Psychiatry

Not a subscriber?

Subscribe Now / Learn More

PsychiatryOnline subscription options offer access to the DSM-5-TR® library, books, journals, CME, and patient resources. This all-in-one virtual library provides psychiatrists and mental health professionals with key resources for diagnosis, treatment, research, and professional development.

Need more help? PsychiatryOnline Customer Service may be reached by emailing [email protected] or by calling 800-368-5777 (in the U.S.) or 703-907-7322 (outside the U.S.).

Media

Figures

Other

Tables

Share

Share

Share article link

Share