Patient Selection
A total of 194 women meeting the DSM-III-R criteria for bulimia nervosa entered the study and were treated with cognitive behavior therapy. Participants were recruited from advertisements in the local media and from eating disorders clinics. Potential participants were first screened by telephone to ascertain their eligibility for the study. Of 851 individuals calling the three treatment centers, 592 were screened out; the major reasons were not meeting the binge-eating or purging frequency criteria for bulimia nervosa, having been treated with an adequate trial of an antidepressant medication, or not being interested in the study. Hence, 259 individuals were offered appointments for further screening, 39 of whom did not keep their appointments. At the interview, the study procedures were described in detail and the potential participants then gave their written consent to participate. A further 26 individuals were screened out at this interview; the principal reason was the absence of one or more criteria for the diagnosis of bulimia nervosa. Therefore, the final number of subjects was 194. Other exclusion factors were current anorexia nervosa, current alcohol or drug abuse, associated severe physical or psychiatric illness (e.g., psychosis, significant suicidal risk, cancer), use of any medication known to affect weight, current psychiatric or psychotherapeutic treatment, or an adequate trial of an antidepressant medication or cognitive behavior therapy. During the treatment phase of the study, six participants were withdrawn: one became pregnant, four developed major depression requiring antidepressant medication, and one developed a manic episode.
The mean age of the participants was 28.1 years (SD=7.9); of the 188 remaining participants, 88% were white (N=166), 5% were African American (N=10), 3% were Hispanic (N=6), and 3% were Asian (N=6). Two-thirds (66%, N=124) had never married, 24% were currently married (N=45), and 10% were divorced (N=19). The participants reported that their bulimic symptoms had begun an average of 10.2 years (SD=7.6) before the study. Their median rate of binge eating was 21.0 episodes during a 4-week period, and their median rate of purging was 34.0 episodes over 4 weeks. Nearly one-quarter of the participants (22%, N=42) reported a previous episode of anorexia nervosa, 59% had a past history of major depression (N=110), and 23% had a current major depression (N=43). Personality disorders were diagnosed in 43% of the participants (N=81); of these disorders, about one-half were in cluster B.
Assessments
The patients were assessed before treatment through both structured interviews and questionnaires. Weight and height were measured in order to calculate body mass index. Psychopathology was assessed by using the Structured Clinical Interview for DSM-III-R
(22). Specific eating-related pathology was assessed before and after treatment by using the Eating Disorder Examination ratings for frequencies of binge eating and purging, dietary restraint, and concern about weight, shape, and eating
(23). During treatment the number of purging episodes during the previous week was recorded at 2-week intervals by means of a computerized questionnaire assessment.
Administration of questionnaires was aimed at further assessing 1) specific eating-related pathology, 2) aspects of general psychopathology particularly pertinent to bulimia nervosa, and 3) interpersonal functioning. In the first category the questionnaire used was the Bulimic Thoughts Questionnaire, a measure of bulimic cognitions
(24) and self-efficacy in terms of overcoming binge eating and purging
(25). In the second category were the Beck Depression Inventory
(26), the Rosenberg Self-Esteem Scale
(27), and the impulsivity scale of the Multidimensional Personality Questionnaire
(28). In the third category were the Inventory of Interpersonal Problems
(29), a measure of interpersonal relationships, and the questionnaire form of the Social Adjustment Scale
(30).
Posttreatment status was derived from Eating Disorder Examination interviews, allowing classification of the participants as responders (no binge eating or purging during the past 4 weeks) or nonresponders. The reliability of this measure was determined for 20 participants. With the exception of subjective binges, which were not used in this study, agreement on all measures exceeded r=0.90.
Statistical Analysis
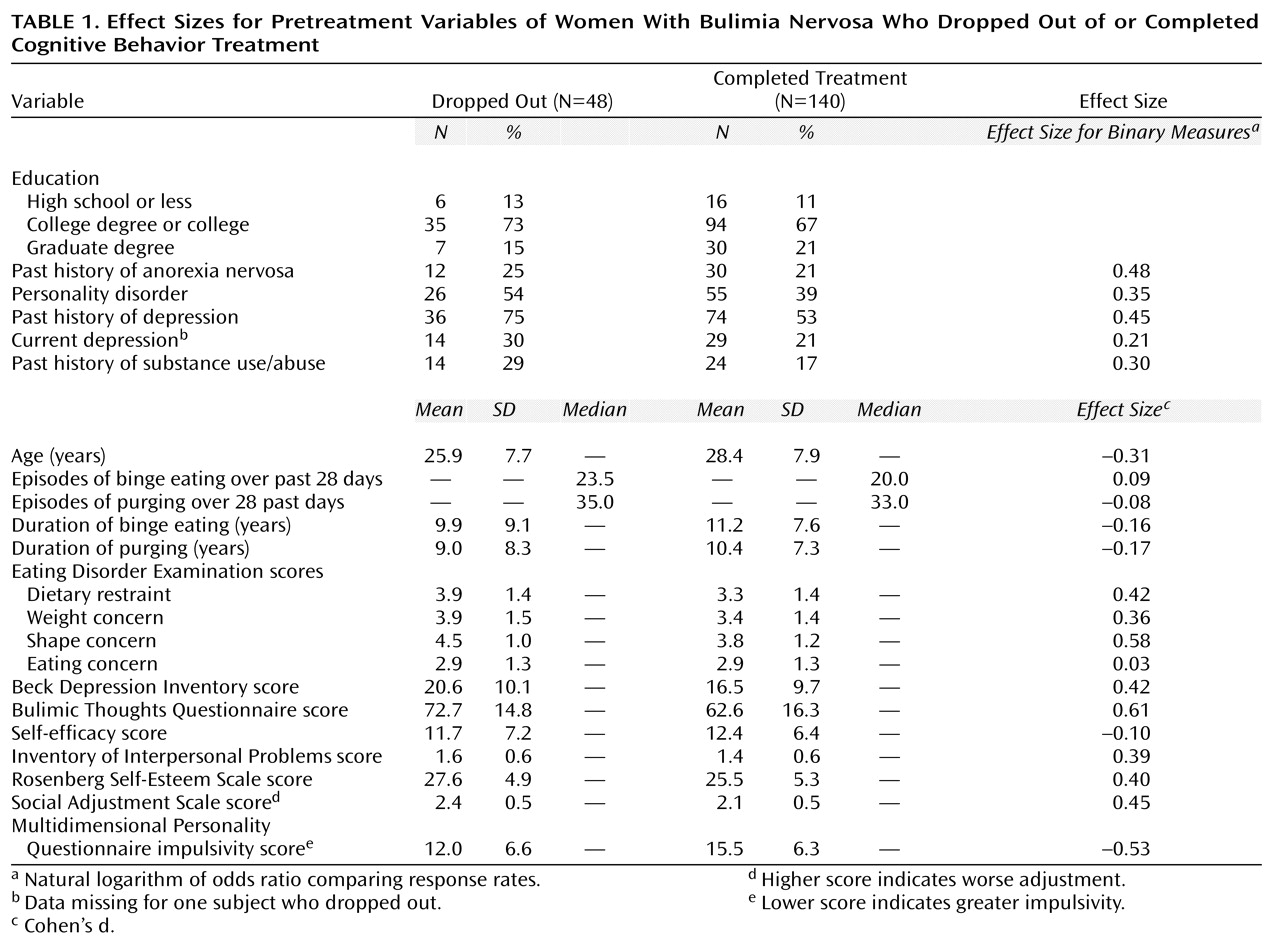
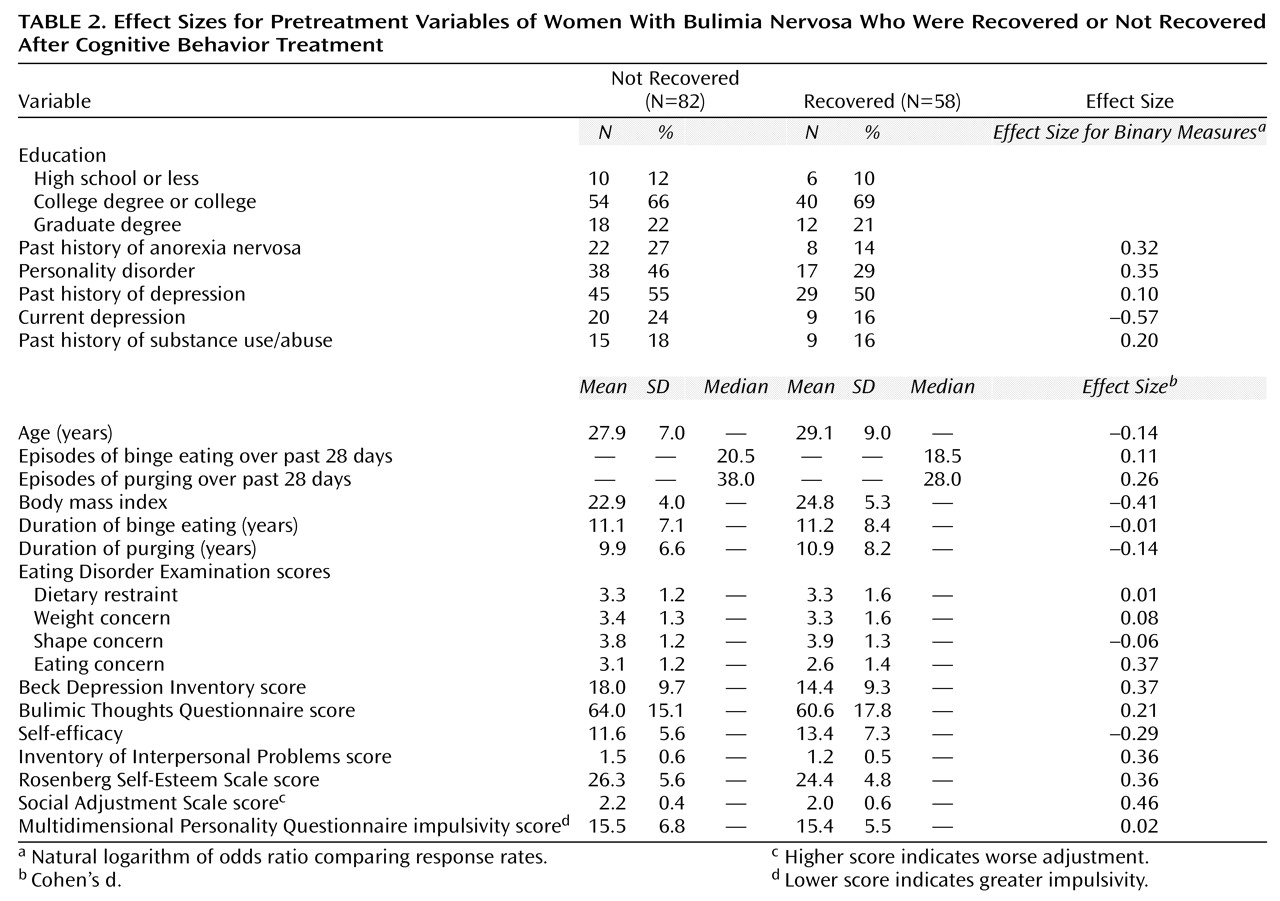
The analytic approach used here was descriptive and hypothesis generating, rather than hypothesis testing. In the first phase of the analysis, the pretreatment characteristics of the dropouts were compared with those of the patients who completed treatment, and the treatment responders were compared with the nonresponders. For continuous outcome measures, Cohen’s d (the standardized mean difference between the groups) was used as an effect size. For binary outcome measures, the natural logarithm of the odds ratio comparing the response rates of the two groups was used. While there are no absolute standards of what constitutes small, medium, and large effect sizes, generally 0.2 (odds ratio=1.2) is considered small, 0.5 (odds ratio=1.6) is considered moderate, and 0.8 (odds ratio=2.2) is considered large.
Because adequate prediction of success and failure often requires use of combinations of, rather than individual, variables, the next step was based on use of signal detection. This method was used to determine the most sensitive and specific algorithm to, first, identify treatment dropouts and, second, identify treatment nonresponders
(31). Signal detection is a well-established procedure, in many ways ideally suited to clinical decision making but not as familiar in this context as are standard parametric methods, such as multiple logistic regression analysis or multiple linear discriminant analysis. However, signal detection has major advantages over these methods:
1. Signal detection is nonparametric and distribution free, whereas multiple logistic regression analysis involves linearity assumptions and multiple linear discriminant analysis, in addition, assumes multivariate normal distributions.
2. Signal detection leads to an “and/or” rule that identifies which patients require attention and which not, a rule that clinicians find easy to apply in practice. In contrast, multiple logistic regression analysis and multiple linear discriminant analysis result in weighted averages of predictors, which are cumbersome for clinicians to compute for individual patients and which, at best, order patients in terms of their need for attention. These are typically useful in research applications but often are difficult for clinicians to apply to individual patients.
3. Signal detection explicitly requires an evaluation of the relative clinical importance of false positives and false negatives. Multiple logistic regression analysis and multiple linear discriminant analysis, by their nature, place equal importance on both, whatever the clinical situation.
4. Signal detection is highly sensitive to interactive effects of predictors. Multiple logistic regression analysis and multiple linear discriminant analysis, like other linear models, require inclusion of all “main effects” before interactions can be considered. As a result, they have relatively low power to detect even strong interactions.
5. Signal detection can identify different subgroups of subjects who have similar probabilities of the outcome but for different reasons. Multiple logistic regression analysis and multiple linear discriminant analysis would merely identify these subjects as having similar probabilities. As a result, the clinician is not alerted to the fact that the type of attention needed might differ among these subgroups.
6. Signal detection can take the costs of evaluations into consideration, although this capacity was not used here. Multiple logistic regression analysis and multiple linear discriminant analysis cannot take costs into consideration.
7. Signal detection, multiple logistic regression analysis, and multiple linear discriminant analysis, when used stepwise, as done here, all are hypothesis-generating, not hypothesis-testing, methods. This limitation is often overlooked in consideration of the results of multiple logistic regression analysis and multiple linear discriminant analysis, but it is hard to overlook in the use of signal detection methods.
Briefly, at the first step, signal detection considers each possible predictor (including a range of different cutoff points for any ordinal predictor). For each, it computes the sensitivity and specificity of that “test” against the outcome. Using the selected weighting of the relative clinical importance of false positives and false negatives, it finds the optimal predictor (and optimal cutoff point for an ordinal predictor). This is then used to split the initial population into two subsets, the one positive on the first “test” and the one that is negative. The process is repeated on each of these two subsets. At this stage the same “test” may be found for both subsets (which would then act like a “main effect” in a linear model) or two different “tests” (like an “interaction”). The process is then repeated on each of the resulting four subsets, then on the resulting eight subsets, etc., ultimately creating a decision tree. The process stops when there are no more “tests,” when the sample size in some subset is too small, or when the optimal test does not achieve some preset criterion (often a statistically significant two-by-two chi-square test at the 5% level, here used as a stopping rule, not as a testing procedure for an a priori hypothesis).


