PTSD was initially considered to be strictly psychological in nature, and it was conceptualized as the prototypical stress-related mental disorder. However, the low prevalence of PTSD among trauma victims suggests that PTSD is not merely a normal response to extreme stressors
(8,
9). Furthermore, several lines of data have converged to reveal specific neurobiological alterations in this psychiatric condition
(10,
11). To date, most work on the neurobiology of PTSD has focused on characterization of abnormal psychophysiological responses to stimuli reminiscent of the trauma
(12–
16), but it is clear that PTSD symptoms invade everyday life for most patients.
Three different lines of electrophysiological research also suggest limbic dysfunction in PTSD. In 1993, McFarlane and colleagues
(24) found that patients with PTSD show reduced amplitude of the P300 component of auditory event-related brain potentials elicited in a traditional “odd-ball” task. P300 in the odd-ball task is believed to reflect contextual updating of mnemonic information, and it is sometimes argued that reduced P300 amplitudes indicate hippocampal dysfunction. The basic P300 finding in PTSD has been replicated by Charles et al.
(25) and Metzger et al.
(26), but it should be noted that P300 is not a unitary response. Rather, there are at least two subcomponents of the response, P3a and P3b. The P300 response elicited in the odd-ball task is mostly a P3b response. It is maximal at the vertex, and as indicated, it is believed to reflect mnemonic functioning. P3a is elicited by novel, orienting stimuli, has a more frontal scalp distribution than P3b, and is more closely associated with a startle response. Several studies have demonstrated that PTSD patients show enhanced P3a responses to emotionally charged and trauma-related stimuli (e.g., reference
27). Thus, patients with PTSD appear to show enhanced P3a reactivity but reduced P3b reactivity.
Finally, subjects with PTSD have been shown to demonstrate abnormal stimulus-response intensity functions for the P200 component of auditory event-related brain potentials. Normally, there is an increase in the amplitude of exogenous event-related brain potential components as stimulus intensity is increased. This profile is typically referred to as an augmentation pattern. Paige et al.
(29) found that subjects with combat-related PTSD often fail to show P200 response augmentation. Rather, many show a reduction pattern in which the P200 response to loud sounds is smaller than the response to sounds of intermediate intensity. With very loud sounds (>120 dB), it is possible to show that normal subjects ultimately enter into a state of protective inhibition with decreased responsivity, but many PTSD subjects appear to reach this state at much lower sound intensities (90–100 dB). This observation has been taken to indicate that these subjects live in a state of persistent overarousal from which even a relatively low-intensity stimulus triggers the limbic system to impose protective inhibition on the cortex and brainstem
(30,
31). Unfortunately, the generality of the initial finding of Paige et al. in PTSD has recently been called into question by a study of McPherson and colleagues
(32), who found increased P200 intensity functions in abused children with PTSD. Clarification and replication of the augmentation/reduction findings in combat-related PTSD is of particular import, since individual augmenting versus reducing profiles may be predictive of treatment response, as has been shown in depression
(33). The present study was thereby designed to reevaluate augmentation/reduction profiles in a large cohort of patients with combat-related PTSD.
Method
Subjects
Thirty-six veterans with combat-related PTSD and a comparison group of 20 subjects without any history of psychopathology (as assessed with the Structured Clinical Interview for DSM-IV Disorders, nonpatient edition [SCID-I/NP]
[34]) were evaluated. All subjects were male and had no history of significant head injury, neurological disease, audiological problems, or severe medical illness. Before the study, the nature of the investigation was explained to all subjects and signatures were obtained on consent forms approved by the Human Subjects Institutional Review Boards of the Albuquerque Department of Veterans Affairs (VA) Medical Center, the University of New Mexico School of Medicine, and the University of Utah School of Medicine.
Normal subjects were recruited from colleagues and staff at the Albuquerque VA Medical Center (N=16) or the University of Utah School of Medicine (N=4). All had no evidence of psychopathology as determined by the SCID-I/NP. The group was multiethnic and included Hispanic (N=5), Oriental (N=1), and Caucasian (N=14) subjects who were a mean age of 37.1 years. None of the subjects in this group had ever been prescribed psychotropic medications.
PTSD subjects were all recruited from the outpatient PTSD program of the Albuquerque VA Medical Center. The population was multiethnic and included Hispanic (N=16), African American (N=2), Native American (N=2), and Caucasian (N=16) veterans who were a mean age of 52.6 years. The PTSD diagnosis was determined with the SCID-I/P
(35). Patients were also evaluated with the Clinician-Administered PTSD Scale
(36), the Mississippi Scale for Combat-Related PTSD
(37,
38), and the Hamilton Depression Rating Scale
(39) and Hamilton Anxiety Rating Scale
(40).
The use of psychotropic medications was not considered as exclusionary to membership in the PTSD group. Twenty-two of the patients with PTSD were being treated with antidepressant medications, including sertraline, doxepin, nefazodone, trazodone, fluoxetine, and bupropion. Six of these patients were also taking antianxiolytic medications (including oxazepam, diazepam, buspirone, and lorazepam), and three were receiving divalproex, an anticonvulsant.
Because of its very high prevalence in PTSD, comorbid depression was not considered as an exclusionary criterion for membership in the PTSD group. Similarly, PTSD patients with a history of prior alcohol abuse were not excluded, provided that they did not meet criteria for alcohol dependence for the 6 months preceding the study. To control for these factors, combat experience, and age, we also compared data from the PTSD patients with data that had been obtained from 10 combat veterans (mean age=55.8 years) with major depression but no history of PTSD and eight combat veterans (mean age=58.6 years) with a history of chronic alcohol abuse but no history of PTSD or major depression.
Stimulus Paradigm
Twenty-five pseudorandomly ordered blocks of auditory stimuli were presented during a single, 30-minute long recording session. Each block consisted of 22 consecutive presentations of a 2000-Hz tone of a fixed intensity. Intensities evaluated across blocks were 65, 72.5, 80, 87.5, or 95 dB (SPL). Five blocks (110 stimuli total) were given at each intensity. Individual tone pips were 50 msec in duration with 5-msec rise and fall times. Stimuli were presented binaurally through tube insert earphones (Etymotic Research, Elk Grove Village, Ill.). The interstimulus interval varied in a pseudorandom fashion between 1.2 and 2.0 seconds. Stimulus generation and presentation were controlled through the STIM software package (Neuroscan, Herndon, Va.). During testing, subjects were instructed to listen to the tones while sitting quietly with eyes closed.
Recording Procedure
EEG data were collected by using a 30-channel electrode cap with electrode placements that included the 19 standard sites of the International 10-20 System
(41). Each scalp electrode was referenced to the right mastoid. One channel of vertical electro-oculograph (EOG) data was recorded with one electrode above the left eye and one just below the right outer canthus. Data were collected by using Syn-Amps controlled through the SCAN software package (Neuroscan, Herndon, Va.). Data were filtered online (band-pass, 0.1–100 Hz) and digitized at 256 samples/second. Data epochs included 250 msec prestimulus and 750 msec poststimulus. Individual trials in which the EOG signal exceeded 50 μV from baseline were rejected. Online averages to each stimulus intensity were formed by using the SCAN software.
EEG Data Analysis
The first step of analysis involved digital re-referencing of the data to linked mastoids. This and all EEG data manipulations were performed by using SCAN software. The data were then subjected to additional digital filtering (band-pass, 2–30 Hz) and baseline correction. Only results at the Cz electrode are reported. Cz has been the focus of most augmentation/reduction studies (e.g.,
30,
41), and this is the electrode site at which the exogenous auditory event-related potential components demonstrate their greatest magnitude. N100 was identified as the largest vertex negative component between 80 and 140 msec. P200 was identified as the largest vertex positive component between 180 and 250 msec. In each case, the baseline-to-peak value was taken as the magnitude of the response. For five of the subjects with PTSD, N100 and P200 components were very difficult to identify, with peak values less than 1 μV. The data from these subjects were felt to be so compromised and unreliable that they were not included in subsequent analyses.
Once all values were calculated, two-way mixed-model analyses of variance were used to investigate the nature of the relationship between tone intensity level (dB) and waveform amplitudes for N100 and P200 separately. The dependent variable was waveform amplitude (μV) with one between-subjects factor (group membership) and one within-subjects factor (tone intensity). Also, for each individual subject, the linear regression function relating stimulus and response intensities was calculated separately for N100 and P200 components. Individual response patterns were classified as augmenting if an overall increase in response intensity as a function of stimulus intensity was indicated. Patterns were classified as reducing if the functions showed decreased responsivity with increasing intensity. Once subjects were identified as showing augmentation or reduction patterns for N100 and P200, multivariate statistical procedures were used to examine the relationships between response profile (augmentation versus reduction) and specific clinical variables obtained as part of the diagnostic evaluation.
In considering the relationship between individual electrophysiological profiles and clinical profiles of PTSD, it was deemed useful to have a single score that reflected overall PTSD symptom severity. Toward this end, the B, C, and D subscale scores from the Clinician-Administered PTSD Scale (which reflect the symptoms of reexperiencing, avoidance, and arousal, respectively) were normalized (z-scored) and combined to create a single overall Clinician-Administered PTSD Scale total score. This Clinician-Administered PTSD Scale total score was then restandardized and combined with a standardized score from the Mississippi scale to generate a single overall measure of symptom severity.
Results
All of the healthy comparison subjects demonstrated clearly identifiable responses for the N100 and P200 components at all stimulus intensities. Five of the 36 patients with PTSD demonstrated poor quality auditory event-related brain potentials in which neither N100 nor P200 components exceeded prestimulus baseline variability. In four cases, this could be attributed to the low number of trials that were counted in the averages (because of high rates of eye blink and movement artifacts). In the fifth case, an adequate number of trials were collected in each condition, but the response was nevertheless poor, despite normal peripheral hearing. Because component magnitudes could not be determined reliably for these subjects, their data were excluded from subsequent analyses. Hence, subsequent results focus on the data from the 31 PTSD patients for whom augmentation versus reduction patterns could be defined.
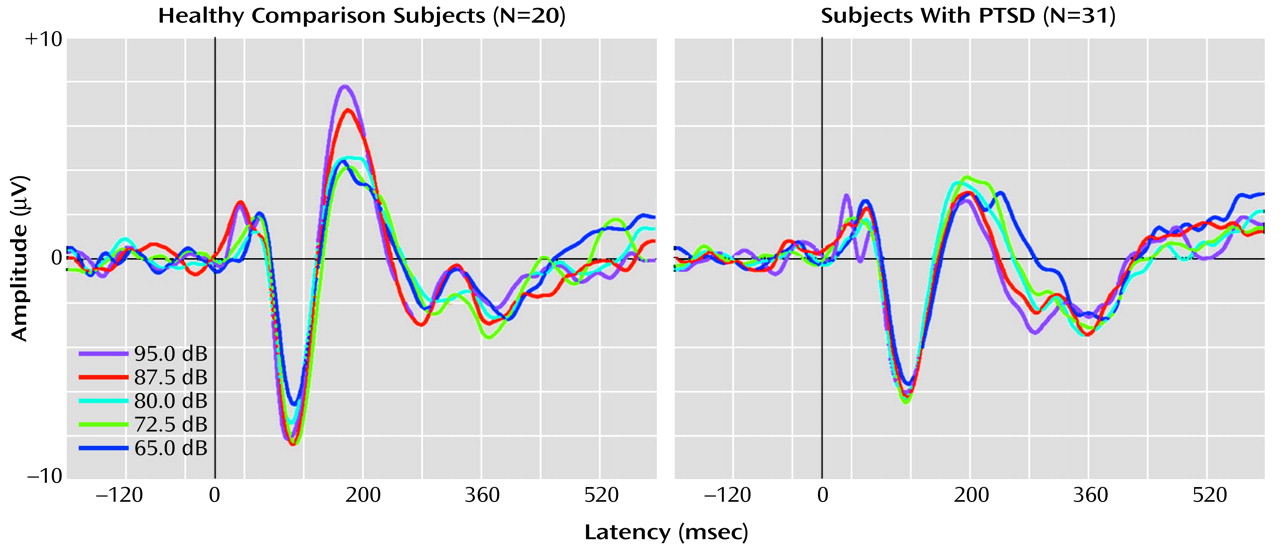
Figure 1 shows grand averaged waveforms at each tone intensity level for the healthy comparison subjects and the PTSD subjects.
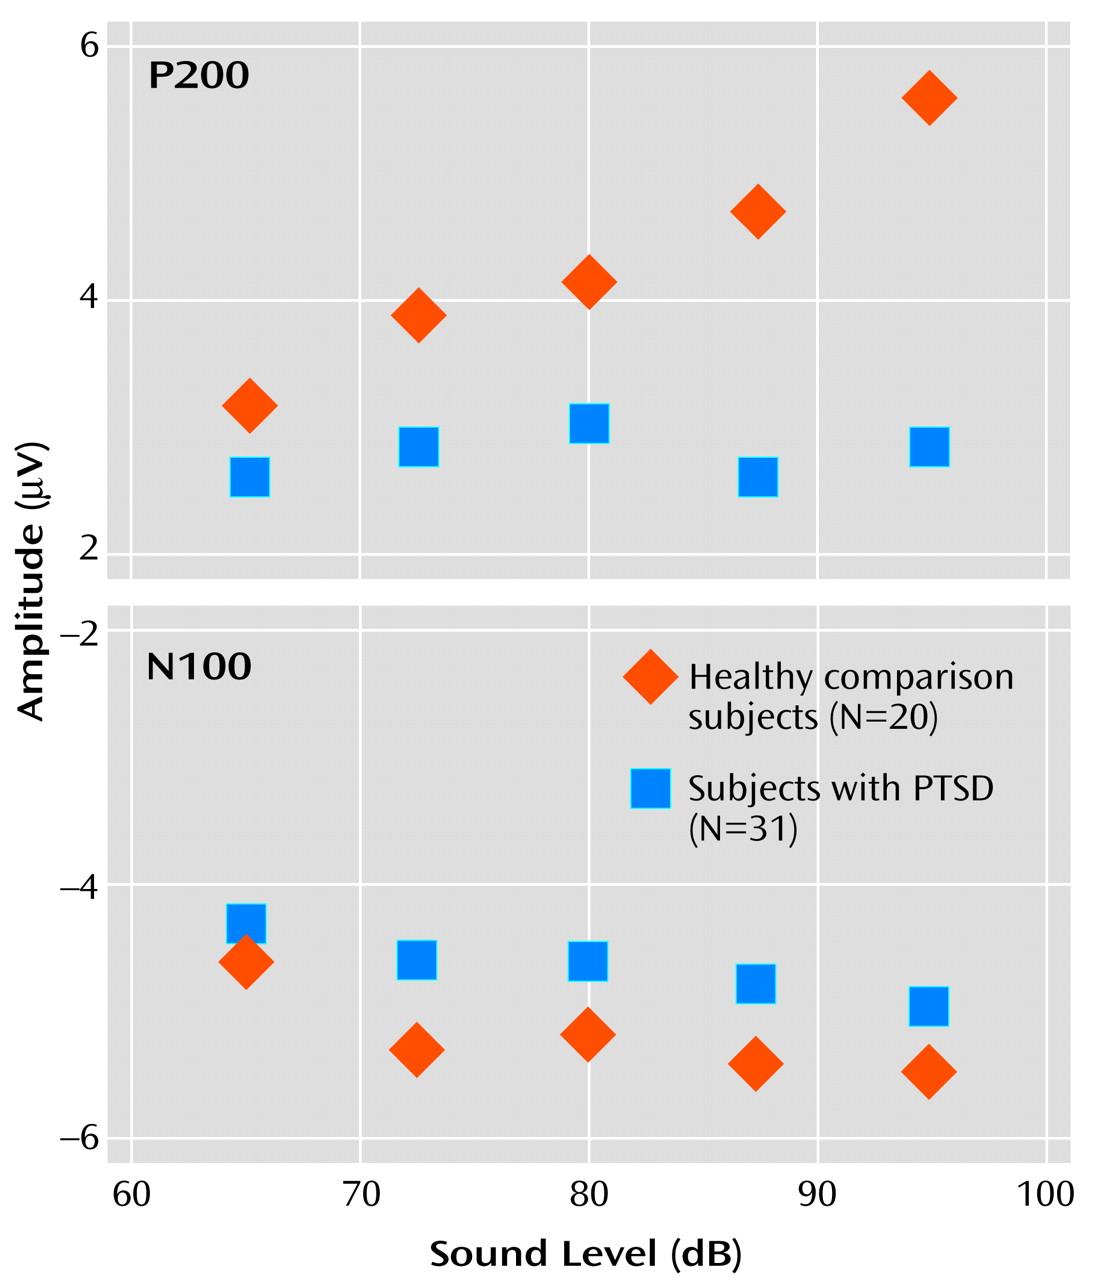
There was no significant main effect for group on overall N100 amplitude (F=1.29, df=1, 46, p=0.26). However, a significant main effect was found for the within-subjects variable tone intensity (F=2.86, df=4, 46, p=0.03), with the linear trend component explaining 89% of the total variance. For the PTSD group, the rate of N100 increase was 0.018 μV/dB. For the healthy comparison group, N100 increased as a function of stimulus intensity at a rate of 0.026 μV/dB. The slopes of the N100 tone intensity functions for the PTSD and healthy comparison group were not significantly different as indicated by the lack of a group-by-tone intensity interaction (F=0.4, df=4, 46, p=0.87).
For P200 amplitude, there was a significant main effect for group membership, with higher overall mean amplitude seen in the healthy comparison subjects (4.3 μV) than in the subjects with PTSD (2.8 μV) (F=10.18, df=4, 46, p<0.01). For the within-subjects variable, tone intensity, there was a significant main effect (F=8.75, df=4, 46, p<0.01), but there was also a significant group-by-intensity interaction (F=4.30, df=4, 46, p<0.01). For the healthy comparison subjects, P200 amplitude showed augmentation as a function of tone intensity at a significant rate of 0.094 μV/dB (t=2.66, df=19, p<0.02), with analyses indicating that a linear component accounted for 91% of the variance in the P200 tone intensity function. In contrast, for the subjects with PTSD, P200 showed only a nonsignificant change in amplitude as a function of tone intensity (0.007 μV/dB) (t=–0.34, df=30, p>0.10). The two graphs in
Figure 2 illustrate the relevant group data for N100 and P200.
P200 data from the PTSD patient group were also analyzed with respect to data from 10 combat veterans diagnosed with major depression (and no PTSD) and eight veterans with histories of alcohol abuse but no PTSD or depression.
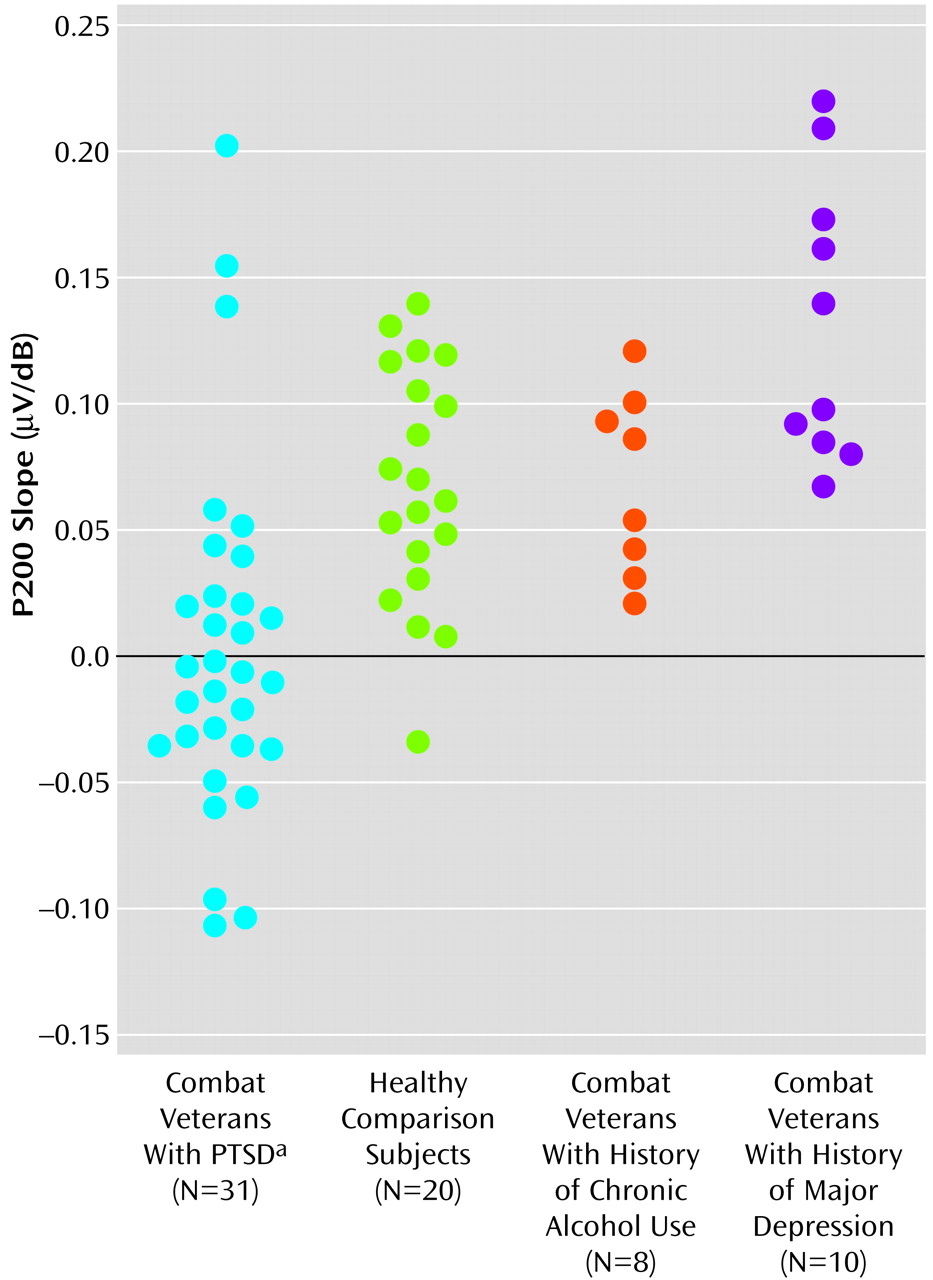
Figure 3 shows scatter plots of P200 slope values for all subjects.
Investigation of data from individual subjects revealed that the flatness of the P200 tone intensity function for the PTSD subject group (
Figure 2) reflected the grand averaging of data from PTSD subjects with augmenting versus reducing responses.
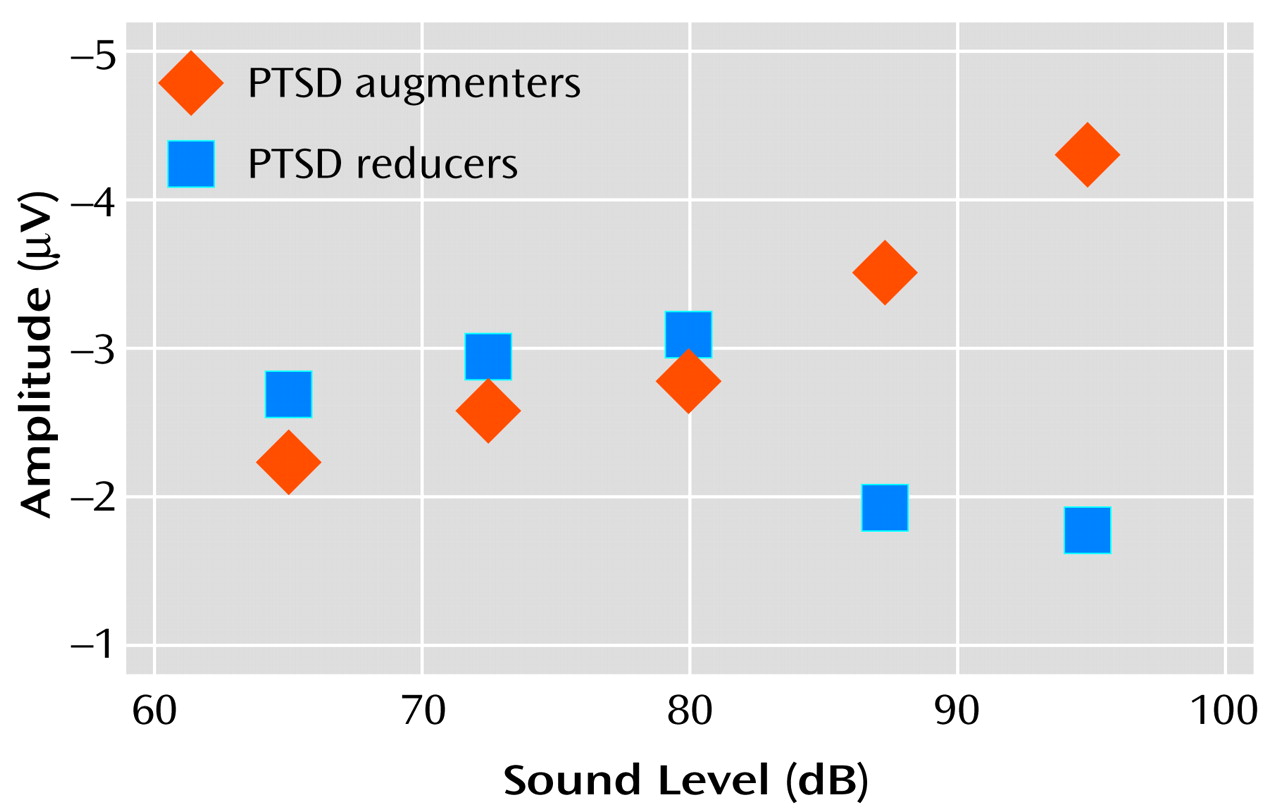
Figure 4 shows “separated-out” P200 tone intensity functions for PTSD patients whose response profiles showed either augmentation or reduction. The data reveal that the P200 augmenting subgroup had a nearly linear tone intensity function—similar to that seen for the comparison groups—whereas the reducing subgroup had a nonlinear function characterized by an initial increase in P200 response and a subsequent suppression of response for the two loudest tones.
Overall, for the PTSD group, only 13 (42%) of the 31 subjects showed P200 augmentation. In contrast, 19 (95%) of 20 subjects in the healthy comparison group and all subjects in the major depression and chronic alcohol abuse groups showed P200 augmentation. This represents a significant and specific difference between the PTSD group and the other comparison groups (
Figure 3). Healthy comparison subjects (m=0.067 μV/dB) and subjects with a history of chronic alcohol abuse (m=0.071 μV/dB) showed similar P200 slopes, whereas subjects in the depression group (m=0.133 μV/dB) actually showed a greater P200 augmentation response than was seen for the healthy comparison subjects or for the PTSD group (m=0.004 μV/dB) (F=14.13, df=3, 65, p<0.001).
Because of small group sizes, we did not compare P200 response profiles of patients receiving specific medications, but we were able to partly address the question of possible medication effects by dividing the PTSD patients into general subgroups of patients receiving no medication (N=13) antidepressants (N=17), antianxiolytics (N=5), and anticonvulsants (N=3). Within the PTSD population, analyses failed to reveal any difference in P200 response profile on the basis of antidepressant (χ2=0.22, df=1, p=0.64), antianxiolytic (χ2=0.68, df=1, p=0.41), or anticonvulsant (χ2=0.79, df=1, p=0.38) medication status. Additional evidence that antidepressant medications (the most commonly employed medication in our PTSD population) did not cause the P200 reduction effect seen for some PTSD patients comes from the observation that patients in the depression group (all of whom save one were receiving antidepressants) actually showed a greater P200 augmentation response than was seen even for the healthy comparison subjects.
In exploring the relationship between electrophysiological and clinical profiles, it is useful to consider both N100 and P200 augmentation and reduction patterns, especially because a review of the N100 data from individual subjects showed that 43% of the patients with PTSD even failed to show N100 augmentation. Whereas 87% of the subjects in the comparison groups showed augmentation on both N100 and P200 responses, only 29% of the PTSD subjects showed this pattern.
Taking N100 augmentation and P200 augmentation to be the prototypical pattern for patients without PTSD, we thought it might be insightful to compare, within the PTSD group, the clinical profiles of the nine patients with this electrophysiological pattern with the clinical profiles of the eight PTSD patients with the exact opposite pattern—N100 reduction and P200 reduction. Normal subjects without psychopathology will show some evidence of response reduction when stimuli are very intense and potentially damaging to the nervous system, so we predicted that active reduction of both N100 and P200 responses might be an appropriately adaptive means for protecting a nervous system rendered overly sensitive by PTSD. This hypothesis was supported by the clinical data, which showed that PTSD patients with N100 and P200 reduction had less severe PTSD symptoms than PTSD patients showing N100 and P200 response augmentation (one-tailed t=1.89, df=15, p=0.04).
Of interest is that the nine PTSD patients who showed N100 augmentation and P200 reduction were more depressed than PTSD patients with other patterns (t=2.03, df=30, p=0.05). Also, within this group, there were significant correlations between P200 slope and Clinician-Administered PTSD Scale total score (r=0.72, df=7, p=0.03), the Mississippi scale score (r=0.72, df=7, p=0.03), and the Hamilton depression score (r=0.70, df=7, p=0.04). No other significant interrelationships between neurophysiological and neuropsychological profiles were seen.
Discussion
The present data demonstrate significant differences in the electrophysiological profiles for subjects with versus those without PTSD. Whereas 95% of healthy comparison subjects demonstrated P200 augmentation, such augmentation was seen for only 42% of the PTSD population. It is noteworthy that P200 augmentation or reduction was independent of the N100 profile, and that N100 response alone did not distinguish between PTSD patients and comparison subjects. The data thereby suggest that N100 and P200 are functionally distinct, with separate mechanisms modulating N100 and P200 response intensities.
The P200 findings in this study are fully consistent with those previously reported by Paige and colleagues
(29) and therefore at odds with those reported by McPherson et al.
(32). Subject and methodological differences between the studies may provide an explanation. Whereas our study and that of Paige et al. assessed combat-related PTSD in adults, McPherson et al. examined PTSD in children who suffered physical or sexual abuse. Adult subjects in our study and that of Paige et al. suffered from chronic PTSD and were tested many years after the indexed traumatic event. In contrast, children in the study by McPherson et al. suffered from PTSD symptoms that were less chronic and of more recent onset. Another possible reason for the different findings may be that the reducing profile is not a marker of neurobiological vulnerability but rather a learned protective mechanism that is not fully developed in children or which develops slowly over time. Response reduction may be an acquired strategy for dealing with PTSD symptoms, since subjects with both N100 and P200 reduction had the least severe PTSD symptoms, although it is possible that an independent mechanism or biochemical state giving rise to milder symptoms also causes the reducing profile.
Methodological differences between studies may have been important also. The McPherson et al. study used pseudorandomly ordered stimulus presentations with long interstimulus intervals, whereas our study and that of Paige et al. used blocked presentations with a shorter interstimulus interval. The blocked presentation strategy may be critical to the reducing effect. From an intuitive perspective, an isolated loud tone is likely to be treated as an orienting stimulus, which produces a strong response in PTSD. When a block of loud tones is presented, patients with PTSD may become overloaded and switch into a state of protective inhibition in which the response to most of the tones within the block is to effectively “shut-down.”
The PTSD patients showed a high rate of depression and history of substance abuse that was absent from the healthy comparison group. One must therefore wonder if the high incidence of P200 reduction in the PTSD group reflects PTSD per se or one of these factors. To address this, we compared the PTSD data with data obtained from age-matched combat-exposed veterans with histories of depression or substance abuse but without evidence of PTSD. The data (
Figure 3) showed that the P200 reduction pattern was specific to the PTSD group. It is interesting to note that the subjects in the depression group actually showed a greater P200 augmentation response than was seen for the healthy comparison subjects, an observation that has also been made by others
(33). Given this, it is perhaps surprising that PTSD patients with a pattern of N100 augmentation and P200 reduction were the most depressed of the PTSD patients. This indicates that depression in PTSD has different neurobiological correlates than depression in the absence of PTSD. With respect to a history of substance abuse, this did not correlate with a specific clinical presentation or electrophysiological profile within the PTSD group.
The exact neurobiological processes that mediate patterns of response reduction and augmentation are presently unknown. Magnetoencephalography studies
(42) and EEG source modeling studies
(43) suggest that N100 and P200 evoked-potential components are predominantly generated in primary and secondary auditory cortical areas, with minimal direct contributions from subcortical structures. It is tempting to speculate that limbic structures, including the hippocampus and amygdala, play a role in modulating cortical responsivity to sounds of increasing intensity, but specific studies of augmentation and reducing patterns in patients with documented unilateral or bilateral limbic lesions will be needed to better define specific cortical and subcortical interactions.
