Subjects
The study included patients with Alzheimer’s disease, subjects with mild cognitive impairment, and a healthy age-matched comparison group. All subjects were recruited from outpatients in the Memory Clinic of the Department of Psychiatry and Psychotherapy of the University Hospital Frankfurt am Main, Germany. The research protocol was approved by the local ethics commission, and written informed consent was obtained from each patient, his or her caregiver (spouse or adult child), and each comparison subject before any examination procedures were performed.
Routine diagnostic assessment at the Memory Clinic involves a physician cooperating with a multiprofessional team (neurologists, psychiatrists, psychologists). The procedures include a detailed medical history from both the patient and the spouse or relative; general physical, neurological, and psychiatric examinations; and laboratory testing that comprises a CBC with differential counts, syphilis and Lyme borreliosis screening, and measures of serum electrolytes, liver and renal function, cholesterol status, thyroid function, and serum vitamin B
12 and folate levels. Technical diagnostic procedures include a structural magnetic resonance imaging (MRI) scan of the brain and functional assessment with [
18F]fluorodeoxyglucose positron emission tomography (FDG PET). The FDG PET scan is performed in a resting state after 12 hours of fasting and is visually analyzed for Alzheimer-typical patterns of hypometabolism
(20). A trained neuropsychologist administers the following tests: the Mini-Mental State Examination (MMSE)
(21), the test battery of the Consortium to Establish a Registry for Alzheimer’s Disease
(22), and the Short Cognitive Performance Test
(23). All available information is reviewed by the multiprofessional team, which makes a consensus diagnosis that includes a rating of disease severity according to the Global Deterioration Scale
(24) and the Clinical Dementia Rating
(25), in order to distinguish between mild cognitive impairment and Alzheimer’s disease and to document possible progression on follow-up.
All included patients were seen at least twice during semiannual follow-up visits. For patients with Alzheimer’s disease, the inclusion criteria were age greater than 50 years, diagnosis of dementia made on the basis of ICD-10 criteria, and diagnosis of probable Alzheimer’s disease according to criteria of the National Institute of Neurological and Communicative Disorders and Stroke and the Alzheimer’s Disease and Related Disorders Association
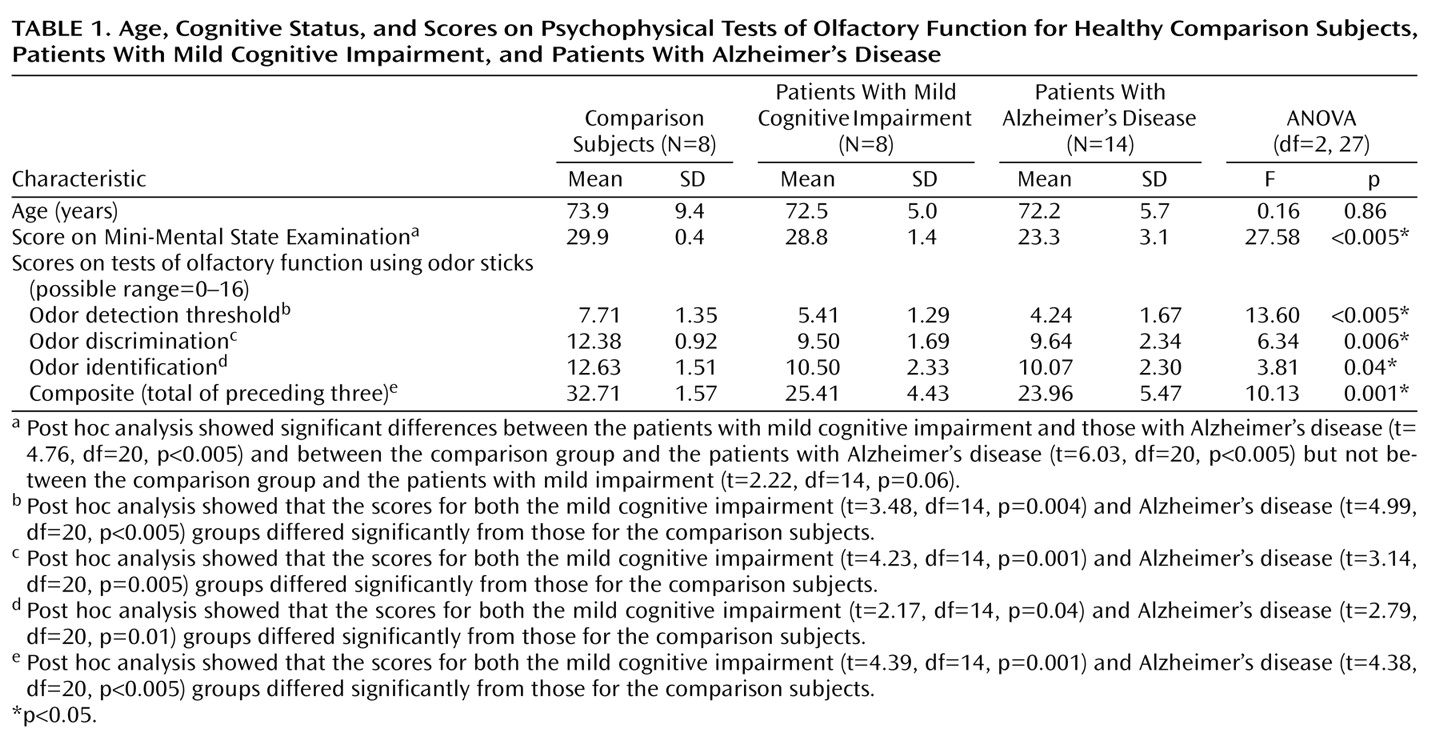
(26). Patients with disease severity ranging from very mild to moderate, corresponding to a Global Deterioration Scale rating of 3 to 4, and an MMSE score higher than 15 were accepted. Stable general health and the ability to read and write as well as to follow basic test instructions were further prerequisites. Fourteen patients with Alzheimer’s disease were recruited, five men and nine women. Their mean age was 72.2 years (SD=5.7, range=57–81), their mean MMSE score was 23.3 (SD=3.1, range=16–27), and the mean disease severity according to the Global Deterioration Scale was 3.7.
Recruitment of the patients with mild cognitive impairment followed current conceptual criteria for amnestic mild cognitive impairment
(19) and required memory complaints corroborated by an informant, impaired memory function for age and education, preserved general cognitive function, and intact activities of daily living. Further inclusion criteria were age greater than 50, stable general health, and the diagnosis of “questionably demented” (score=0.5) according to the Clinical Dementia Rating
(25). Eight subjects were recruited, five men and three women. Their mean age was 72.5 years (SD=5.0, range=65–79), and their mean MMSE score was 28.7 (SD=1.4, range=27–30). All of the included patients with mild cognitive impairment demonstrated temporoparietal hypometabolism in functional imaging with PET, characteristic of beginning Alzheimer’s disease
(20).
The comparison group was recruited from age-matched spouses of the cognitively impaired subjects. These individuals underwent an evaluation similar to that just described, including a general medical history, neurological examination, and brief neuropsychological testing with the MMSE. Subjects qualified as healthy comparison subjects if, in the opinion of the clinician, they were functioning normally in daily life and did not have any sign of cognitive impairment. Eight male comparison subjects were included. Their mean age was 73.9 years (SD=9.4, range=53–83), and their mean MMSE score was 29.9 (SD=0.4, range=29–30).
The exclusion criteria for all participants were 1) any current or past history of neurological or psychiatric illness other than mild cognitive impairment or Alzheimer’s disease, including stroke, head trauma, affective disorders, and structural evidence of stroke or major perfusion deficits (MRI evidence of cortical stroke, subcortical lacunae or infarcts, extensive periventricular white matter changes, or other radiological changes indicative of a probable vascular dementia according to the criteria of the National Institute of Neurological and Communicative Disorders and Stroke and the Association Internationale pour la Recherche et l"Enseignement en Neurosciences
[27]); 2) history of alcohol or substance dependence (ICD-10 criteria); 3) current or past history of smoking; 4) endocrinological disorder; 5) any unstable medical condition; or 6) acute rhinitis, active allergy, or any history of obstructive nasal disease or nasal-sinus surgery. All participants were right-handed.
Psychophysical Testing of Olfactory Function
Before the session to evaluate event-related potentials, all participants were tested for chemosensory functioning by means of a commercially available psychophysical olfactory test battery; normative data in relation to age and gender and information on the battery’s validity in comparison to established measures of olfactory sensitivity have been published
(28,
29). It comprises three tests of olfactory function: threshold for detection of butanol odor, odor discrimination, and odor identification. Odors are presented in felt-tip pens 14 cm long with a 1.3-cm inner diameter. Instead of dye, the pen’s tampon is saturated with a liquid odorant. For odor presentation, the cap was removed by the experimenter and the pen’s tip was placed 2 cm in front of both nostrils for approximately 3 seconds. An interval of at least 30 seconds between odors minimized olfactory desensitization.
Odor thresholds were assessed by using
n-butanol. Sixteen dilution steps were established in a geometric series, starting from 4%
n-butanol (with aqua conservata as solvent). The threshold was determined by employing a multiple staircase method, with a triple-force design, i.e., three pens were presented in a randomized order, two containing the solvent and one with the odorant at a certain dilution. The subject’s task was to identify the odor-containing pen. After correct identification in two successive trials, a higher-dilution step was attempted. If the subject failed to identify the odor, a lower dilution was repeated. The mean of the last four reversal points was used as the threshold estimate. The scores could range between 0 and 16; results show a normal distribution in the general population
(29).
In the odor-discrimination task, triplets of pens were presented in a randomized order, with two containing the same odorant and the third a different odorant. The subject’s task was to determine which pen differed. As a total of 16 triplets were presented, the scores could range from 0 to 16.
Odor identification was assessed by presentation of 16 common odors (orange, leather, fish, cinnamon, peppermint, banana, apple, lemon, licorice, turpentine, garlic, coffee, rose, pineapple, clove, and aniseed). The subjects were free to sample each odor as often as necessary before selecting one out of four descriptors from a list specifically assigned to each odor. Again, the scores could range from 0 (none correctly recognized) to 16.
The results of the three subtests were summarized in the composite score (threshold plus discrimination plus identification), resulting from addition of the three subtest scores. A composite score of 15 or less is used to identify functional anosmia
(29).
Olfactory and Trigeminal Event-Related Potentials
Monomodal chemosensory nasal stimulation was performed by the use of a sophisticated stimulus apparatus (Olfactometer OM2S, Burghart Instruments, Wedel, Germany) that allows the application of chemical stimuli without concomitant stimulation of mechanoreceptors or thermoreceptors
(30–
32). This was achieved by embedding chemical stimuli of 200-msec duration in a constantly flowing air stream (8 liters/minute) applied to the nasal mucosa by a cannula with an inner diameter of 3 mm inserted approximately 1 cm into the nostril beyond the nasal valve area. The temperature and humidity of the air stream were kept constant (36.5°C, 80% relative humidity). The rise time of the stimulus concentration was less than 20 msec. Hydrogen sulfide (H
2S), 8 ppm, was used for olfactory stimulation, since it specifically stimulates the olfactory system without simultaneous trigeminal activation
(33). In contrast, carbon dioxide (CO
2), 50% volume/volume, was used for specific stimulation of trigeminal nociceptors, in order to control for systematic errors and to confirm an intact nasal sensitivity. It produces a painful stinging sensation
(34). During each session, 20 stimuli of H
2S and CO
2 each were applied to the right nostril with an interstimulus interval of 40 seconds to avoid habituation. The procedure lasted approximately 40 minutes. In keeping with published recommendations for the recording of olfactory event-related potentials
(32,
35), the session started with H
2S. Among the reasons for this procedure is that vigilance decreases during sessions. Thus, olfactory event-related potentials, as the measure of highest interest, were recorded first, while trigeminal event-related potentials were recorded later during the sessions. The subject was seated in an air-conditioned room that was darkened and acoustically shielded to minimize other sensory stimuli; the patient’s movements were monitored through a video camera system. The complete procedure was performed while the subject breathed naturally.
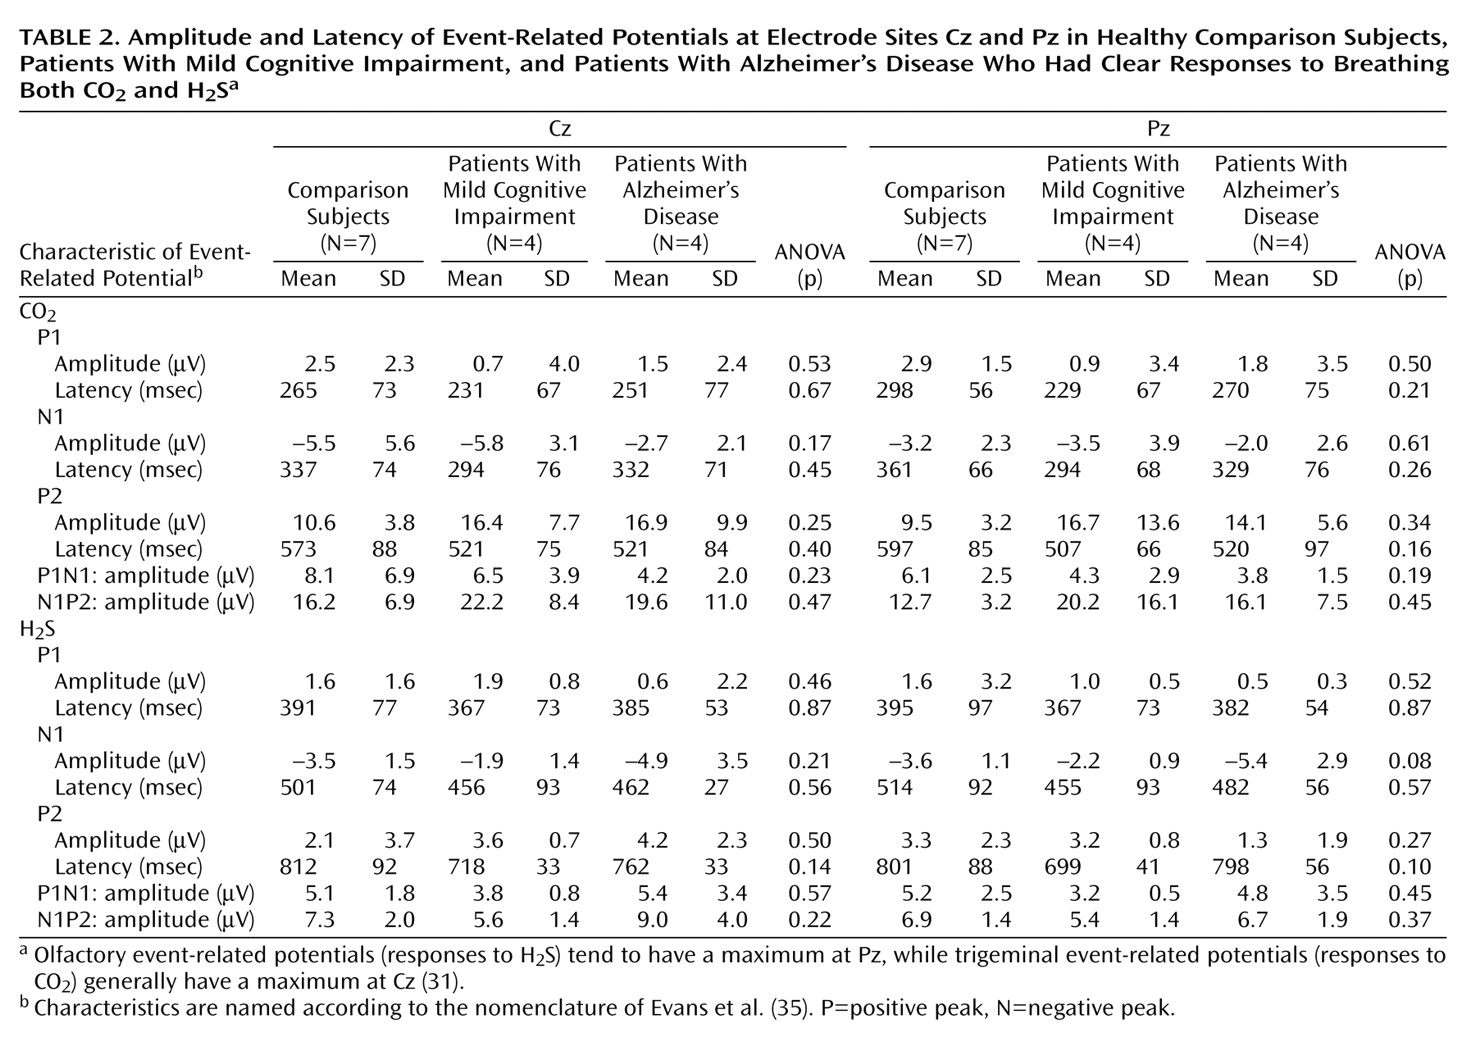
The EEG was recorded from five positions of the international 10/20 system (Cz, C3, C4, Fz, and Pz) referenced to linked earlobes (A1, A2). Blink artifacts were monitored from an additional site (Fp2). Stimulus-linked EEG segments of 2,048 msec were digitally recorded at a frequency of 250 Hz (band-pass filter 0.2–15 Hz). Event-related potentials were obtained by off-line averaging of at least 15 digitized EEG segments. The baseline event-related potential was set at the mean of the EEG record during the pretrigger period of 548 msec. Records contaminated by eye blinks (>50 μV at the Fp2 lead) or other disturbances (e.g., high-frequency motor artifacts) were discarded during off-line visual inspection of single trials by a trained observer (T.H.). Only participants with at least 15 remaining records per session were considered for further evaluation.
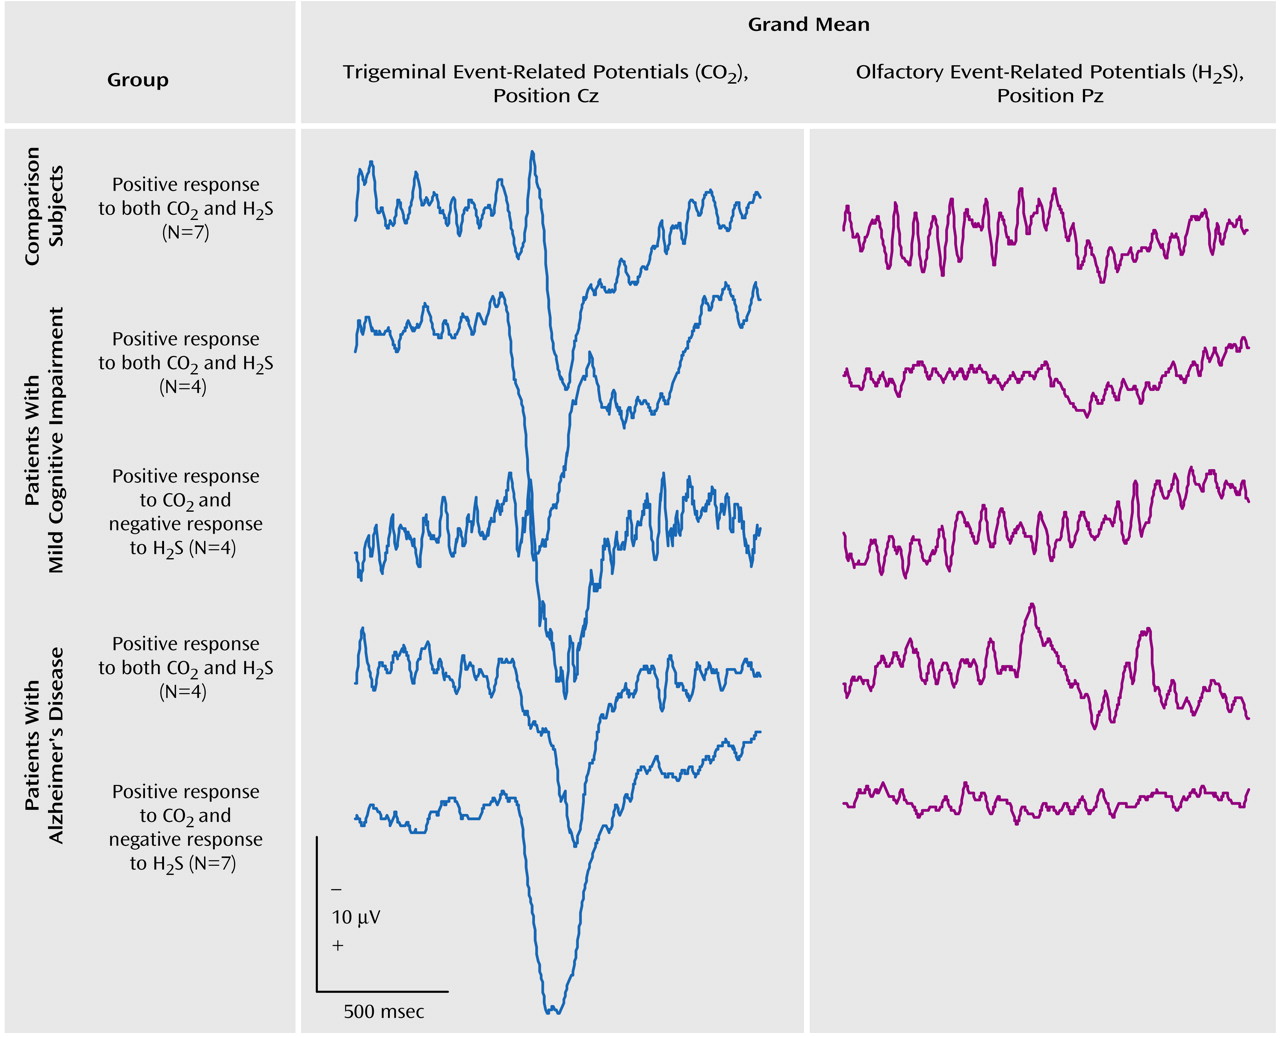
Furthermore, an event-related potential was considered absent if it was not possible to distinguish a clear response from the background noise in an artifact-free recording. Subjects without a clear response to trigeminal stimulation with CO
2, suggesting either a procedural error or generalized pathology of the nasal mucosa, were excluded from further evaluation. The presence of clear evoked potentials in response to CO
2 combined with an indiscernible response to specific olfactory stimulation with H
2S was considered to be indicative of anosmia
(32).
There is discussion about the nomenclature of chemosensory event-related potentials
(32). In this study the peaks were named P1, N1, and P2, in keeping with the widely accepted nomenclature of Evans et al.
(35). On average, the first positive peak (P1) in this study occurred at position Pz after a latency of 395 msec, followed by a major negativity (N1) at 515 msec and a late positive complex (P2) at 802 msec. Peak amplitudes N1 and P2 (measured in relation to prestimulus baseline) and latencies N1 and P2 (in relation to stimulus onset) were evaluated by an experienced rater (T.H.), who was blinded to the subjects’ diagnoses. On the basis of these measurements, the peak-to-peak amplitudes A-P1N1 and A-N1P2, base-to-peak amplitudes A-P1, A-N1, and A-P2, and peak latencies T-P1, T-N1, and T-P2 were subjected to statistical analysis.
Statistical Analysis
The analysis focused on group differences between the patients with Alzheimer’s disease, subjects with mild cognitive impairment, and healthy comparison group.
Age, odor detection threshold, odor discrimination, odor identification, and each event-related potential measure (amplitude and latency at each electrode site) was subjected to univariate analysis of variance (ANOVA); diagnosis was treated as a between-subjects factor with three levels (Alzheimer’s disease, mild cognitive impairment, and healthy). The alpha level was set at 0.05. In case of significance, ANOVA was followed by univariate post hoc comparisons to identify the specific diagnostic group for which the factor differed significantly. For this purpose, correlated unpaired t tests with Bonferroni adjustment for multiple comparisons were performed.
In order to test the statistical significance of the differences in the various rates of present or absent olfactory event-related potentials and the significance of the gender difference between the diagnostic groups, the nonparametric Fisher’s exact test was conducted. The analysis was processed with the SPSS 9.0 package (Chicago, SPSS).


