Follow-Up Study Group
A total of 3,959 participants completed screening forms that were eligible for the follow-up study and were returned to administration offices. Of these, 615 forms were removed from the study because the subject’s AUDIT score was 0. In addition, 130 Spanish language forms and 46 forms from respondents under the age of 18 were excluded. Of the remaining 3,168 eligible subjects, 1,500 were “unreachable” by telephone, leaving a total of 1,668. In total, 901 (54.0%) of the 1,668 potential participants were contacted and completed follow-up interviews.
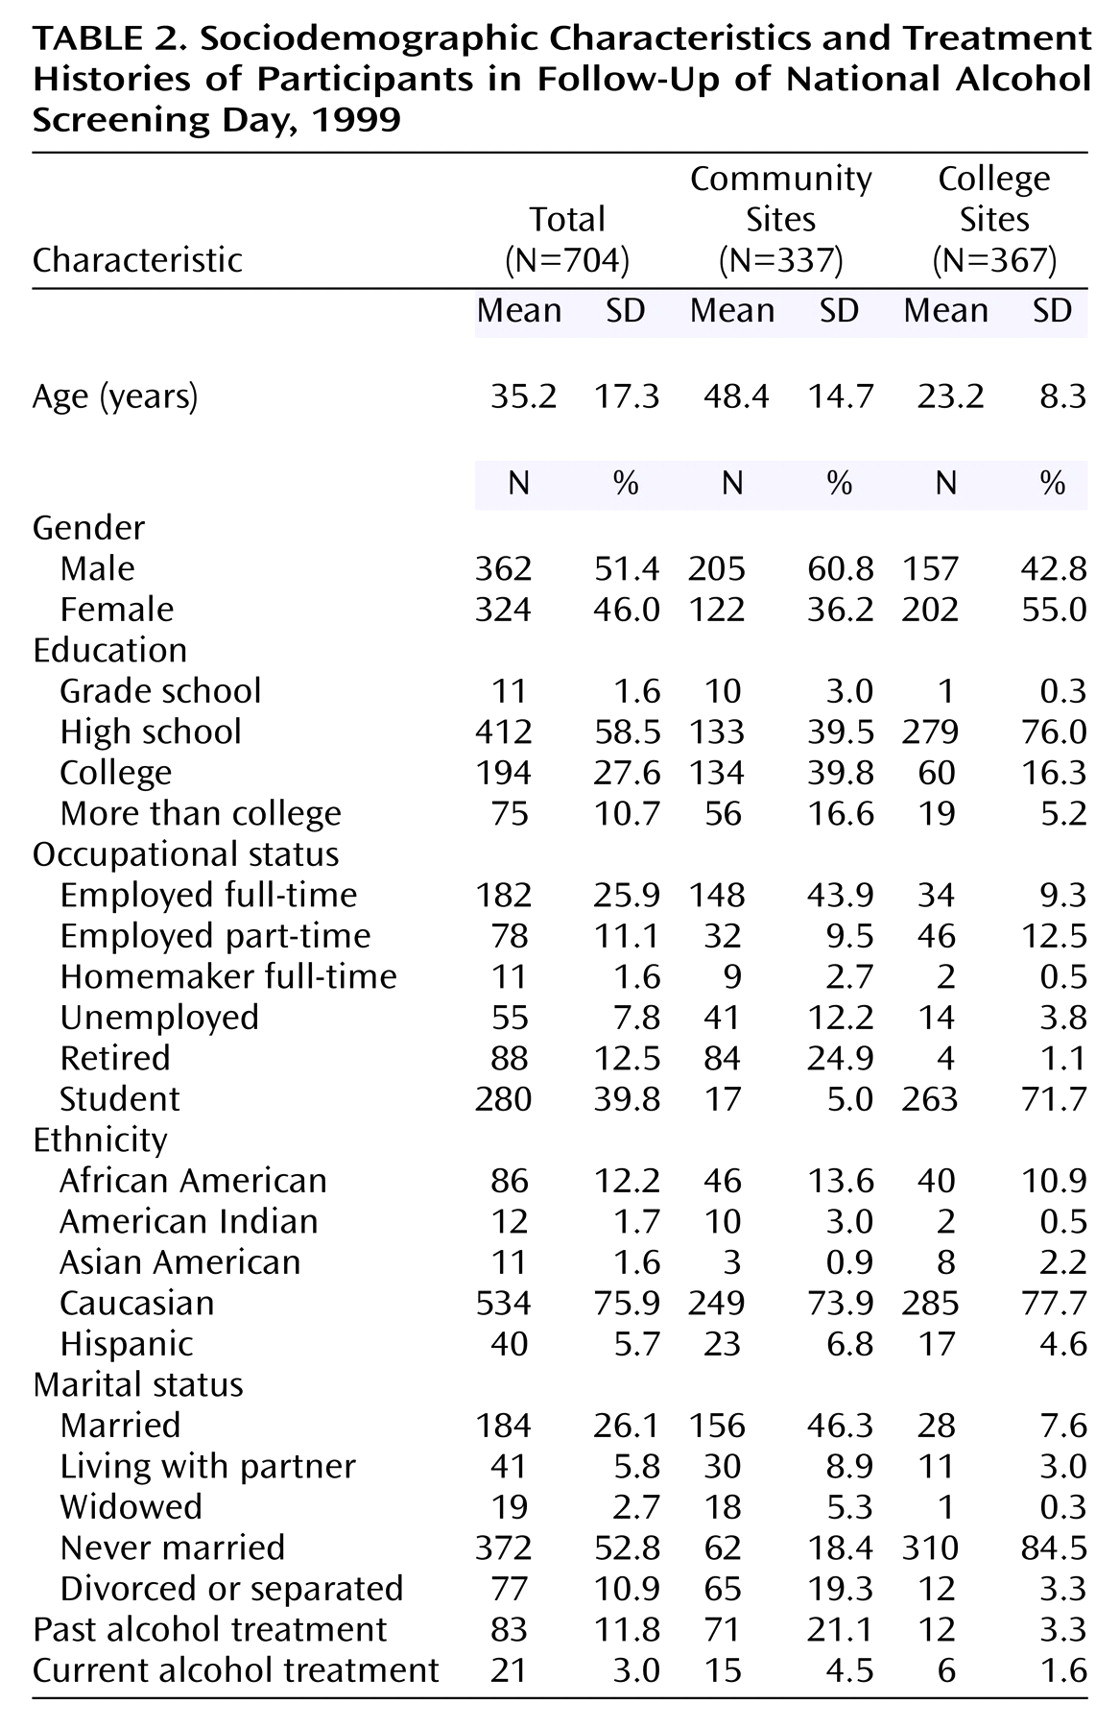
Of these 901 participants, 197 said they took the screening test for a significant other, and 704 came to the screening for themselves. Of these 704 people, 337 were screened at the community sites and 367 at the college sites.
Table 2 presents the sociodemographic characteristics and treatment histories of the 704 participants.
The mean AUDIT scores for the community and college groups and a breakdown of participants by AUDIT cutoff scores are presented in
Table 3. We examined several cutoff scores for the AUDIT, including a score of 8, indicating harmful or hazardous drinking according to the WHO
(10,
21); 11, indicating harmful or hazardous drinking in a college population
(14); and 19, indicating need for immediate treatment (Babor, personal communication, 1998). We also examined a cutoff score of 7 and above, which was the score at which participating clinicians in NASD were instructed to refer participants for further evaluation and treatment.
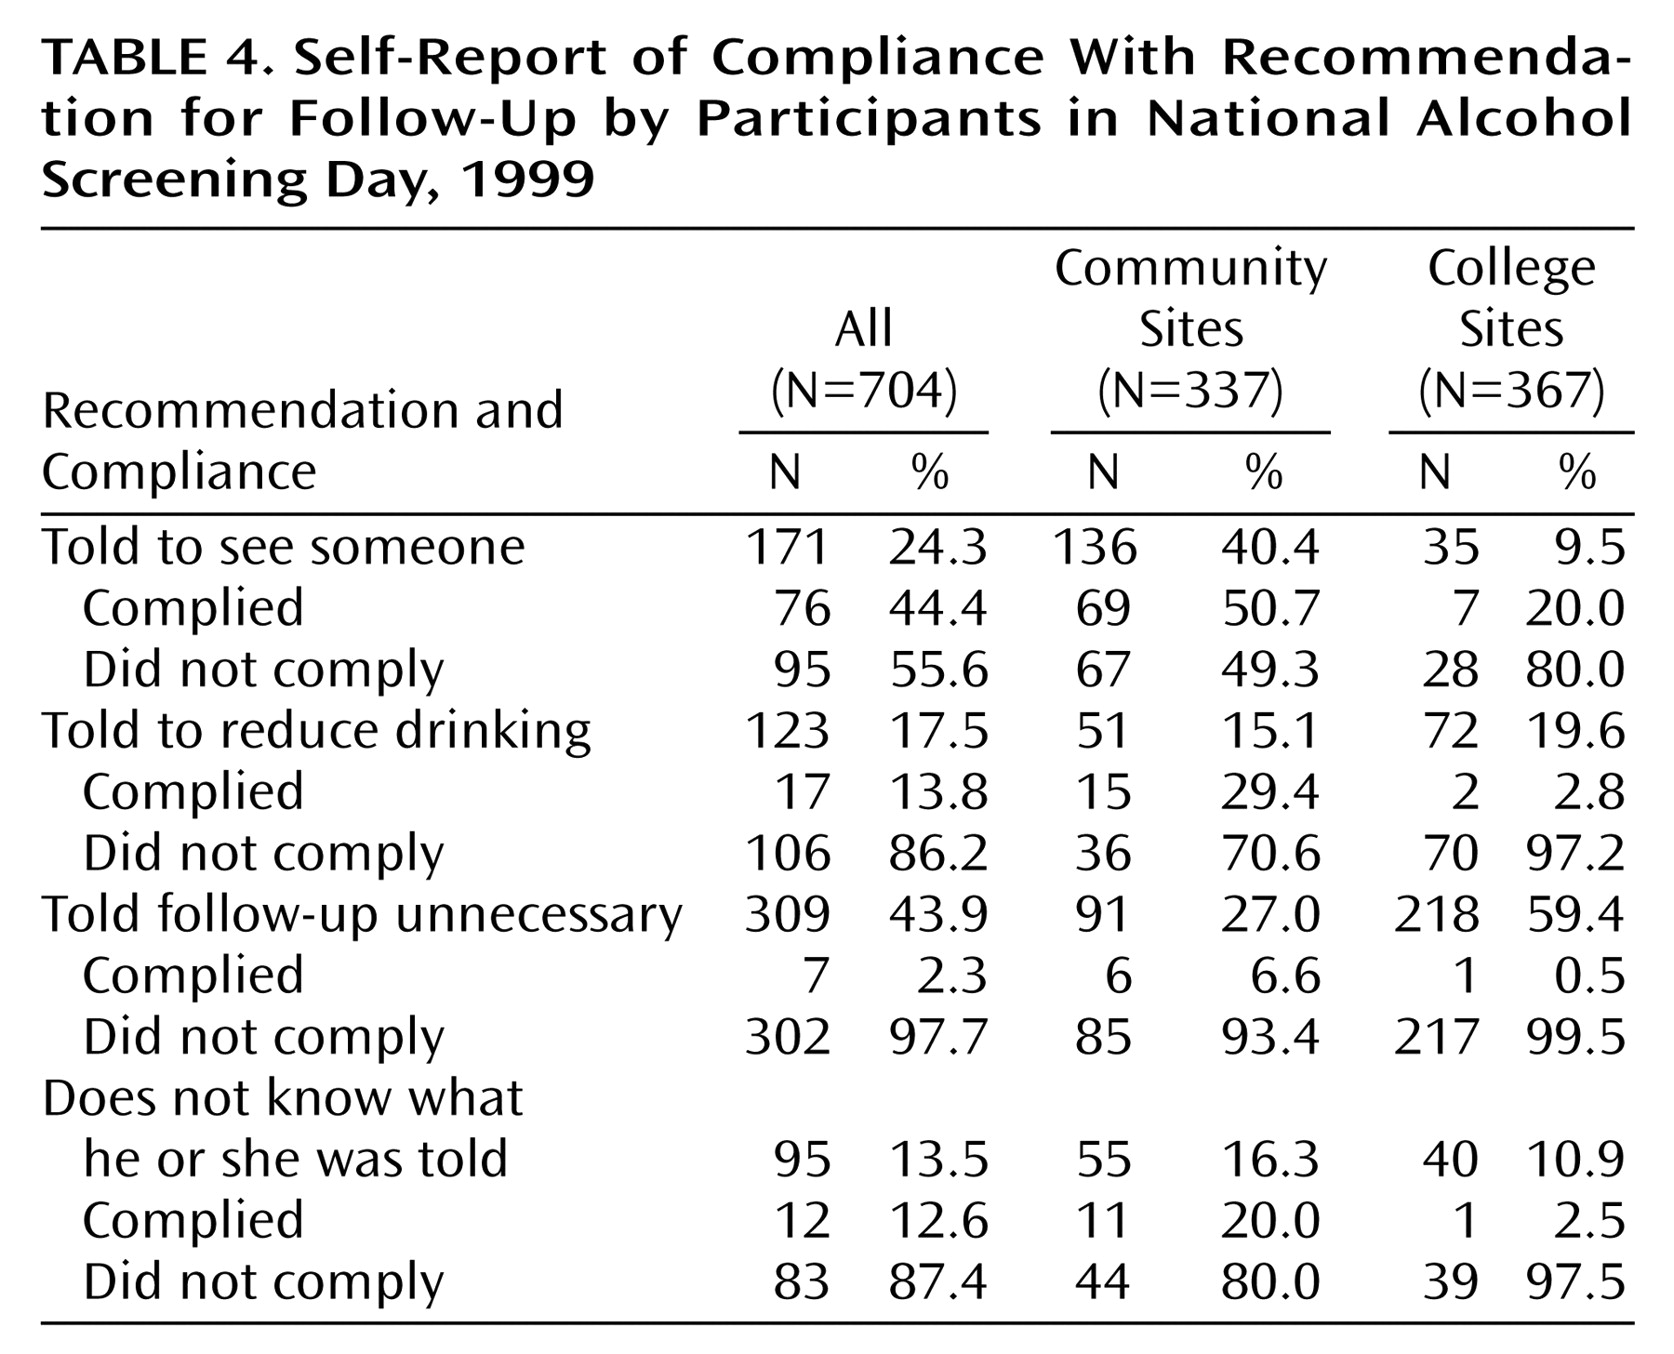
Table 4 summarizes the self-reported compliance of the participants with the recommendation that they pursue further evaluation and possible treatment. Of the people in the community who were told to see someone for a follow-up visit, 50.7% complied with this recommendation. At the college site, 20.0% of the participants complied with the recommendation to go for a follow-up visit. We asked the participants who were referred for follow-up but did not go to cite the reasons why they did not go. Among these 592 participants, the reasons most frequently cited were as follows: 1) “I was not told to go for follow-up” (49.2%), 2) “I decided I don’t have an alcohol problem” (28.9%), and 3) “I decided I could handle it on my own” (17.9%).
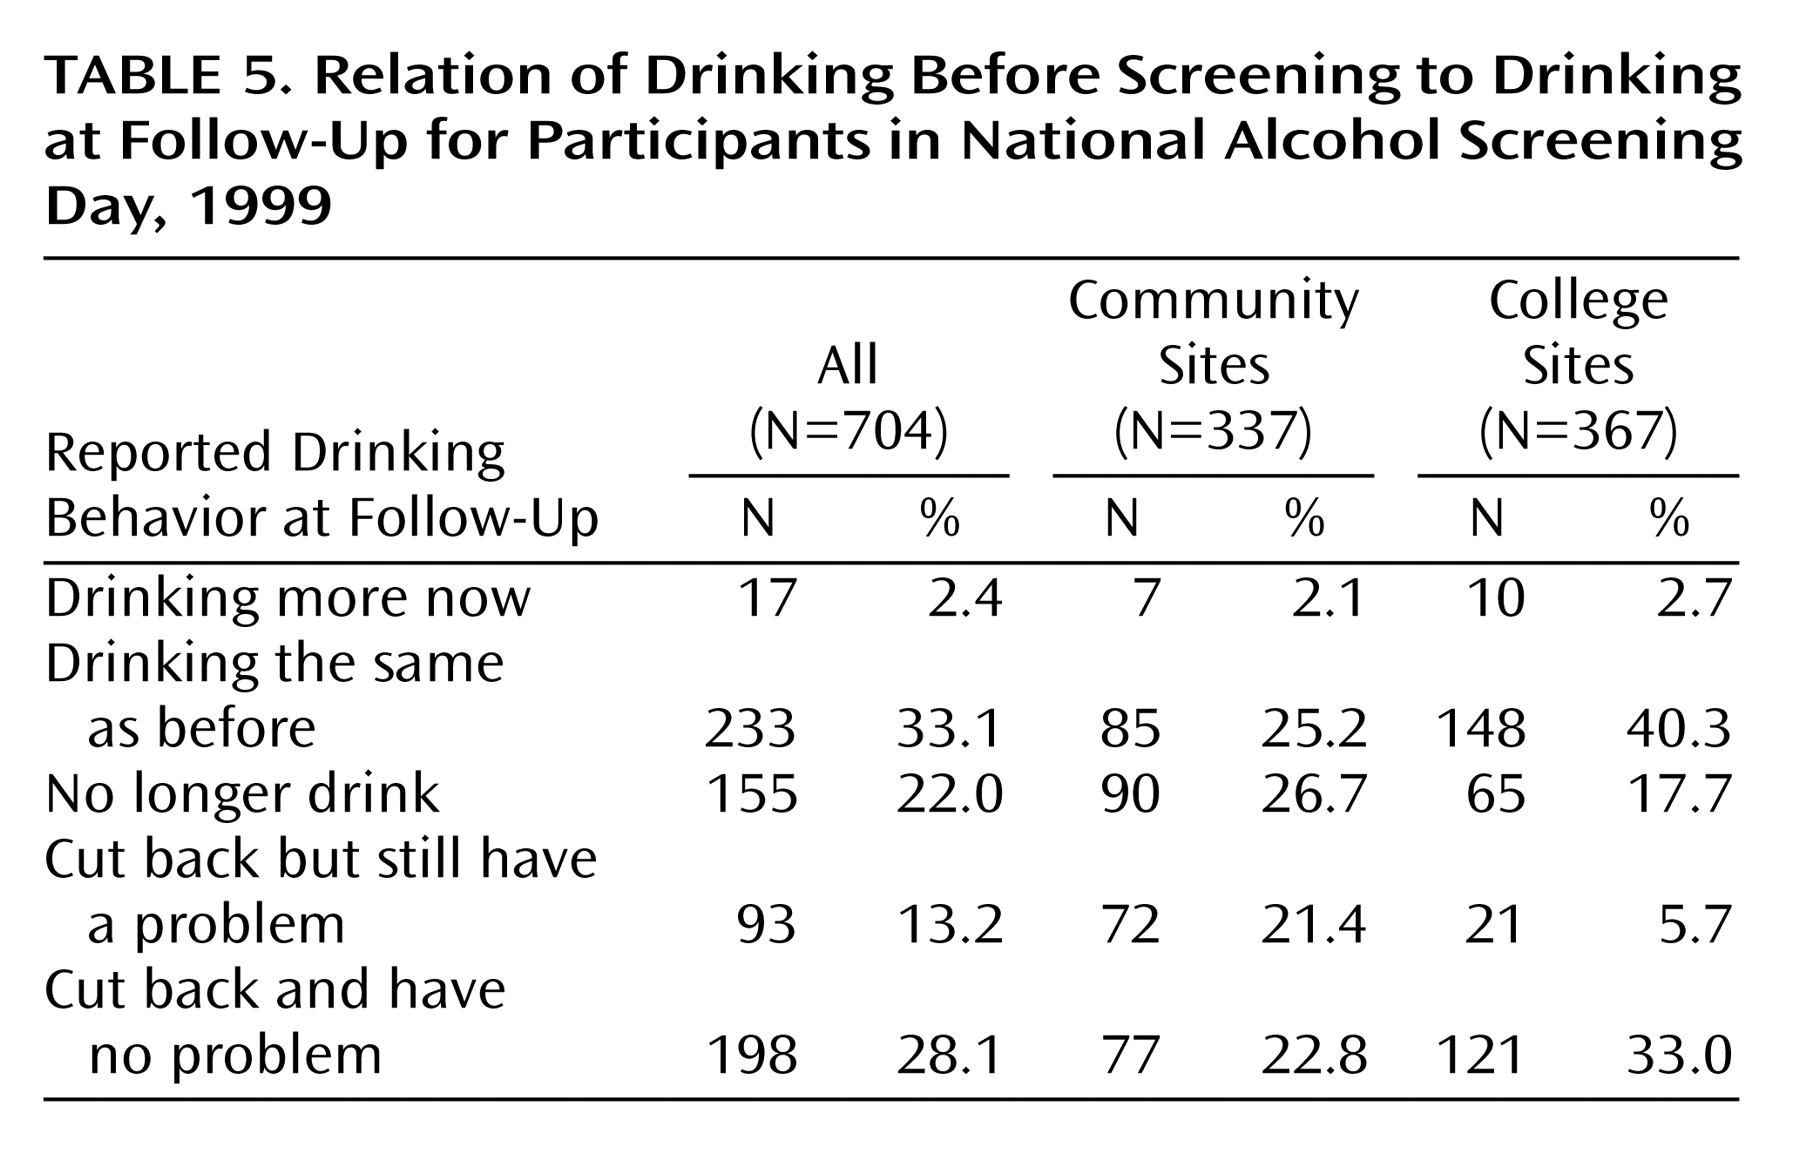
We also compared participants’ self-reported drinking at the time of the screening to their self-reported drinking at the time of the follow-up interview. These results are summarized in
Table 5. In the community group, 26.7% reported that they were no longer drinking, and 44.2% said that they had cut back on their drinking. In the college group, 40.3% reported they were drinking about the same at the time of the follow-up as they had been at the time of the screening, 17.7% said that they no longer drink, and 38.7% said that they had cut back on their drinking.
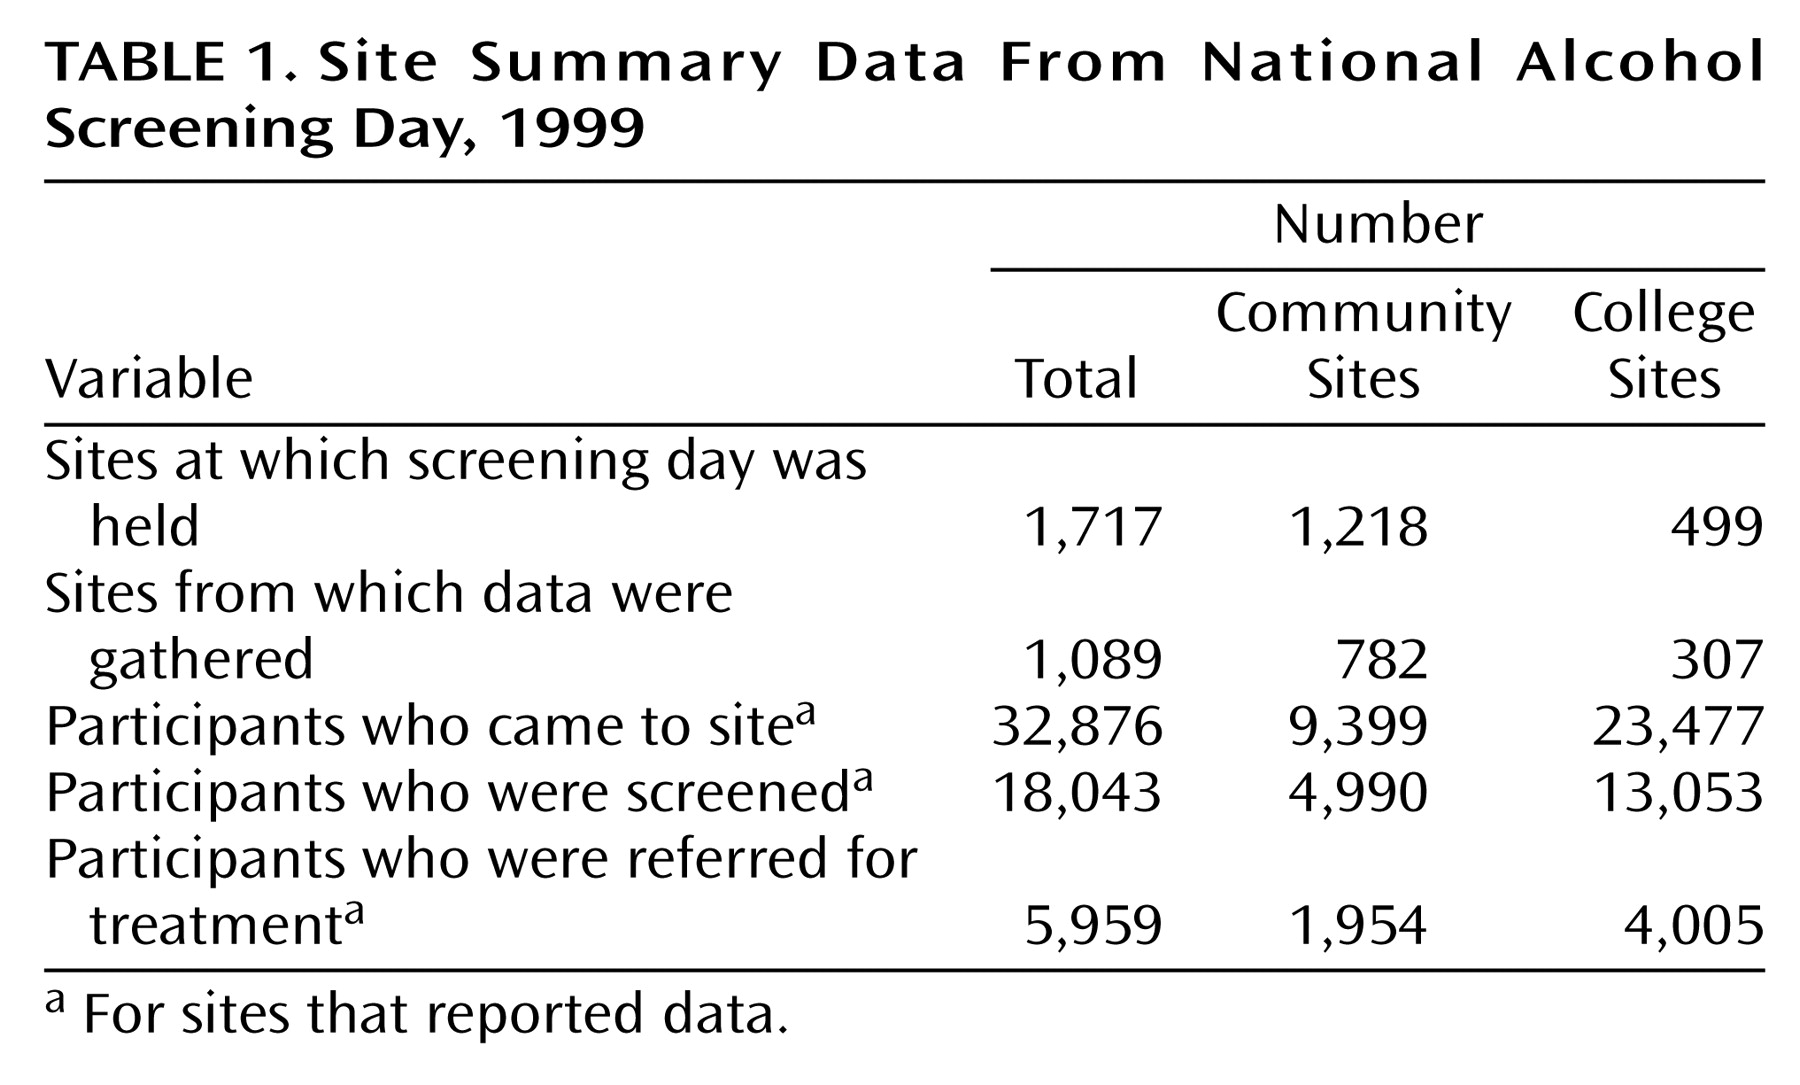
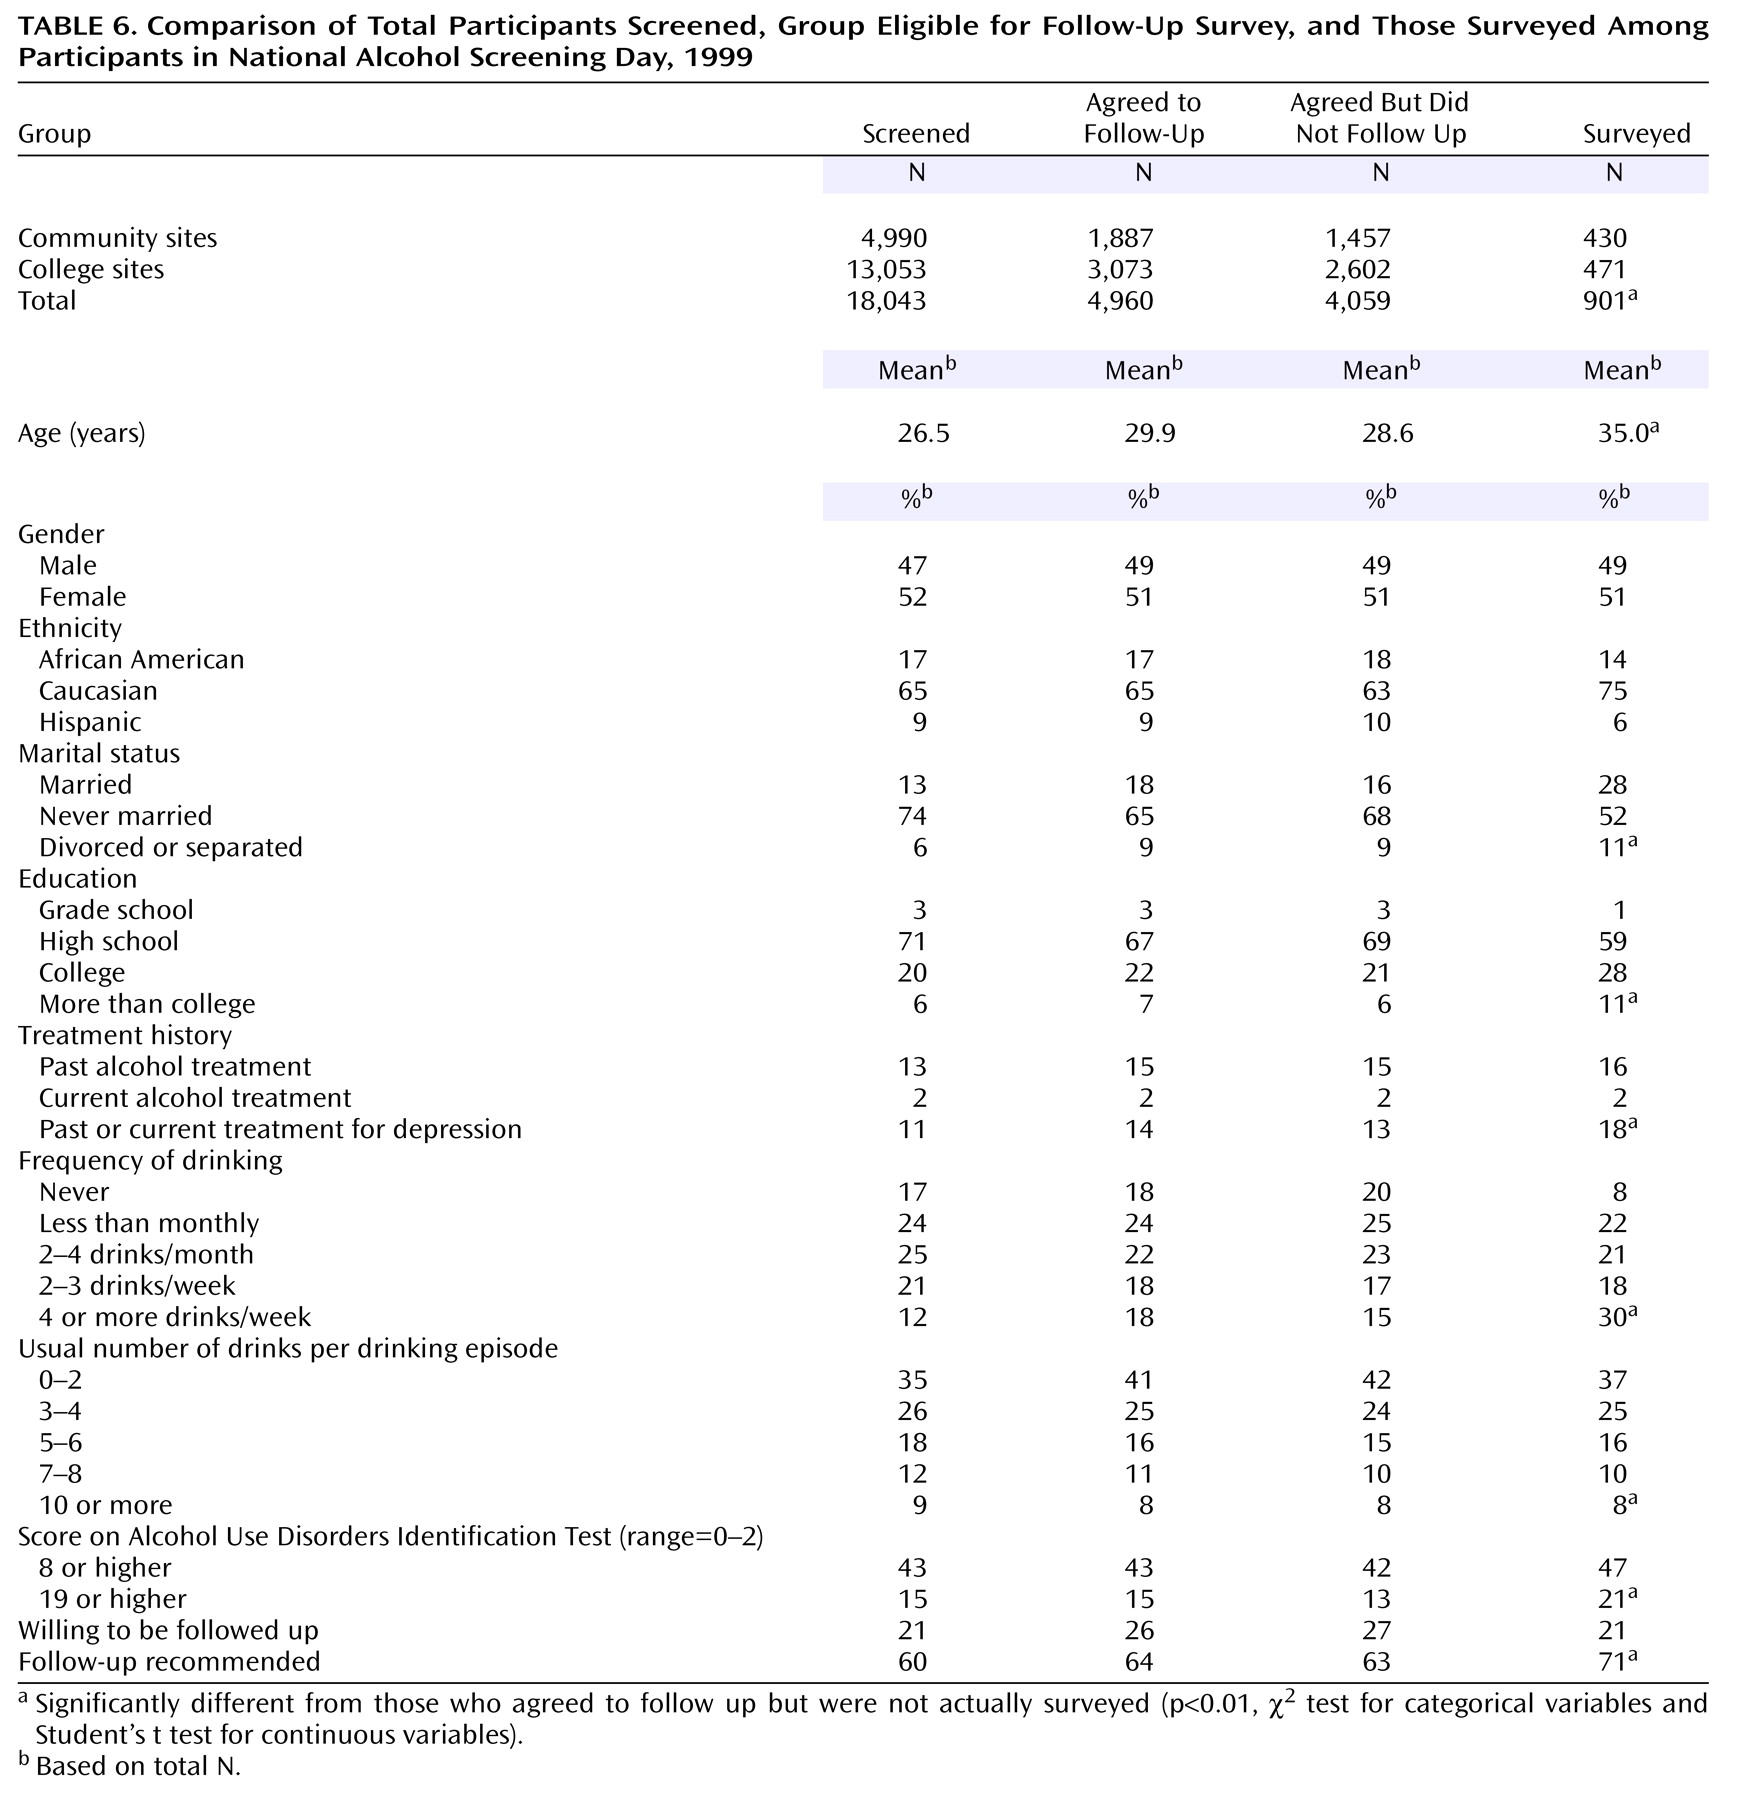
Because the follow-up group was small compared to the total number of individuals reported as having attended and been screened in the first NASD, we compared this subgroup with the entire screened group. Therefore, we compared the characteristics and drinking practices of the persons who were screened (N=18,043) and the subgroup that completed the follow-up survey (N=901) (
Table 6). Although statistical comparisons of these groups were not made because of the size discrepancies between groups, it is notable that the AUDIT scores were virtually identical in the total screened group and the subgroup that agreed to the follow-up study. This subgroup was also similar to the entire screened group on measures of frequency and quantity of drinking.
We also compared the persons who actually completed the follow-up survey (N=901) with those who agreed to the follow-up survey but were not surveyed (N=4,059). Those surveyed tended to be slightly older (mean age=35.0 versus 28.6 years), employed full-time (25% versus 20%), married (28% versus 16%), and less likely to be students (33% versus 48%). There were ethnic differences between those surveyed and those who agreed to be followed up but were not surveyed. For example, a larger proportion of those surveyed were Caucasian (75% versus 63%), and a smaller proportion were African American (14% versus 18%) or Hispanic (6% versus 10%) compared with those who agreed to be followed but were not surveyed.
Compared with those who agreed to be surveyed but were not, a greater proportion of those surveyed drank more than 4 drinks per day, (18.0%, 731 of 4,059 versus 14.0%, 126 of 901), scored more than 8 on the AUDIT (46.9%, N=423, versus 42.0%, N=1,705), and scored 19 or higher on the AUDIT (21.0%, N=189, versus 13.0%, N=528). Consistent with these greater AUDIT scores, those who were surveyed were more likely to have been advised to pursue further evaluation and possible treatment (71.0%, N=640, versus 63.0%, N=2,557) than those who had agreed to participate but were not surveyed. These comparisons were all statistically significant at p<0.05.
