Major depression is conceptualized as a disorder that involves abnormalities of frontolimbic brain regions
(1,
2). Efforts to unravel the precise structural and functional impairments underlying major depression have employed neuroimaging and neuropathological procedures. To date, functional imaging studies in adult patients have primarily focused on the prefrontal cortex, showing dysfunction in the dorsolateral prefrontal
(3–
8), anterior cingulate
(9–
13), and orbitofrontal cortex
(13–
15). In geriatric depression, functional imaging studies have also reported decreased blood flow in the orbitofrontal cortex
(16) and anterior cingulate
(17,
18) as well as biochemical abnormalities in frontal white matter
(19). Furthermore, diffusion tensor imaging has shown that microstructural white matter abnormalities in close proximity to the anterior cingulate are associated with lower likelihood of remission in elderly patients with depression
(20).
A critical role of the prefrontal cortex in major depressive disorder is further suggested by a number of postmortem anatomical investigations that have revealed decreases in the density or number of glia and the density and size of some neurons in the orbitofrontal cortex and anterior cingulate
(21). In addition, one neuropathological study in elderly subjects has described a marked specificity for deep white matter hyperintensities at the level of the dorsolateral prefrontal cortex, consistent with the magnetic resonance imaging (MRI) literature that has suggested high-intensity lesions as one of the primary neurobiological substrates of elderly depression
(22). Applying MRI estimates of brain and high-intensity lesion volumes together with clinical indices of cerebrovascular and nonvascular comorbidity, we have proposed that two distinct paths might lead to major depression in the elderly
(23). One path might be represented by high-intensity lesions stemming from vascular and nonvascular medical comorbidity. Smaller frontal volumes might reflect another path in which a complex series of interconnected neurobiological events, perhaps influenced by genetic and environmental factors, might provide the changes mediating frontal volume deficits and, ultimately, major depression.
Despite the growing evidence for an involvement of the prefrontal cortex in younger as well as elderly depressed patients, there have been relatively few MRI volumetric studies examining the prefrontal cortex. Two previous structural MRI studies conducted by our group have demonstrated a reduction in whole prefrontal cortical volume in late-onset depression
(24,
25). However, the human prefrontal cortex is a large and highly differentiated brain region in which different subregions are associated with specific behavioral and cognitive functions
(26). Hence, it is conceivable to argue that specific subregions within the prefrontal cortex might be distinctively involved in the regulation and modulation of affect and emotions deficient in depression.
Two prior MRI studies have reported a left lateralized volume decrease of the subgenual cingulate cortex in patients with a family history of major depression
(9,
27), although a more recent investigation could not replicate these findings in familial major depressive disorder
(28). A further study in adult depressed patients found a reduction in medial orbitofrontal (gyrus rectus) volume, with no differences in size in the anterior cingulate
(29). Possible explanations for the variability in findings may include methodological differences in image acquisition (i.e., slice thickness), region of interest delineation, and patient populations.
To date, two volumetric MRI studies with a focus on a specific region within the prefrontal cortex have been published in geriatric depression. These studies revealed a bilateral decrease in orbitofrontal gray matter
(30) and a significant association between smaller orbitofrontal volumes and functional impairment
(31).
Volumetric image analysis methods allow assessment of abnormalities in gray matter, white matter, and CSF volumes independently. The investigation of these tissue volumes in frontal subregions might therefore provide additional perspectives toward understanding the pathophysiology of distinct regional abnormalities in major depression.
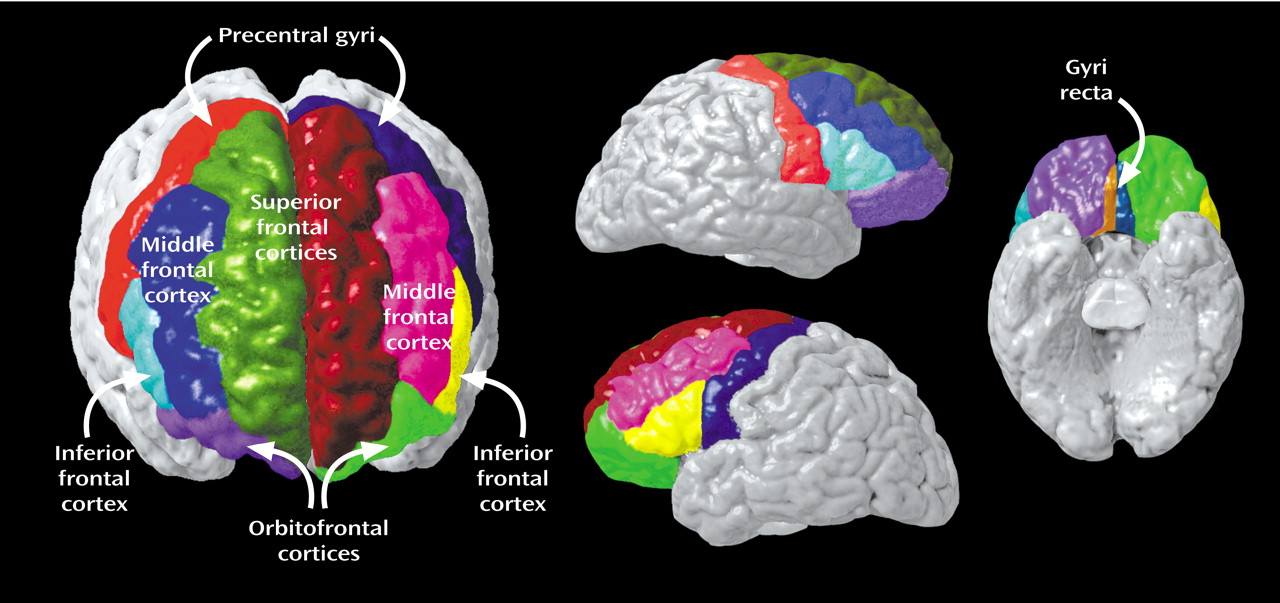
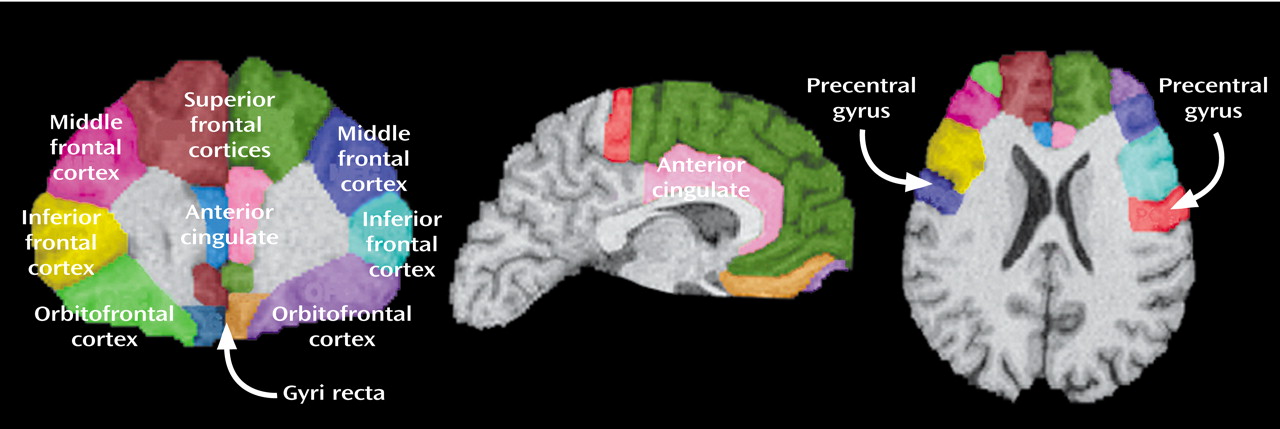
To this aim, the present study examined differences in gray matter, white matter, and CSF in specific frontal subregions of elderly, depressed, medication-free patients who were compared with healthy volunteers group-matched for age and gender. Applying a locally developed MRI-based parcellation method of the prefrontal cortex, we subdivided the prefrontal cortex into the following seven functionally relevant subregions: the anterior cingulate, gyrus rectus, orbitofrontal cortex, precentral gyrus, superior frontal cortex, middle frontal cortex, and inferior frontal cortex.
In light of the existing literature
(30–
33), we predicted that compared with healthy subjects, elderly depressed patients would exhibit gray matter abnormalities in the orbitofrontal cortex. We also hypothesized that we would observe gray matter abnormalities in ventromedial areas on the basis of previous volumetric MRI
(9,
34) and postmortem studies
(35) in younger patients that have suggested a crucial role of the cingulate cortex in major depression. No published studies to our knowledge have investigated regional white matter and CSF changes in elderly patients with depression. Nonetheless, we predicted that changes in white matter or CSF would occur in the presence of gray matter reductions after we corrected for intracranial volume.
Method
Subjects
Subjects were 24 elderly patients with major depression (18 women and six men; mean age=65.85 years [SD=8.18]) and 19 nondepressed comparison subjects (15 women and four men; mean age=66.24 years [SD=7.25]). All depressed patients met DSM-IV criteria for major depressive disorder and were assessed with a structured psychiatric interview. All patients had scores of 15 or greater on the 17-item Hamilton Depression Rating Scale
(36). Depressed patients had an average of two prior episodes of depression (SD=3), with mean age at onset of depression of 35 years (SD=3.45). The purpose of these inclusion criteria was to focus on elderly patients with at least one episode before age 60, in addition to the index episode. Information on prior episodes and the age at onset was obtained from patients and caregivers.
All patients had been free of psychotropic medications for at least 2 weeks before imaging. None of the patients had histories of long-term antidepressant treatment. Patients received comprehensive medical and neurologic examinations and laboratory testing. None of the subjects had clinical evidence of dementia, suspected dementia, or any other brain disorder according to a review of the subjects’ history and a mental status examination. Patients were excluded if they had a history of bipolar disorder, alcohol abuse, or dependence. Mean Mini-Mental Status Examination scores
(37) were in the normal range in the major depression group (mean=28.45, SD=1.45) as well as in the comparison group (mean=29.53, SD=0.80).
Patients were recruited through local newspapers and radio advertisements and through referrals from the geriatric psychiatry ambulatory care programs at the UCLA Medical Center. Comparison subjects were recruited from the community through newspapers and radio advertisements. All comparison subjects underwent a psychiatric examination and a structured interview (Structured Clinical Interview for DSM-IV) for healthy subjects to rule out current or past psychopathology. The study was performed in accordance with UCLA’s policies of the Human Subject Protection Committees, and written informed consent was obtained from all subjects after the procedures had been fully explained.
Imaging Protocol
All subjects were studied with MRI performed on a 1.5-T Signa magnet (GE Medical Systems, Milwaukee) that used a coronal T1-weighted spoiled gradient/recall acquisition in the steady state with the following parameters: repetition time=20 msec; echo time=6 msec; flip angle=45°; 1.4-mm slice thickness without gaps; field of view=22 cm; number of excitations=1.5; matrix size=256×192 mm; in-plane resolution=0.859375×0.859375.
Image Analysis
All image data sets were processed with a series of steps in preparation for manual delineation of prefrontal subregions.
First, images were subjected to brain masking with removal of nonbrain tissue (i.e., scalp and orbits) and cerebellum. Brain volumes were corrected for signal intensity inhomogeneities
(38), aligned, and placed into stereotaxic coordinates, without scaling. This procedure was used to correct for differences in head position and to place data in a common space that was specifically used for group comparisons.
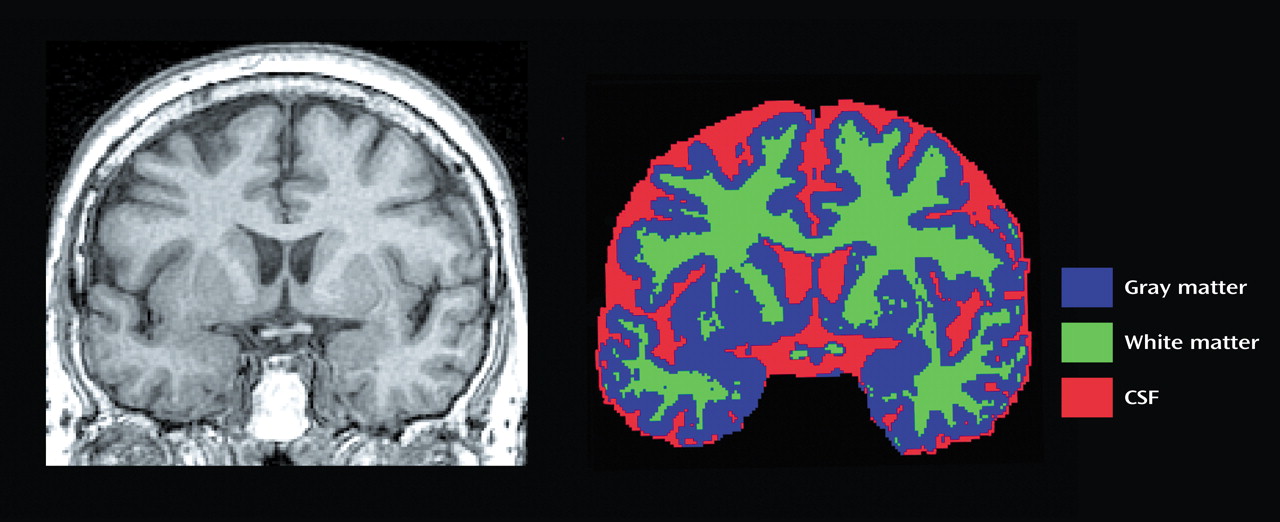
Fully automated tissue segmentation was then applied to the brain volumes, where voxels were automatically classified as most representative of gray matter, white matter, or CSF
(39) (
Figure 1). Quantification of white matter lesions was not assessed in this study.
The fully automated protocol has been shown valid in comparison with semiautomated tissue segmentation procedures used in our previous reports
(40,
41). We assessed 24 subjects with our earlier manual segmentation protocol
(40) that used the completely automated classification scheme of Shattuck and colleagues
(39) and found Pearson’s correlations of 0.96 for white matter volume, 0.94 for gray matter volume, and 0.80 for CSF volume.
Finally, a high-resolution shape representation of the cortex was extracted for each subject by using automated software
(42). By using a three-dimensional active surface algorithm, a spherical mesh surface was created that was continuously transformed to fit a cortical surface tissue threshold intensity value (signal value that best differentiates cortical CSF on the outer surface of the brain from the underlying cortical gray matter) from individual brain volumes. These surface/shape extractions were used to aid in delineation of frontal cortical substructures.
Total intracranial volume including sulcal and subarachnoid CSF but not cerebellum was calculated.
Anatomical Boundaries
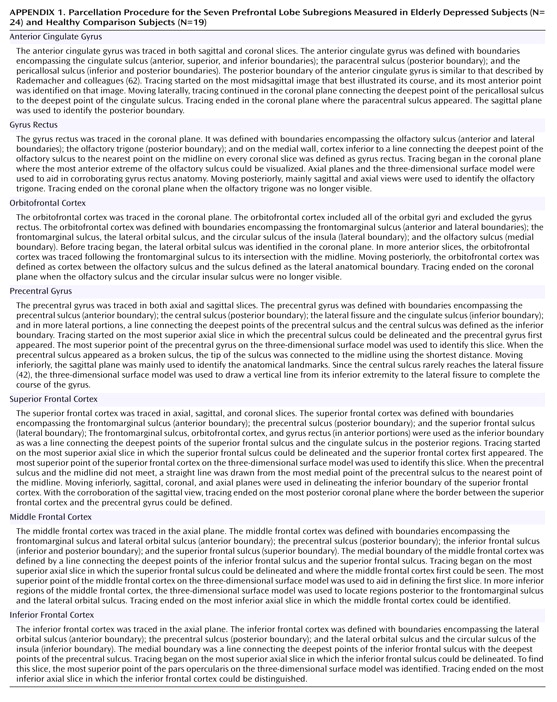
The rules applied to achieve parcellation of the prefontal lobe into seven subregions for each hemisphere are listed in
Appendix 1. Complete details of the written anatomical protocols can be found on the World Wide Web (http://www.loni.ucla.edu/protocols/ Prefrontal_cortex.html). All anatomical delineations were reconciled using each individual’s three-dimensional surface model (
Figure 2) and all three planes to corroborate sulcal and subregion identity (
Figure 3). Delineations were also verified by using two neuroanatomical atlases
(43,
44). For interrater reliability, all anatomical regions were delineated on 10 randomly chosen image data sets. Intraclass correlation coefficients for the reliability of gray matter, white matter, and CSF volumes, as well as total volumes in all subregions ranged between 0.85 and 0.92.
Statistical Analysis
Gray matter, white matter, CSF, and total region volume in each of the seven prefrontal subregions for each hemisphere were dependent measures in analyses of covariance with diagnosis as a between-group factor. To address potential interindividual differences in brain size that may be associated with demographic variables (i.e., gender and age), region of interest volumes as a proportion of the subject’s total intracranial volume
(45) were used as dependent variables. Although gender distribution of the two groups was similar, gender was included as a covariate, since earlier investigations
(46) have reported differences between male and female subjects in some of the regions measured in the present study. Age did not significantly differ between the groups but was also used as a covariate.
Although multiple tests were performed, we elected to not apply a correction procedure, such as the Bonferroni. Applying a Bonferroni correction would have protected our results from type I error, but this approach would have made the results highly prone to type II errors, given that a large number of comparisons were done. The significance level adopted was alpha=0.05 (two-tailed).
Results
The results are presented in
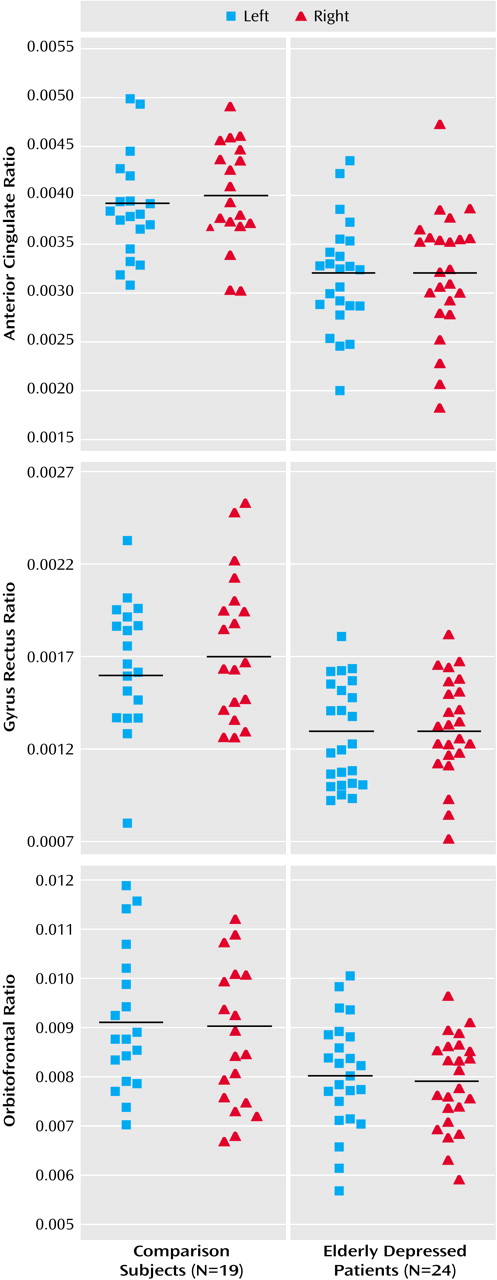
Table 1 and in
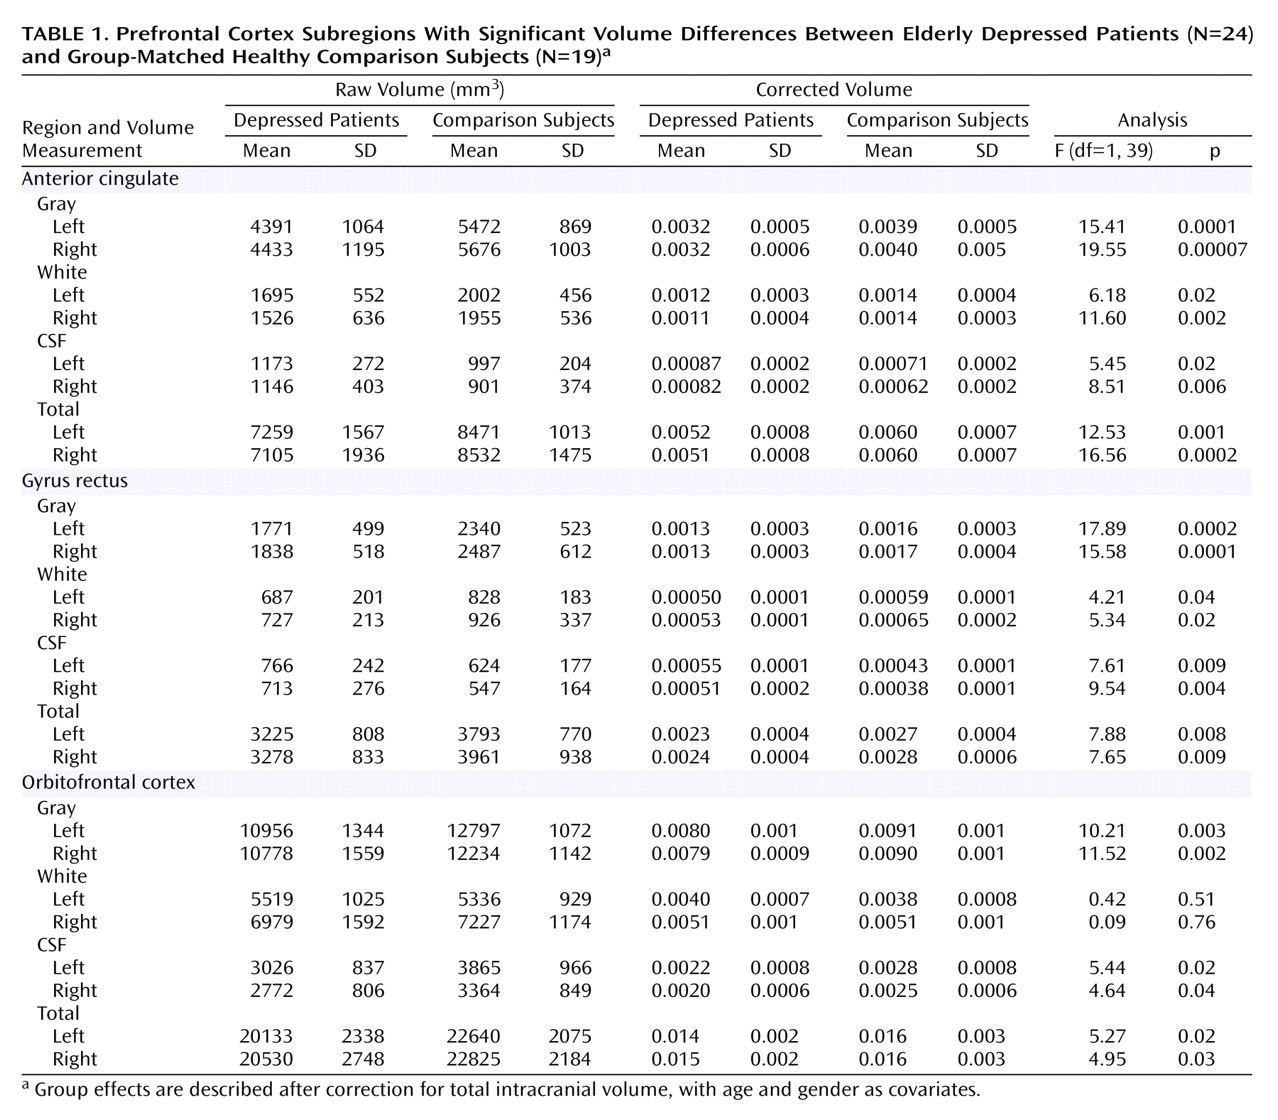
Figure 4. Group effects are described after correction for total intracranial volume, with age and gender as covariates.
Table 1 also documents raw volumes before correction for intracranial volume. Depressed patients exhibited highly significant gray matter volume reductions in the left and right anterior cingulate (differences of 18% and 20%, respectively), the left and right gyrus rectus (differences of 19% and 24%), and the left and right orbitofrontal cortex (differences of 12% in both).
In the anterior cingulate, significant bilateral white matter volume reductions (left: 14% difference; right: 21% difference) and CSF volume increases (left: 18% difference; right: 24% difference) were observed in the depressed patients. In the gyrus rectus, elderly patients with major depression showed significant bilateral white matter volume reductions (left: 15% difference; right: 18% difference) and CSF volume increases (left: 22% difference; right: 25% difference). Significant CSF volume decreases were seen in the left and right orbitofrontal cortex (differences of 21% and 20%, respectively), with no significant difference in white matter volume.
White matter and CSF volume abnormalities were not as pronounced as the gray matter volume reductions. Total anterior cingulate, gyrus rectus, and orbitofrontal volumes were significantly smaller in patients relative to comparison subjects. We did not detect evidence for gender or age effects in any of the volumes analyzed.
There were no significant differences between the depressed patients and the comparison group in gray matter, white matter, and CSF volumes of the precentral gyrus, superior frontal cortex, middle frontal cortex, and inferior frontal cortex. There were also no significant differences between patients and comparison subjects in total brain volume (t=0.68, df=39, p=0.50), total gray matter volume (t=0.71, df=39, p=0.50), total white matter volume (t=0.23, df=39, p=0.80), or total CSF (t=0.83, df=39, p=0.40).
Discussion
To our knowledge, this is the first study to use a volumetric MRI-based parcellation method of the prefrontal cortex to examine structural abnormalities in major depression. The main findings of this study were 1) a pronounced reduction in left and right gray matter volumes in the anterior cingulate, the gyrus rectus, and the orbitofrontal cortex; 2) significant bilateral decreases in white matter volume and significant increases in CSF volume in the anterior cingulate and the gyrus rectus; 3) a significant bilateral reduction in CSF volume in the orbitofrontal cortex of depressed patients relative to comparison subjects. In sum, the present study shows that volumetric abnormalities occur in distinct tissue compartments of specific frontal subregions in elderly patients with depression.
On the basis of the structural imaging literature to date, the orbitofrontal cortex, anterior cingulate, and gyrus rectus have been previously identified as critical regions involved in major depression
(9,
29,
31,
34,
47), but this is the first time that cingulate volume abnormalities are reported in elderly depressed patients.
The present findings support the results of a prior report that found reduced gray matter volumes in the orbitofrontal cortex of elderly patients with major depression
(50). The present findings also contribute to the suggestive evidence that dysfunction of the orbitofrontal cortex may yield a characteristic state of depressed mood in which the ability to interrupt perseverative melancholic thoughts and anxious responses to ordinarily nonthreatening stimuli seems impaired
(48).
It is of interest that our results show a reduction of CSF volumes in the depressed patients relative to the comparison subjects in the orbitofrontal cortex. The mechanism of this CSF volume decrease is unclear. However, decreased CSF volumes may suggest that orbitofrontal cortical volume reduction is indicative of hypodevelopment rather than atrophy even in elderly depressed patients. Thus, it may be hypothesized that the individuals studied here were born with smaller volumes of the orbitofrontal cortex and, perhaps, with specific neuroanatomical changes in this region that over time led to exaggerated stress responses and aversive thought and emotion. Longitudinal studies, perhaps among those at risk for developing depression, may help clarify whether the abnormalities are static during the course of the illness (and more likely to be neurodevelopmental) or progressive (and more likely to be neurodegenerative) in nature.
In this context, it is also interesting to discuss our findings in the anterior cingulate and the gyrus rectus. In contrast to previous reports in younger patients
(9,
34), our results reveal bilateral abnormalities in these regions.
The present study reveals bilateral volume decreases of gray and white matter, along with significant bilateral CSF volume increases, in the anterior cingulate and the gyrus rectus. This pattern of findings might suggest that distinct neuroanatomical changes are occurring in these regions relative to the findings in the orbitofrontal cortex. Perhaps the increase in CSF is reflective of neurodegenerative processes rather than a neurodevelopmental abnormality in depressed patients with a later age at onset. Of note, glial pathology could play a primary role, given that reduced density and number of glia in the anterior cingulate have been reported in a neuropathological study of mood disorder
(49). It is possible, therefore, that the overall cortical changes observed in this region might point to a loss of fiber pathways that connect different brain regions participating in mood regulation. Indeed, the anterior cingulate is a critical area of integration between brain regions that have been implicated in the cognitive/affective and somatic/vegetative symptoms of depression. More specifically, the anterior cingulate is the origin of the anterior cingulate frontal-subcortical circuit
(2). It is interesting that this circuit receives major afferents from the hippocampus
(2), which communicates with higher-order association cortical regions through the entorhinal, perirhinal, and parahippocampal cortices
(50,
51). In addition, the anterior cingulate is interconnected with the amygdala through efferents to the lateral nucleus and through afferents from the basal nucleus, which also project to many higher-order areas
(52). The cingulate gyrus is reciprocally connected with the orbitofrontal cortex
(48). Stress and clinical depression are often associated with hypercortisolemia, which has neurotoxic properties
(53). It has been suggested that stress-induced reductions in neurotrophins may also play a role in the structural changes observed in patients with major depression
(54). Thus, if hypodevelopmental phenomena underlie the abnormalities in the orbitofrontal cortex, it could be speculated that a complex set of interrelated neurobiological events, perhaps mediated through these early structural changes, may constitute the path that leads to progressive cingulate damage over time.
Bilateral anterior cingulate abnormalities in elderly patients with depression may be supported by two previous functional neuroimaging studies: one study found a significant bilateral blood flow reduction in the anterior cingulate cortex in elderly depressed patients that persisted after electroconvulsive therapy
(17); de Asis and colleagues
(18) reported bilateral activation deficits in the anterior cingulate in a study that used brain activation paradigms. Of interest is that abnormalities of the anterior cingulate are thought to be associated with executive and psychomotor symptoms
(55), often prominent in geriatric depression
(18). On the other hand, a proton magnetic resonance spectroscopy study conducted by our group did not find any changes in
myo-inositol/creatine, choline/creatine, and
N-acetylaspartate/creatine ratios in the anterior cingulate of elderly patients with major depression
(19). Since the present investigation included some of the patients of the latter study
(19), the current findings may suggest that structural abnormalities and specific biochemical events might occur independent of one another.
It is noteworthy that the gyrus rectus shows structural abnormalities similar to those observed in the anterior cingulate, and it is important that the gyrus rectus is considered to be an extension of the anterior cingulate onto the frontal lobe
(56). This may help explain the similarity of the structural changes in both regions. It could also complement and strengthen our results, which propose bilateral anterior cingulate abnormalities as critical neurobiological features in elderly patients with depression. Bremner and colleagues
(29) found decreased gray matter volumes of the gyrus rectus in adult depressed patients without any structural changes in the anterior cingulate. To our knowledge, in the two volumetric MRI studies of elderly depressed patients with a focus on a specific region within the prefrontal cortex, the orbitofrontal cortex and gyrus rectus were combined into one single region of interest
(30,
31). However, the gyrus rectus might merit further investigation in major depression. Indeed, it may be of interest to note that functional imaging studies in schizophrenia have shown a clear distinction between the gyrus rectus and the orbitofrontal cortex during several cognitive tasks, suggesting that the gyrus rectus may be part of a circuit that mediates some specific emotional functions in humans
(57).
It might be argued that accelerated aging or increased vulnerability to the general effects of age could have contributed to the structural abnormalities detected in our study. Actually, there is controversy about which subregions of the prefrontal cortex are particularly affected by the aging process. Age effects reported in the anterior cingulate have been dependent on the method applied
(58). A selective preservation of the orbitofrontal cortex has been found in very old healthy elderly subjects
(59), while other investigations detected an age-associated volumetric reduction in this region
(58,
60). Although the application of different methods has been proposed as a possible explanation for these discrepancies, this issue may clearly warrant further investigation, also in view of the fact that previous studies revealed left-lateralized gray matter reduction in the anterior cingulate in younger patients, whereas here we report bilateral abnormalities in an elderly depressed population.
The present findings may be limited by small study group size, although the highly significant results in gray matter volumes are noteworthy for a relatively small sample.
A further limitation of this study concerns the potential for inflated type I error in comparisons of white matter and CSF changes in elderly patients with depression relative to healthy comparison subjects. Therefore, statistically less pronounced differences, such as the bilateral white matter and CSF abnormalities observed here, should be interpreted with caution. However, since this is the first study that explores white matter and CSF volumetric differences in addition to gray matter differences between depressed patients and healthy volunteers, we were willing to tolerate a higher chance of type I error rather than miss a true positive finding. Indeed, our results in the white matter and CSF compartments may provide a valuable complement to previous investigations of gray matter abnormalities in major depression
(9,
29–
31,
34), giving rise to new hypotheses regarding possible etiopathological mechanisms underlying structural cortical abnormalities.
It has been argued that white matter abnormalities should be interpreted with caution, given the lack of clear anatomical landmarks to define white matter subregions within the frontal lobe. In the present study, white matter was generally defined as tissue next to a straight line connecting the deepest point of the sulci that were considered as anatomical landmarks of a given subregion. The high interrater reliability for all segmented volumes may, however, support the notion that white matter measures interpreted in conjunction with gray matter offer a more appropriate and meaningful approach, even given limitations in defining white matter boundaries. Finally, future studies may be needed to specifically investigate the contribution of gender to structural abnormalities in elderly depression.
Conclusions
Highly pronounced robust gray matter deficits were observed in three brain regions, namely the anterior cingulate, the gyrus rectus, and the orbitofrontal cortex, abnormalities consistent with our predictions based on the neuroimaging and neuropathological literature. The extent to which the aforementioned abnormalities might be specifically related to elderly depressed patients remains to be clarified.
Further clinicopathological work, with imaging both in vivo and after death, will be needed to carefully examine radiopathological correlations and to draw further insights into the purported neuroanatomical hallmarks of elderly depression. In addition, future investigations should address the question to what extent age at illness onset, regardless of age, might be relevant to specific neuroanatomical disease markers. This consideration may be of special interest also in light of previous evidence revealing strikingly more severe white matter lesions in subjects with an onset of depression after age 60 years than in individuals who had an onset before age 60
(61).