Patient and Treatment Characteristics
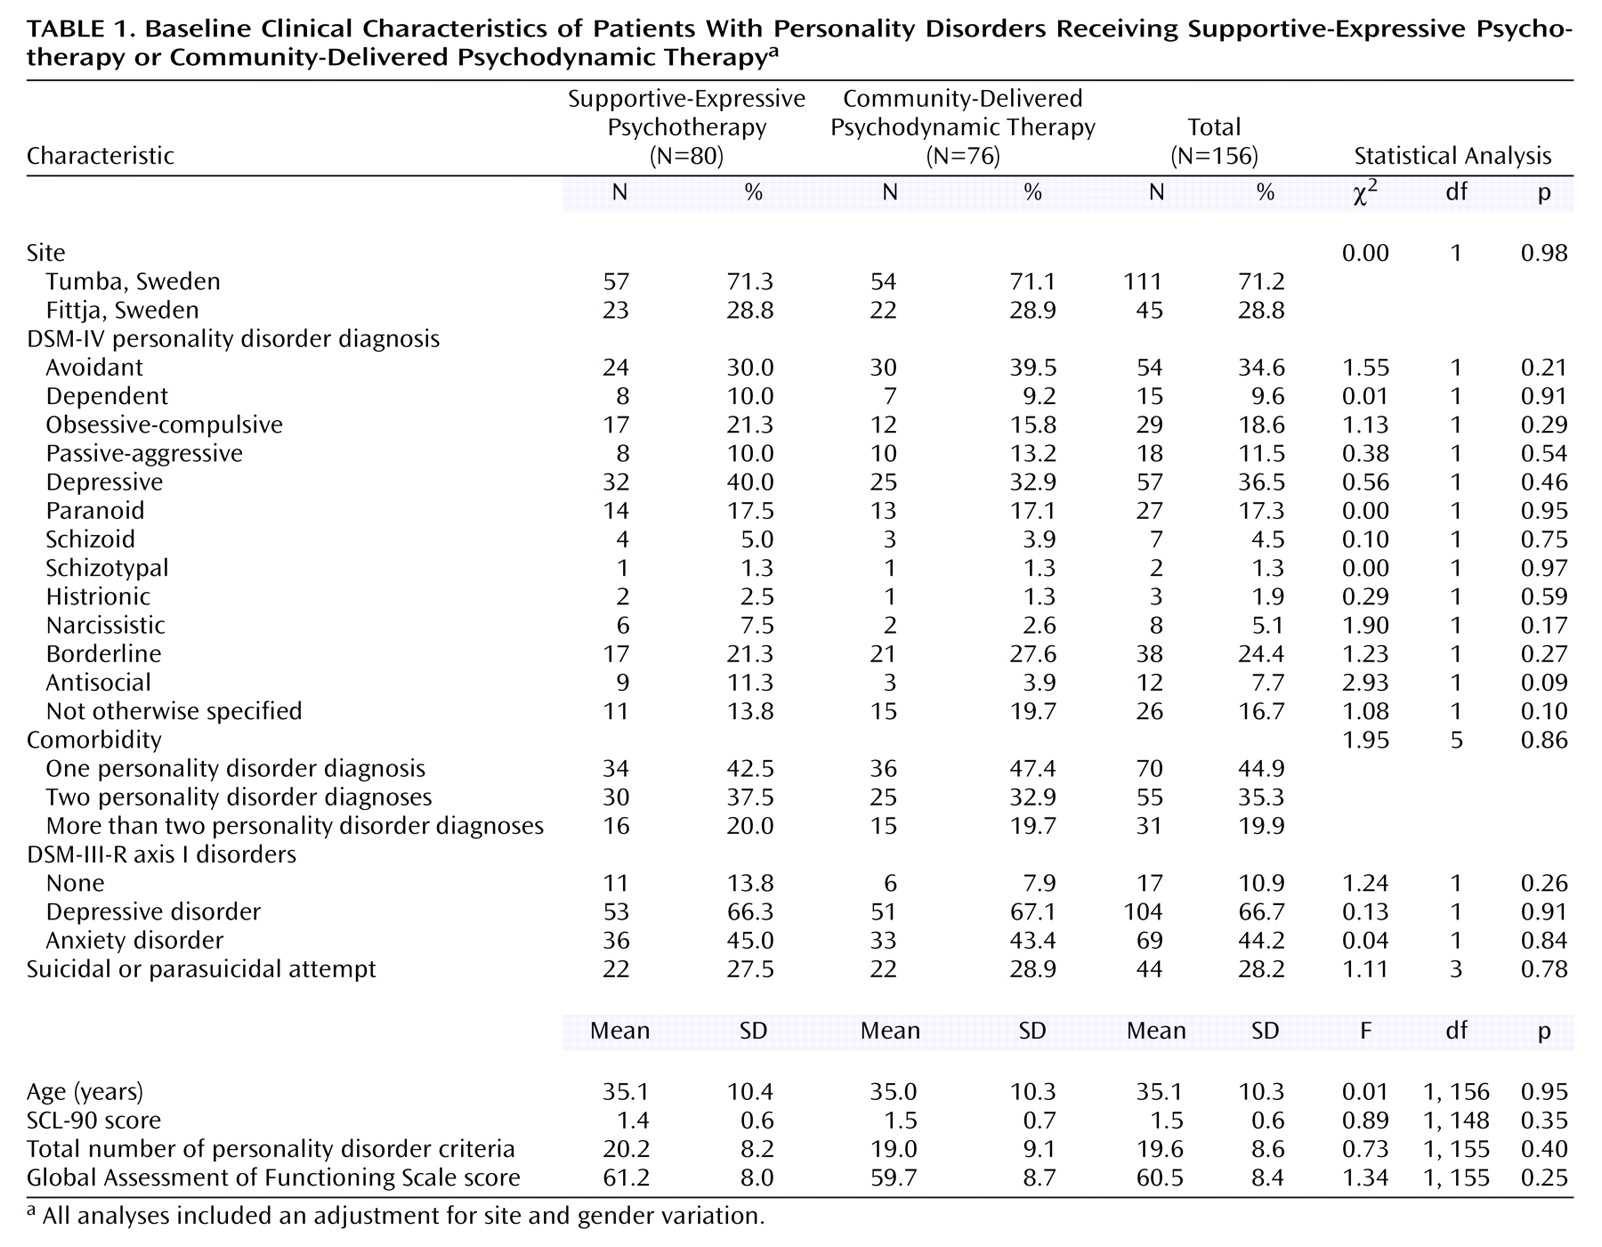
The patients’ clinical characteristics at baseline are presented in
Table 1. No significant differences were found between treatment groups or between treatment sites. Sociodemographically, the subjects were characterized by a low level of education (χ
2=1.19, df=2, p=0.55), a high prevalence of low vocational training, disability, and sick leave (χ
2=0.84, df=4, p=0.94), and a high level of single or divorced marital status (χ
2=0.59, df=1, p=0.44).
Data were collected from the patients’ records about the frequency of treatment during the first year and categorized into 1) once a week (supportive-expressive: N=52, 65.0%; community: N=43, 56.6%), 2) irregular, i.e., less frequent than once a week and associated with an inability to keep regular appointments scheduled once a week (supportive-expressive: N=16, 20.0%; community: N=17, 22.4%), and 3) no treatment, i.e., not attending more than two sessions after random assignment (supportive-expressive: N=12, 15.0%; community: N=16, 21.1%). No significant difference between the two treatments was found regarding frequency of treatment (χ2=1.35, df=2, p=0.51).
Data were obtained from 72.4% of the patients (N=113) at the 1-year assessment (supportive-expressive, N=61; community, N=52) and from 79.5% (N=124) at the 2-year assessment (supportive-expressive, N=66; community, N=58). The median time span from the pretreatment to posttreatment assessment was 432 days for the group receiving supportive-expressive psychotherapy (range=351–679) and 428 days for the group receiving community-delivered psychodynamic therapy (range=347–770) (t=–0.91, df=112, p=0.37). Between the posttreatment and follow-up assessments, the median time span was 409 days for supportive-expressive therapy (range=264–1,358) and 388 for community-delivered psychodynamic therapy (range=287–1,284) (t=0.33, df=97, p=0.74).
The mean number of total treatment sessions attended between pretreatment and follow-up was 26.2 (SD=15.2, median=30, range=0–78) for the supportive-expressive psychotherapy patients and 28.0 (SD=23.7, median=22, range=0–101) for the community-delivered therapy patients (Mann-Whitney U=2994, p<0.87). Between the pretreatment and posttreatment assessments, the supportive-expressive and community therapy groups had a mean of 24.7 (SD=13.0, median=30, range=0–40) and 21.3 (SD=15.5, median=21, range=0–61) sessions, respectively (Mann-Whitney U=2638, p<0.19).
Between pretreatment and posttreatment, 38 patients (47.5%) in the supportive-expressive therapy group and 43 patients (56.6%) in the community therapy group were given prescriptions for psychotropic medication (χ2=1.12, df=1, p=0.30). Between posttreatment and follow-up, 25 (31.3%) of the supportive-expressive psychotherapy patients and 31 (40.8%) of the patients receiving community-delivered psychodynamic therapy used psychotropic medication (χ2=1.54, df=1, p=0.21).
Outcome Analysis
Personality disorder diagnosis and severity
At the posttreatment assessment, 38 patients (33.6%) did not fulfill the criteria for a personality disorder diagnosis. At the follow-up assessment, 58 patients (46.8%) did not meet the criteria. There was no significant difference between treatments at either assessment.
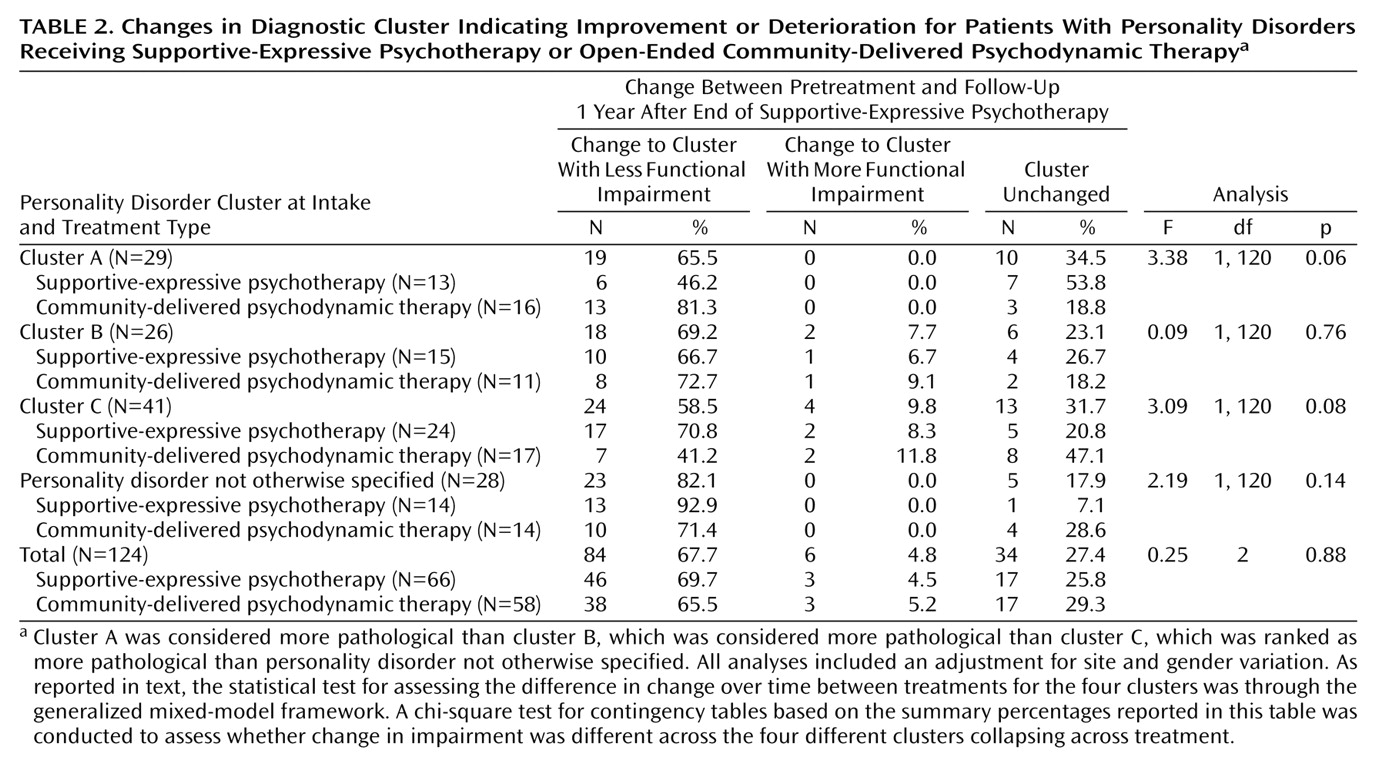
Change in functional impairment from pre-treatment to the one year follow-up was significant as a function of treatment and the four clusters (χ
2=59.51, df=12, p<0.001). This chi-square is based on the contingency table illustrated in
Table 2, where the degrees of freedom takes into account the zero cells. The patients with personality disorder not otherwise specified improved the most, while those with cluster C diagnoses improved the least (
Table 2). We did not find any significant difference between treatments (
Table 2).
Other clinical outcomes
The general mixed-model ANOVA showed that the overall severity of personality disorders decreased over time (
Table 3) for both treatment groups, but no difference between treatments was found. Scores on the SCL-90 improved significantly over time (
Table 3), but there was no difference between the two treatment groups. There also was a significant improvement in GAF scores over time but no significant difference between groups. Within-group effect sizes of the change from intake to the 2-year assessment are presented in
Table 3.
Implementation of the pattern-mixture method revealed that these findings were not dependent on the missing data mechanism; for the two-way interaction of completer status and time, p>0.33 for each outcome. Similarly, for the three-way interaction of completer status, time, and treatment condition, p>0.40 for each outcome.
To evaluate clinical significance, we compared the patients’ SCL-90 scores at follow-up 1 year after the end of supportive-expressive psychotherapy with those of the nonclinical sample. The results of both a clinical equivalency t test (CEt=1.69, df=863, p=0.95) and a traditional t test (t=–10.13, df=863, p<0.001) indicated that the patients changed significantly but did not return to nonclinical levels.
Number of posttreatment visits
All of the patients who received supportive-expressive psychotherapy were asked to refrain from further treatment after termination, but 13 patients (16.3%) still received additional treatment at the CMHCs, while 29 patients receiving community-delivered psychodynamic therapy (38.2%) continued treatment after the 1-year assessment (χ2=9.51, df=1, p<0.002). Generally, the patients receiving supportive-expressive psychotherapy had significantly fewer sessions (mean=1.5, SD=0.6, 95% confidence interval [CI]=0.27–2.73) than the patients in the community-delivered therapy group (mean=6.9, SD=1.7, 95% CI=3.42–10.45) between the posttreatment and follow-up assessments (Mann-Whitney U=2305.5, p<0.001).
Relationship between axis I and II improvement
To examine whether the change in axis II disorders (personality disorder severity index) was driven by change in axis I pathology, we partialled out the change in SCL-90 scores (a proxy of change in axis I) (F=53.24, df=1, 326.9, p<0.001) and found that the change in the personality disorder severity index over time was still significant (F=17.03, df=2, 230.3, p<0.001). Thus, the improvement in personality disorder pathology over time was over and beyond the change explained by psychiatric symptoms.


