Attention deficit hyperactivity disorder (ADHD) can be considered a generalized impulsivity disorder, with the traits of impulsivity manifesting at the motor, emotional, social, and attentional levels
(1). It has been suggested that impulsiveness is best measured in tasks of inhibitory control, since one of the most consistent findings in ADHD neuropsychology is reduced performance on tasks of motor response inhibition such as the go/no-go
(2,
3) and stop
(3–
5) tasks.
Functional magnetic resonance imaging (fMRI) studies have shown that motor response inhibition is mediated—not exclusively, but most consistently—by prefrontal cortical brain areas and the basal ganglia. The go/no-go task has been the most widely used paradigm, but this task is confounded by comeasuring other cognitive processes (such as selective attention) and has been associated with a widespread activation network, including frontal, parietal, and subcortical brain regions
(6–
8). The stop signal paradigm
(9) is a more suitable laboratory tool to measure inhibitory control because it measures the ability to withhold “at the last minute” a previously triggered motor response that may already be on its way to execution. It therefore has a higher load on inhibitory control than the go/no-go task
(8–
10). The stop task activates right prefrontal and striatal brain regions in block design
(8,
11) and elicits a single focus of right inferior prefrontal activation in event-related design
(10).
Functional imaging studies using the go/no-go and stop paradigms have shown abnormalities in frontal lobe activation in children and adolescents with ADHD. There have been, however, inconsistent findings regarding the direction of the effect. Two studies using the go/no-go task have found increased activation in prefrontal brain regions in small numbers of children with ADHD
(12,
13). When the stop task was applied in a block design, reduced activation was shown in seven children with ADHD in the right inferior prefrontal cortex and in the anterior cingulate gyrus
(5,
11). The most consistent findings across studies has been that of reduced caudate activation during response inhibition during performance of go/no-go
(12,
13) and stop
(5,
11) tasks.
To our knowledge, all previous functional neuroimaging studies involving ADHD subjects have been conducted with a majority either medicated or whose chronic stimulant medication treatment was halted for 1–3 days before scanning. Prior chronic stimulant medication exposure, however, constitutes a serious confound that may invalidate findings of ADHD-specific neuropathology. Animal studies have shown long-term changes with methylphenidate on dopamine function in frontal and striatal brain areas
(14,
15), which have also been shown in humans as a consequence of chronic stimulant abuse
(16,
17). Furthermore, brain activation could have been confounded by withdrawal effects in some patients.
Another confound in functional imaging studies on psychiatric patients is the likelihood of group differences in performance or strategies. It has been shown that differences in brain activation can be the artifact of performance differences rather than an expression of underlying functional neuropathology
(18).
In this study, we applied our adaptation of the stop task paradigm
(10) to a rapid, mixed trial, event-related fMRI study of a relatively large study group of 16 adolescents with ADHD who had never been medicated. The challenging stop task paradigm changes task parameters on an individual basis to ensure that every subject fails to inhibit on 50% of trials. This algorithm makes sure that each subject performs at the edge of his own inhibitory capacity while providing homogeneous performance across subjects and therefore across groups
(10). Signal contamination due to differences in the number of errors between patients and comparison subjects are therefore eliminated with this task design as opposed to previously used block designs
(10). Furthermore, the comparison between successful and unsuccessful stop trials controls perfectly for visual stimulation, response selection, difficulty level, and the “oddball” effect of low-frequency target detection.
There were thus two main aims to this study. To our knowledge, modern functional imaging techniques have never been used to investigate medication-naive patients with ADHD. We thus wanted to investigate whether abnormalities in prefrontal brain activation during inhibitory control are specific to ADHD neuropathology and unrelated to the effects of stimulant medication or to acute stimulant withdrawal symptoms. Second, the use of an event-related, individually adjusted stop task paradigm should provide homogeneous task performance across subjects and groups to avoid confounds of task performance differences.
A further advantage of the task design is that, besides measuring activation related to inhibition, it also allows us to measure brain activation in relation to inhibition failure and error detection. Brain activation related to error detection has so far not been investigated with modern functional imaging tools in patients with ADHD, but patients have been shown in neuropsychological tasks to have abnormal reactions to error detection and failure
(19). Moreover, we have shown that in healthy subjects, inhibition failure activates a network of the mesial prefrontal cortex, anterior cingulate, and inferior parietal cortices, brain areas that have been found to be structurally
(20) and functionally
(5,
11,
13,
21) abnormal in patients with ADHD.
We hypothesized that an adequately sized study group of medication-naive patients with ADHD matched for performance by the task design would still show reduced right inferior prefrontal activation during successful inhibition and would show abnormal activation in an error detection network of mesial prefrontal and parietal brain regions during inhibition failure. Furthermore, we hypothesized that abnormal brain activation would correlate with behavioral scores of ADHD.
Method
Subjects
Patients were 16 right-handed male adolescents, age range=9–16 years, recruited from parent support groups but with a clinical diagnosis of ADHD (combined type) according to DSM-IV criteria made by an external or internal psychiatrist. Exclusion criteria were psychiatric comorbidity, neurological abnormalities, epilepsy, substance abuse, or any previous treatment with stimulant medication. The only exception was conduct disorder, which can be seen as a complication of the disorder and was present in five adolescents with ADHD. All patients scored above threshold on the hyperactivity scale of the Strengths and Difficulties Questionnaire
(22) (mean=8.1, SD=2). They also scored above the IQ cutoff of Raven’s Standard Progressive Matrices (i.e., over 75 [fifth percentile rank])
(23). All patients were medication naive at the time of testing because of child/parent objection to medication, adverse/lack of response to medication, or testing taking place before initial prescription. The comparison subjects were 21 right-handed male healthy adolescents, age range=10–17, with no history of ADHD or any other mental or neurological disorder. They scored below threshold on the Strengths and Difficulties Questionnaire in total score and the component scales of hyperactivity (mean=2.6, SD=1), conduct problems, and emotional problems. They scored above the IQ test cutoff of 75 and had no history of neurotropic medication or substance abuse.
All subjects provided written consent, and the study was approved by the Ethical Committee of the Institute of Psychiatry, London.
The ADHD and comparison groups were matched in terms of age (mean=13 [SD=2.1] and 14 [SD=1.6] years, respectively) and IQ (mean=100 [SD=16] and 95 [SD=45]). As expected, the groups differed significantly in score on the Strengths and Difficulties Questionnaire hyperactivity scale (t=–0.9, df=35, p<0.0001).
Experimental Design
A rapid, mixed-trial, event-related fMRI design was used for the stop task
(10). As seen in
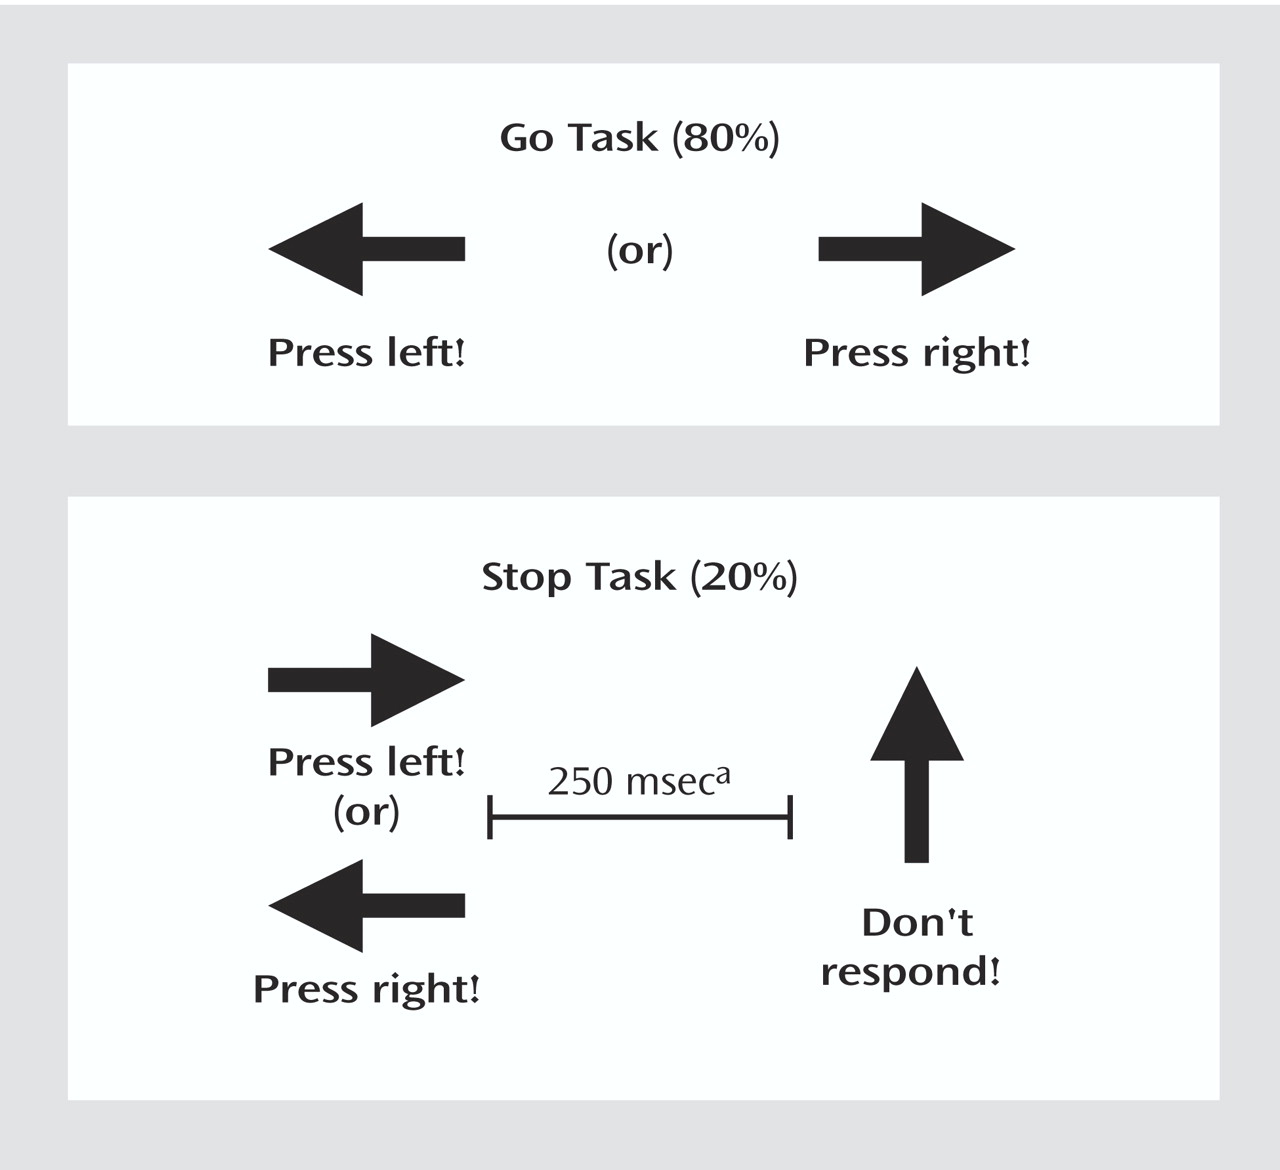
Figure 1, arrows (of 500-msec duration each) pointing either to the left or to the right appeared on the screen, with a mean interstimulus interval of 1.8 seconds. Interstimulus intervals were randomly varied between 1.6 and 2.0 to optimize statistical efficiency
(24). Subjects were instructed to make a button response with their left or right thumb corresponding to the arrow direction. In the unpredictable, infrequent stop trials (20% of trials), the arrows pointing left or right were followed (about 250 msec later) by arrows pointing upwards, and subjects had to inhibit their motor responses. The time interval of 250 msec between go-signal and stop-signal onsets changed individually according to each subject’s performance. It became 50 msec longer after a successful performance, making it harder to inhibit, and 50 msec shorter after an unsuccessful inhibition, making it easier to inhibit. The tracking algorithm ensured the task was equally challenging and difficult for each individual, providing 50% successful and 50% unsuccessful inhibition trials. Forty stop trials (20 of them appearing after a left-pointing arrow and 20 appearing after a right-pointing arrow) were pseudorandomly interspersed with 156 go trials (78 left-pointing arrows and 78 right-pointing arrows) and were at least three repetition times (TR) apart from each other to allow adequate separation of the hemodynamic response. Since the algorithm of the task design makes sure that subjects fail on half of all stop events, successful and unsuccessful stop events control each other for low frequency, as they result in equal frequencies at the end of the task, i.e., about 20 each .
In the event-related fMRI analysis, brain activation during successful inhibition—after subtraction from the baseline go-trial activation—is then subtracted from brain activation during unsuccessful inhibition—after subtraction of these from the baseline go-trial activation. Brain activation during successful inhibition was subtracted from brain activation during unsuccessful inhibition in order to control for attentional effects of the low-frequency appearance of stop trials. Both events also control each other for visual stimulation and response selection as well as difficulty levels. Activation during unsuccessful inhibition was subtracted from activation during go-trials in order to control for brain activation related to motor execution
(10).
fMRI Acquisition and Analysis
Gradient-echo echoplanar MRI data were acquired on a GE Signa 1.5-T Horizon LX System (General Electric, Milwaukee) at the Maudsley Hospital, London. Consistent image quality was ensured by a semiautomated quality control procedure. A quadrature birdcage head coil was used for radiofrequency transmission and reception. In each of 16 noncontiguous planes parallel to the anterior-posterior commissure, 196 T2*-weighted MRIs depicting blood-oxygen-level-dependent (BOLD) contrast covering the whole brain were acquired (TE=40 msec, TR=1.8 seconds, flip angle=90°, in-plane resolution=3.1 mm, slice thickness=7 mm, slice-skip=0.7 mm). At the same time, a high-resolution inversion recovery echo-planar image of the whole brain was acquired in the intercommissural plane (TE=40 msec, TI=180 msec, TR=16,000 msec, in-plane resolution=1.5 mm, slice thickness=3 mm, slice-skip=0.3 mm). This echoplanar MRI data set provided almost complete brain coverage.
Individual Analysis
The data were first realigned
(25) to minimize motion-related artifacts and smoothed using a Gaussian filter (full width at half maximum 7.2 mm). Time series analysis was then carried out by first convolving each experimental condition with Poisson functions, modelling delays of 4 and 8 seconds, respectively (to allow variability within this range). The weighted sum of these two convolutions that gave the best fit (least-squares) to the time series at each voxel was then computed and a goodness-of-fit statistic computed at each voxel, which consisted of the ratio of the sum of squares of deviations from the mean intensity value due to the model (fitted time series) divided by the sum of squares due to the residuals (original time series minus model time series). This statistic is called the SSQ ratio. The appropriate null distribution for assessing significance of any given SSQ ratio was then computed by using the wavelet-based data resampling method described in detail in Bullmore et al.
(26) and applying the model-fitting process to the resampled data. This process was repeated 20 times at each voxel and the data combined over all voxels, resulting in 20 “null” parametric maps of SSQ ratio for each subject that could be combined to give the overall null distribution of SSQ ratio. The same permutation strategy was applied at each voxel to preserve spatial correlational structure in the data. Voxels activated at any desired level of type I error can then be determined by obtaining the appropriate critical value of the SSQ ratio from the null distribution.
Group Mapping
The observed and randomized SSQ ratio maps were transformed into standard space by a two-stage process involving first a rigid body transformation of the fMRI data into a high-resolution inversion recovery image of the same subject followed by an affine transformation onto a Talairach template
(27). A generic brain activation map can be produced for each experimental condition by calculating the median observed SSQ ratio over all subjects at each voxel (median values were used to minimize outlier effects) at each intracerebral voxel in standard space
(28) and testing these median SSQ ratio values against the null distribution of median SSQ ratios computed from the identically transformed wavelet resampled data
(28). In order to increase sensitivity and reduce the multiple comparison problem encountered in fMRI, hypothesis testing was carried out at the cluster level using the method developed by Bullmore et al.
(26), initially for structural image analysis, and subsequently shown to give excellent cluster-wise type I error control in both structural and functional fMRI analysis. In this particular group mapping analyses, <1 false positive activated clusters were expected at a p value of <0.05 for voxel level and <0.01 at cluster level.
Analysis of Variance for Group Comparisons
Following transformation of the statistics maps (SSQ ratio) for each individual into standard space, it is possible to perform a randomization-based test for voxel-wise or cluster-wise differences. First, the difference between the mean SSQ ratio values in each group was calculated at each voxel. The mean ratio was then recalculated a large number of times at each voxel following random permutation of group membership. The latter operation yields the distribution of mean differences under the null hypothesis of no effect of group membership. Voxel-wise maps of significant group differences at any desired level of type I error can then be obtained using the appropriate threshold from the null distribution. Provided that the identical permutations are carried out at each voxel (to preserve spatial correlations) this method can then be extended to yield cluster-level differences using the method of Bullmore et al.
(26). For the group comparison, <1 false activated clusters were expected at a p value of <0.05 for voxel comparisons and p<0.01 for cluster comparisons.
Correlations
Correlations were performed between the power of fMRI BOLD responses in the clusters of significantly decreased activation in the ADHD group and measures on the Strengths and Difficulties Questionnaire. For closer analysis, the three-dimensional clusters were decomposed into two-dimensional clusters. For each of the significant two-dimensional clusters of between-group differences, the SSQ ratio of each patient was extracted and a series of correlation analyses were conducted within each group with the Strengths and Difficulties Questionnaire scores for hyperactivity.
To investigate the maturational delay hypothesis of ADHD, correlations between age and brain activation in those clusters that differed between groups were analyzed within the comparison group.
Results
There were no significant group differences in performance between adolescents with and without ADHD on any of the performance measures except for a higher variability of response to go signals and a higher rate of omission errors in patients with ADHD (
Table 1).
No significant group differences were observed in the extent of three-dimensional motion during task performance.
Activation During Successful Inhibition
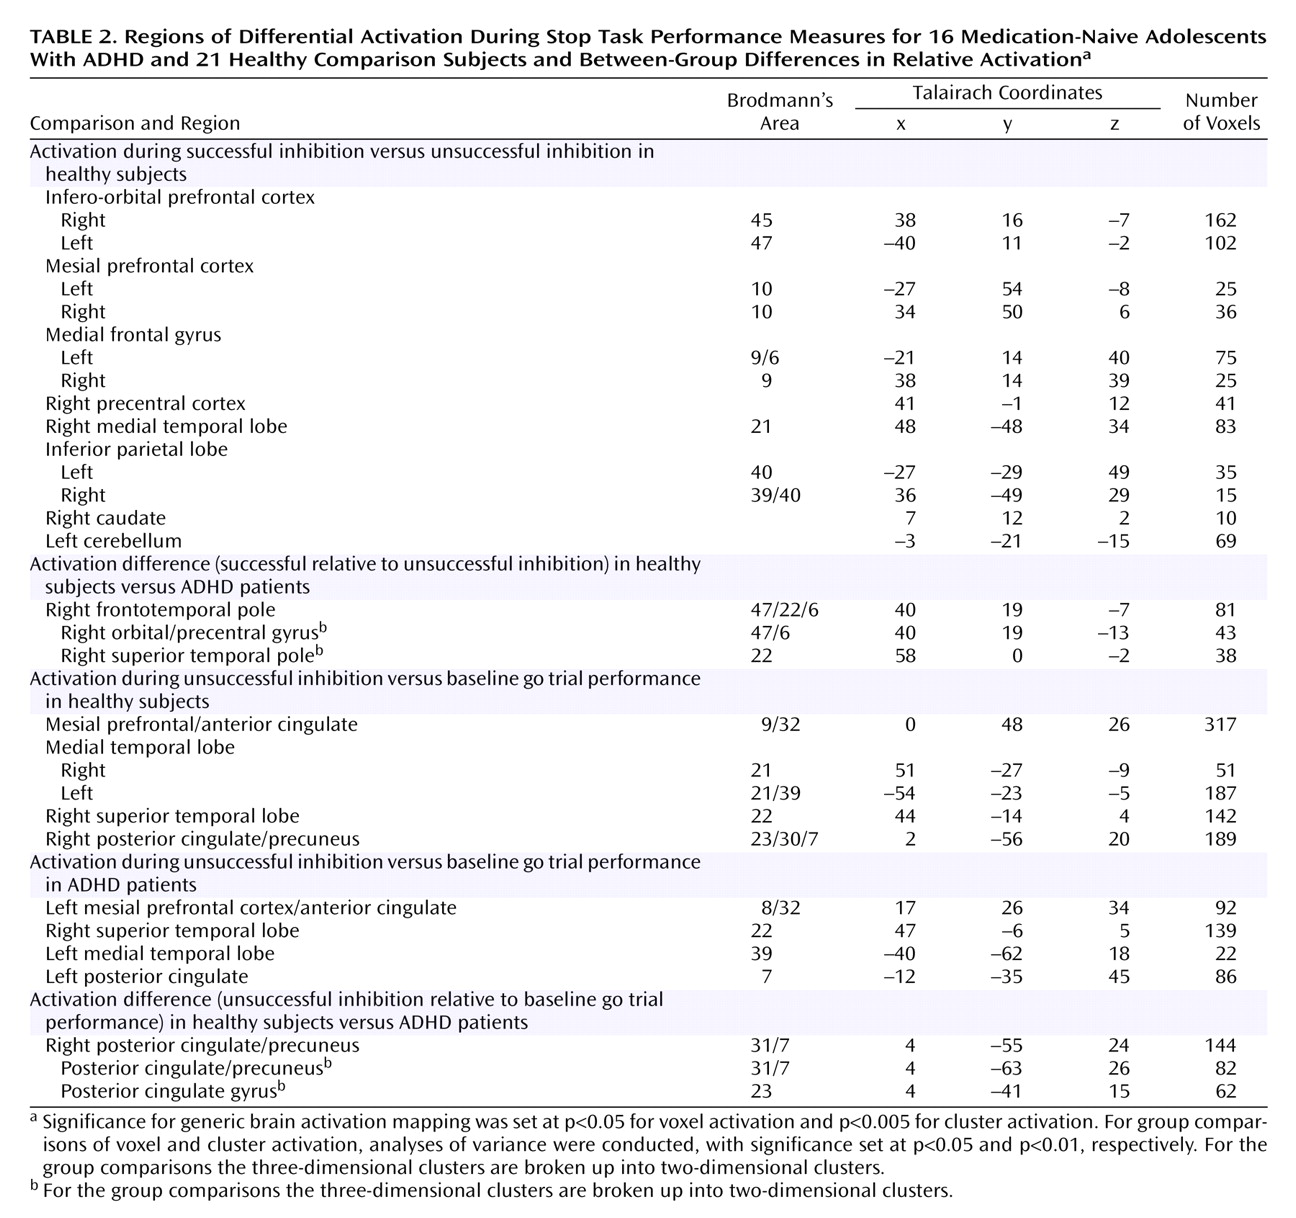
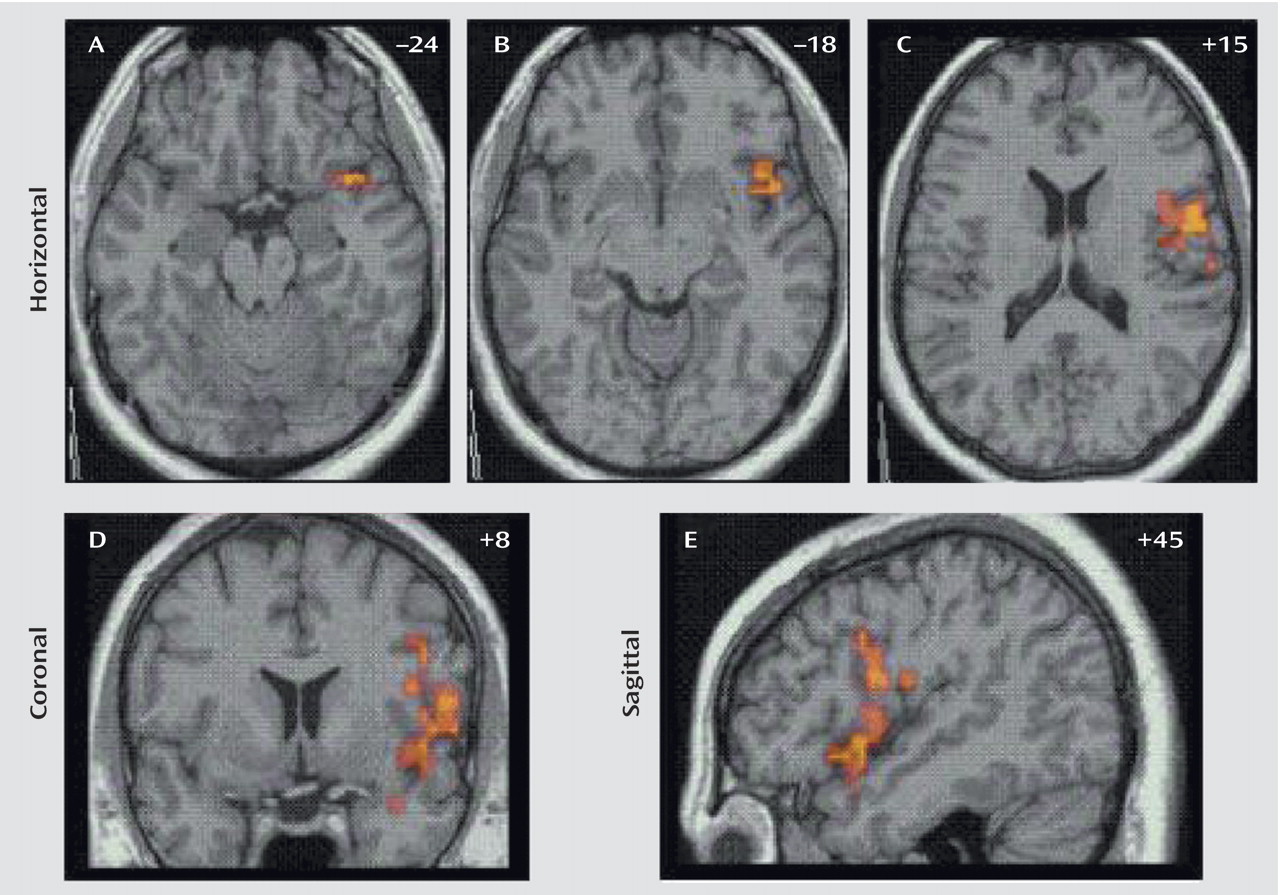
Generic brain activation during the successful performance of stop trials (subtracted from brain activation during the unsuccessfully performed stop trials) comprised in healthy adolescent boys a network of the right inferior and mesial prefrontal cortex, left dorsolateral prefrontal cortex, anterior cingulate gyrus, left parietal cortex, bilateral precentral cortex, and right hemisphere and vermis of the cerebellum. Patients with ADHD showed no superthreshold activation at this particular p value of 0.005. The comparison between healthy subjects and patients showed a major focus of increased activation for comparison subjects in the right orbitoinferior prefrontal cortex reaching deep into the insula that extended caudally into the precentral cortex and ventrally into the superior temporal lobe (
Table 2,
Figure 2). At a very lenient threshold (p<0.07), there was also increased putamen and caudate activation (Talairach coordinates: 14, –16, –1) in healthy compared to ADHD subjects.
Activation During Unsuccessful Inhibition
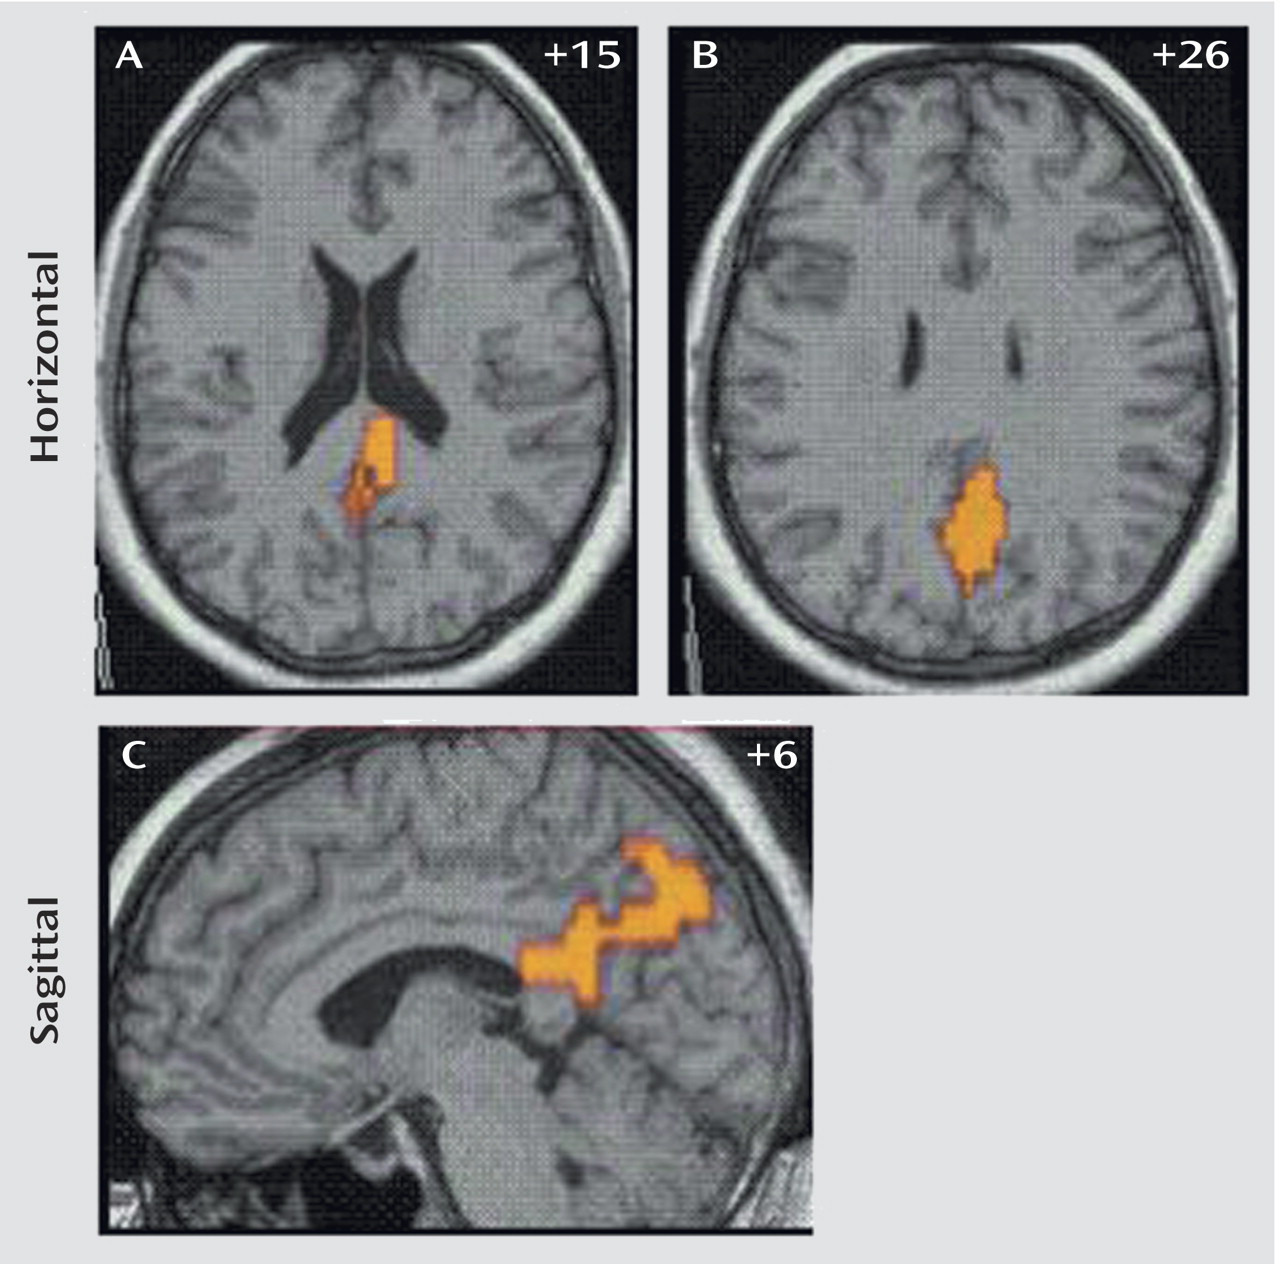
The generic activation patterns for unsuccessful stop trials, when contrasted with baseline go-trial activation, were strikingly similar in patients with ADHD and comparison subjects. Healthy subjects activated the left rostromesial prefrontal cortex, right middle and superior temporal lobes, left middle temporal lobe, and the posterior cingulate gyrus. Patients with ADHD showed generic brain activation in similar foci of rostromesial prefrontal cortex and right superior and left middle temporal lobes with, however, a more left hemispheric focus in the posterior cingulate gyrus. Significant differences were observed in the posterior cingulate and precuneus, where comparison subjects showed significantly increased activation (
Table 2,
Figure 3).
In order to ensure that the brain activation differences were not due to differences in statistical power, we reanalyzed the data with equal sample sizes (i.e., leaving out five subjects of the comparison group). The findings remained essentially unchanged.
Clinical Correlations
For the contrast between successful inhibition and error trials, there was a significant negative correlation in patients with ADHD between Strengths and Difficulties Questionnaire scores and power of brain activation in the right inferior prefrontal cortex in the two-dimensional peak coordinate of between-group differences in this region (Talairach coordinates: 40, 19, –13) (r=–0.40, p<0.05). No correlation was observed between Strengths and Difficulties Questionnaire scores and the power of activation in the superior temporal pole, insula, or precentral gyrus. For the contrast of error trials from baseline go-trials, there was a significant negative correlation for the peak of between-group differences at the border of the posterior cingulate gyrus and precuneus (Talairach coordinates: 4, –63, 26) (r=–0.50, p<0.02). No correlation was observed between the Strengths and Difficulties Questionnaire scores in comparison subjects and the power of activation in these brain regions.
No significant positive correlation was observed between brain activation and age in the comparison group in those brain regions that differed between patients and healthy subjects.
Discussion
Relative to comparison subjects, medication-naive patients with ADHD showed reduced brain activation in the right inferior prefrontal cortex at the junction to the superior temporal lobe during successful inhibition and in the posterior cingulate and precuneus during inhibition failure. The right inferior prefrontal cortex and posterior cingulate/precuneus reductions correlated with behavioral scores on the Strengths and Difficulty Questionnaire in patients.
Successful Inhibition
The finding of reduced right inferior prefrontal activation in medication-naive adolescents with ADHD during successful inhibition replicates, specifies, and extends our previous findings of reduced right prefrontal, anterior cingulate, and caudate activation in ADHD during performance of a block-design stop task
(11). As in our previous study, the focus of reduced right inferior prefrontal activation reaches deep into the insula and borders the superior temporal lobe. Both the inferior prefrontal and anterior temporal cortices have been found to be bilaterally dysmorphic in medicated and unmedicated children with ADHD in structural studies
(20,
29). Single photon emission tomography studies have found reduced cerebral blood flow at rest in the inferior prefrontal and temporal lobes
(30,
31). PET studies of adult ADHD patients found reduced activation in left-hemispheric temporal lobes and insula during working memory
(32) and decision making
(33). It thus appears that the insula, inferior prefrontal, and anterior temporal lobes are brain regions of structural and functional abnormality in ADHD. It is interesting that brain abnormalities were still observed in ADHD patients, even with equal inhibitory performance. However, ADHD adolescents still showed increased intrasubject variability and omission errors to go signals, suggestive of problems with concentration to task
(5). While our stop task controlled for probability of inhibition, some neuropsychological studies
(34–
36) but not others
(37) have found longer stop signal reaction times in children with ADHD in this task. The relatively small number of subjects in this study compared with neuropsychological studies and the fact that ADHD adolescents rather than children participated may have contributed to the lack of performance differences in this inhibitory measure. The reduced brain activation in the ADHD group in the right inferior prefrontal cortex without observable alternative brain activation during equal performance may thus have been caused by idiosyncratic differences in strategies and a greater heterogeneity in activation patterns.
As opposed to our previous study that used the stop task
(5,
11,
21) and other studies using the go/no-go task
(12,
13), we could not replicate in this study the caudate underactivation in ADHD children during inhibition trials. Small subcortical brain regions like the basal ganglia are relatively difficult to observe in fMRI, and it is possible that the reduced power pertinent to rapid event-related designs as opposed to block designs has prevented the detection of the basal ganglia in this study. In line with this hypothesis is the fact that we did observe reduced putamen and caudate activation in ADHD patients at a very lenient threshold. A second possible explanation could be that caudate activation is not directly related to the withdrawal of a motor response in stop tasks but to other cognitive functions more uncontrolled in block designs or go/no-go tasks
(5). Last, it is also possible that basal ganglia abnormalities in ADHD are secondary to chronic stimulant medication, given the well-established effect of stimulants on striatal brain areas
(14–
17) and were therefore not observed in our medication-naive sample.
Inhibition Failure
During inhibition failure, both groups activated the mesial prefrontal cortex, anterior cingulate gyrus, and temporal and mesial parietal lobes. In particular, mesial and parietal cortices, especially anterior and posterior cingulate gyri, have previously been shown to be related to inhibition failure in healthy adults on the same stop paradigm
(10) and in go/no-go
(38–
40) tasks. The reduced activation in the posterior cingulate gyrus and precuneus in ADHD boys during inhibition failure is a novel and interesting finding. The posterior and anterior cingulate form part of the midline attentional system whereby the posterior cingulate is particularly relevant for the dynamic reallocation of visual-spatial attention
(41). Because of its role in anticipatory attention allocation, the cingulate cortex has been suggested to be a neural interface between attention and motivation
(41,
42). The reduced activation in the posterior cingulate cortex appears to be the neural substrate for the reduced capacity in ADHD for appropriate attention (re)allocation after committing errors
(19), which may ultimately be responsible for reduced performance on a variety of executive tasks. An electrophysiological study showed reduced “error positivity” over parietal and occipital brain regions in ADHD boys after making mistakes in a stop task, interpreted by the authors as a deficient evaluation of their incorrect responses
(43). In an earlier electrophysiological study, a similar finding of abnormal activation over posterior brain regions during stop failures in ADHD subjects was interpreted as less efficient posterior orienting mechanisms
(44). The posterior cingulate focus of this study could be the precise anatomical locus of this reduced electrophysiological parietal activation. We have previously found anterior and posterior cingulate reductions in patients with ADHD during a motor delay task
(11,
21). Posterior cingulate activation has been shown to correlate negatively with symptom severity in adult ADHD during decision making
(33) and has been found in a structural study to be reduced in gray matter
(45). In our previous functional study, prefrontal and posterior cingulate activation showed a positive age effect, suggesting a maturational delay in ADHD
(21). The maturational delay hypothesis, however, could not be confirmed in this study, since we did not find positive age-related effects within the comparison group in those brain regions that differed between groups.
The negative correlation in ADHD patients between hyperactivity scores on the Strengths and Difficulties Questionnaire and reduced activation in the right inferior prefrontal cortex and precuneus/posterior cingulate further confirms a relationship between behavioral impulsiveness and neural abnormalities in relation to response inhibition and error detection. The findings of brain abnormalities in medication-naive ADHD patients during cognitive challenge extend findings of structural abnormalities in medication-naive patients with ADHD
(20).
In conclusion, a relatively large group of medication-naive patients with ADHD showed nearly identical brain abnormalities during stop task performance as previously medicated patients with ADHD in a previous study. Future studies comparing medicated and unmedicated patients with ADHD in the same study will be needed to specify potential differences related to medication history, but it appears from this study that brain activation abnormalities during inhibitory control are specific to ADHD pathology and independent of stimulant medication. This is further confirmed by the fact that abnormal brain activation in ADHD is independent of task performance, since it is still observed when task performance is idiosyncratically adjusted and thus matched between groups.

