It is now widely accepted that the antipsychotic effects of dopamine receptor antagonists occur within a “therapeutic window” between 60% and 80% of striatal dopamine 2 and 3 (D
2 /D
3 ) receptor occupancy. The incidence of extrapyramidal side effects increases when occupancy exceeds the 80% threshold
(1) . This rule seems to apply also for most of the second-generation antipsychotics
(2) . However, in a [
11 C]raclopride positron emission tomography (PET) study in normal volunteers to determine the optimal dose of aripiprazole for clinical trials in schizophrenia, it was shown that aripiprazole occupies more than 90% of striatal D
2 /D
3 receptors at clinically effective doses
(3) . This finding was recently confirmed in patients with schizophrenia
(4) . On the basis of these findings, we concluded that the original conception of a “therapeutic window” of antipsychotic drug action applies to antagonists only
(5) .
However, all the above-mentioned observations were made with reference to receptor occupancy in striatal structures only. With the advent of high-affinity radiotracers belonging to the class of substituted benzamides, it became possible to quantify extrastriatal dopamine receptors. While earlier PET studies with the moderate-affinity D
2 /D
3 antagonist [
11 C]raclopride demonstrated that the second-generation antipsychotics clozapine and quetiapine occupy striatal D
2 /D
3 receptors to a significantly lesser extent than do other antipsychotics
(2,
6,
7), it was later consistently shown in studies with high-affinity ligands that these two compounds nonetheless occupy a significantly higher proportion of temporolimbic than striatal D
2 /D
3 receptors
(8,
9) . We demonstrated that the clinical antipsychotic efficacy of clozapine is likely more related to its binding in the temporal cortex than to its striatal binding
(8) . This “preferential” extrastriatal binding of second-generation antipsychotics, which was initially observed by Pilowsky et al.
(10), has since been shown for several other second-generation antipsychotics, at least to a modest extent
(11,
12) . On the other hand, a recent PET study by Agid et al. found that striatal D
2 blockade predicted antipsychotic response better than frontal, temporal, and thalamic receptor occupancy
(13) . The potential reasons for some controversial aspects of this phenomenon
(14) have been discussed previously
(8,
15) .
One of the most widely used radiotracers for the quantification of extrastriatal D
2 /D
3 receptors is [
18 F]fallypride
(16,
17) . This ligand displays similarly high affinities for D
2 and D
3 receptors and negligible affinity for any other common neuroreceptor
(18) . Its fluorine-18 label offers the advantage of a longer physical half-life compared with, for example, the carbon-11 label of [
11 C]raclopride. [
18 F]Fallypride is an ideal tracer for the study of both striatal and extrastriatal receptors in a single PET scan. Human studies have consistently demonstrated that a 180-minute dynamic scan allows for establishment of a transient equilibrium both in extrastriatal regions of low receptor abundance and in the striatum
(16,
17) .
To further characterize aripiprazole’s extrastriatal binding and temporal changes in its binding in relation to its serum concentration, we conducted PET studies with [ 18 F]fallypride in patients with schizophrenia at varying time points after the last drug administration. Furthermore, to determine the clinical relevance of the serum concentration/occupancy relationship, we measured the serum concentration of aripiprazole in a large sample of patients with schizophrenia who were treated with this drug under clinical conditions.
Method
The study was approved by the ethics committee of the Medical Faculty of the RWTH Aachen University, Aachen, Germany, and the German radiation safety authorities. Twenty-four patients with schizophrenia were enrolled in the study after giving written informed consent. Sixteen patients underwent scanning while being treated with aripiprazole, and eight patients who were drug-free on admission to the hospital served as a comparison group. All PET investigations were performed in the Department of Nuclear Medicine of the RWTH Aachen University. In addition, aripiprazole serum concentrations were determined as part of a routine therapeutic drug monitoring program in a large group of patients (N=128) who were treated with aripiprazole. These patients were treated in the Department of Psychiatry of the University of Mainz, Mainz, Germany.
Participants
The comparison group consisted of eight patients 18 to 58 years of age (mean=31 years, SD=14) suffering from schizophrenia as defined by DSM-IV criteria. They had been free of any psychotropic medication for at least 6 months, with the exception of small doses of lorazepam in some instances. All comparison subjects received a physical examination, a mental state examination, blood and urine analysis, electroencephalography, electrocardiography, and cerebral MRI.
The patient group consisted of 16 medicated patients (15 of them male; mean age=30 years, SD=10, range=19–50) who were diagnosed with either schizophrenia or schizoaffective disorder according to DSM-IV criteria. The mean age of the medicated patients did not significantly differ from that of the unmedicated participants. All patients had received an ongoing stable daily dose of aripiprazole (5–30 mg/day) according to clinical needs for at least 4 weeks prior to scanning. Seven patients received concomitant antidepressant medication, three patients were treated with zopiclone for insomnia, and five patients received lorazepam.
Clinical Sample
The large clinical patient sample consisted of 128 patients (34% women; mean age=33.8 years, SD=10.7), from whom a total of 203 serum samples were collected. The mean dose of aripiprazole was 20 mg/day (SD=9, median=15, range=10–60). Blood samples were taken at trough levels at 8 a.m. before administration of aripiprazole.
Radiochemistry
The [
18 F]fallypride was synthesized at the Institute for Nuclear Chemistry of the University of Mainz as described in detail elsewhere for its congener [
18 F]desmethoxyfallypride
(19) . The tosylated precursor, ((
S )-
N -[(1-allyl)-2-pyrrolidinyl)-methyl]-5-(3-toluenesulfonyloxypropyl)-2,3-dimethoxybenzamide (5 mg, 10 mmol), was dissolved in 1 ml acetonitrile, treated for 5 minutes at 85°C with potassium carbonate (5 mg, 36 mmol), and subsequently reacted with [
18 F]fluoride for 20 minutes at 85°C. [
18 F]Fallypride was isolated using high-performance liquid chromatography and adsorbed on a C18 cartridge, and the product was eluted with 1 ml ethanol. The final fraction was diluted with 9 ml of an isotonic sodium chloride solution and sterilized by ultrafiltration.
Data Acquisition and Analysis
Images were acquired on a Siemens ECAT EXACT whole-body PET scanner. Data acquisition comprised a series of 39 time frames (3×20 seconds, 3×1 minute, 3×2 minutes, 3×3 minutes, 21×5 minutes, 2×8 minutes, and 4×10 minutes) for a total scan duration of 180 minutes. After a 15-minute transmission scan, a mean of 207 MBq (SD=48) of [ 18 F]fallypride was injected as a bolus intravenously. The specific activity at the time of injection was 194 GBq/μmol (SD=484), corresponding to an injected mass of 2.3 μg (SD=2.6). Neither specific activities (unmedicated patients: 101 GBq/μmole [SD=103]; medicated patients: 235 GBq/μmole [SD=577]) nor injected mass (unmedicated patients: 2.1 μg [SD=1.7]; medicated patients: 2.7 μg [SD=3.0]) differed significantly between unmedicated patients and patients treated with aripiprazole. The injected mass did not correlate with the measured binding potentials (BP) in any region in the unmedicated subjects. Thus, it is unlikely that the radiotracer occupied a significant proportion (>5%) of receptors even in brain regions with low receptor density.
The magnitude of BP was calculated on a voxelwise basis using the Lammertsma simplified reference tissue model, which is based on a two-tissue compartment model
(19,
20) . The cerebellum was chosen as a reference region because it is generally considered to be nearly devoid of dopamine receptors. We cannot exclude the possibility that the occupancy values in our study were slightly underestimated because of a small degree of specific binding in the cerebellum
(21) . However, Kessler et al.
(22) compared regional binding potentials obtained with Logan plots with metabolite-corrected plasma input function with those obtained with the reference region method and found a correlation coefficient greater than 0.99 with a slope of 1.0
(22) . Furthermore, these authors did not detect any differences between cerebellar and white matter binding in the ratio of unblocked versus blocked states. Thus, underestimation should be less than 5 percent at the occupancies obtained in our study
(23) . For determination of D
2 /D
3 receptor occupancy, the averaged BPs of eight unmedicated patients were used as the common baseline value. Images were reconstructed with filtered backprojection using a Ramp filter and a Hamming filter (filter width=4 mm). After attenuation and motion corrections, the whole dynamic emission recording was stereotactically normalized into Montreal Neurological Institute coordinates using a predefined ligand-specific D
2 /D
3 template. To this end, a polynomial warping algorithm implemented in the MEDx software, version 3.43 (Medical Numerics, Germantown, Md.), was used.
Calculation of D 2 /D 3 Receptor Occupancy
The individual participant’s receptor occupancy was defined as percentage reduction of BP relative to the baseline BP according to the following equation:
Predefined templates of polygonal volumes of interest were used to calculate time activity curves for the cerebellum (2.38 cm 3 ), the caudate nucleus (0.52 cm 3 ), the putamen (1.14 cm 3 ), the thalamus (2.50 cm 3 ), the amygdala (0.31 cm 3 ), and the inferior temporal cortex (3.61 cm 3 ). The inferior temporal cortex (anterior and medial parts) was used as representative of cortical binding because the D 2 /D 3 receptor density in this region is highest compared with all other cortical regions. A mean BP Unmedicated value for each volume of interest was then calculated by averaging BP values from eight unmedicated patients. BP Medicated was calculated in an identical manner for the 16 patient studies.
Aripiprazole Pharmacokinetic Data
Aripiprazole was administered in single doses in the morning in all cases. Dosing details for individual patients in relation to tracer injection are provided in
Table 1 . Blood samples were collected at 8 a.m. (immediately before ingestion of aripiprazole) and again immediately before [
18 F]fallypride bolus injection. The PET scans were started between 1 p.m. and 6 p.m. Aripiprazole serum concentrations were determined according to a previously published method
(24) with high-performance liquid chromatography including column switching with online sample cleanup and online ultraviolet detection of aripiprazole and its main metabolite, dehydroaripiprazole
(24) . The within-run and between-run imprecision of the assay was below 15%, and the limits of quantification were below 50 ng/ml for both analytes.
Statistical Analyses
Statistical analyses were carried out with SPSS, version 14.0 (SPSS, Inc., Chicago). Means and standard deviations were calculated for serum concentrations and occupancy values. Unpaired t tests were used to compare D
2 /D
3 BP values for the groups of unmedicated and aripiprazole-treated patients. A general linear model for repeated measures with within-subjects factor at five levels was applied to compare D
2 /D
3 receptor occupancy in the five regions evaluated: putamen, caudate nucleus, thalamus, amygdala, and inferior temporal cortex. Spearman rank correlations were calculated for relationships between aripiprazole doses and serum concentrations and brain D
2 /D
3 receptor occupancy values. Serum concentrations (trough serum levels in the morning and levels at the time of injection) and D
2 /D
3 receptor occupancy values were fitted to a one-site ligand binding model by nonlinear regression analysis using Sigma Plot, version 9.0 (Systat, San Jose, Calif.), using the following equation:
where E max is the maximum attainable receptor occupancy, EC 50 is the serum concentration predicted to provide 50% of the maximum attainable receptor occupancy, and C Ari is the serum concentration of aripiprazole. In all analyses, the two-tailed level of statistical significance was set at α=0.05.
Results
The entire group of aripiprazole-treated patients had statistically significantly lower mean D 2 /D 3 receptor BP values than did the unmedicated patients in the putamen (mean=4.1 [SD=2.7] compared with mean=24.1 [SD=3.6], respectively; t=15.2, df=22, p<0.001), the caudate nucleus (mean=3.4 [SD=2.3] compared with mean=21.8 [SD=3.2]; t=16.3, df=22, p<0.001), the thalamus (mean=0.36 [SD=0.17] compared with mean=2.36 [SD=0.43]; t=16.4, df=22, p<0.001), the amygdala (mean=0.51 [SD=0.21] compared with mean=3.39 [SD=1.47]; t=7.8, df=22, p<0.001), and the inferior temporal cortex (mean=0.15 [SD=0.08] compared with mean=0.87 [SD=0.12]; t=17.7, df=22, p<0.001).
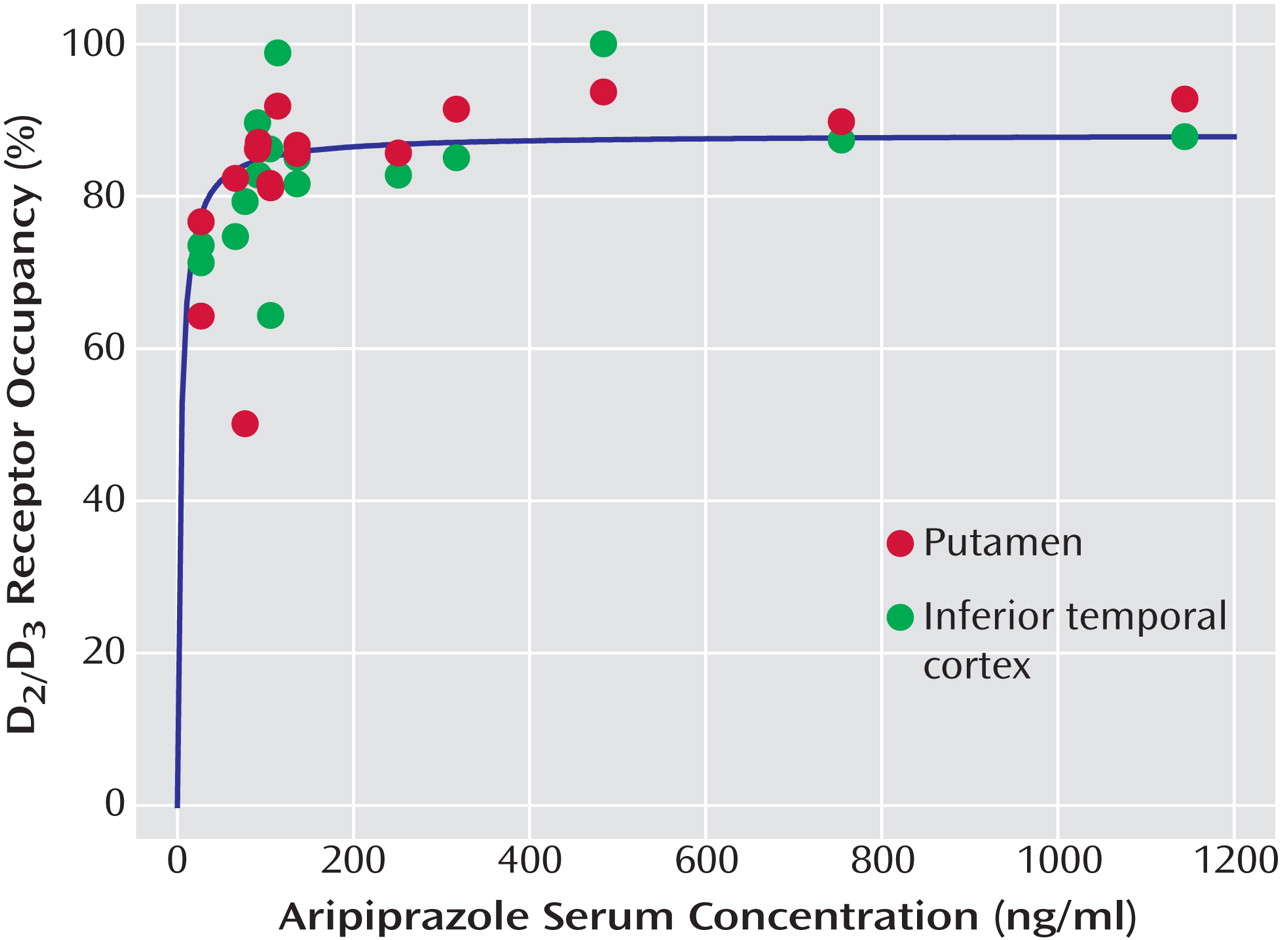
Aripiprazole occupied high proportions of D
2 /D
3 receptors to a similar extent throughout the brain, with mean occupancy values close to complete saturation (see
Tables 1 and
2 and
Figure 1 ). A repeated-measures analysis of variance with within-subjects factor at five levels revealed no significant difference in D
2 /D
3 receptor occupancy across the five regions examined (
Table 2,
Figure 1 ).
The mean aripiprazole serum concentration at the time of radiotracer injection was 245 ng/ml (SD=307, range=27–1144). The mean dehydroaripiprazole serum level at the time of injection was 58 ng/ml (SD=60, range=0–210). Trough serum concentrations determined in the morning before aripiprazole administration were similar to those obtained at the time of the PET scan (aripiprazole: 282 ng/ml [SD=267, range=50–862]; dehydroaripiprazole: 76 ng/ml [SD=84, range=0–261; data missing for five subjects]). The mean administered aripiprazole dose was 18.8 mg/day (SD=7.2, range=5–30). The daily aripiprazole dose did not correlate significantly with either the trough aripiprazole serum concentration or the serum concentration at the time of tracer injection. There was also no correlation between daily dose of aripiprazole and D 2 /D 3 receptor occupancy in any brain region investigated.
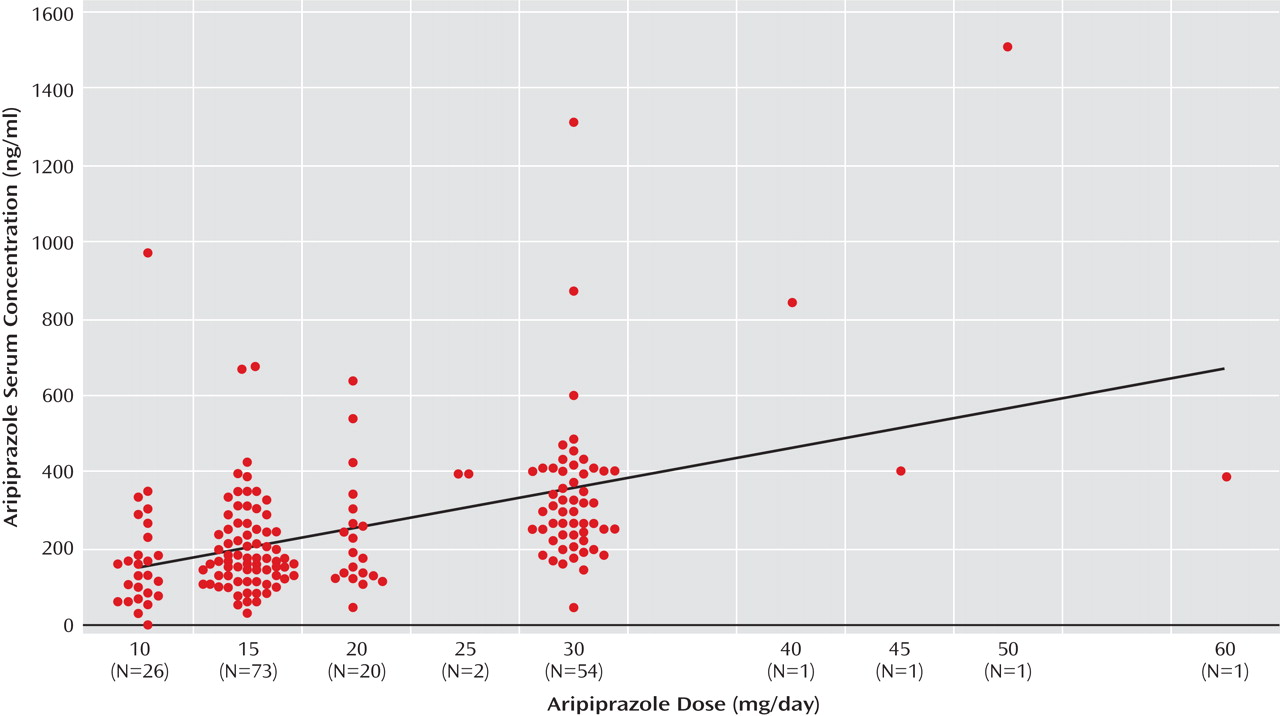
In the large clinical sample, in which aripiprazole serum concentrations were collected independently from the PET study, the mean level was 228 ng/ml (SD=142, median=196, 25th to 75th percentile range=134–294). Here, blood levels correlated significantly with doses (r=0.510, p<0.01;
Figure 2 ).
When aripiprazole serum concentrations and occupancy values were related to each other according to the law of mass action (see Statistical Analyses in the Method section), serum concentrations were significantly positively correlated with D
2 /D
3 receptor occupancy values for all regions evaluated. Positive correlations were found between aripiprazole serum concentrations and occupancy values in the putamen (r=0.62, df=14, p<0.0001;
Figure 1 ), the caudate nucleus (r=0.61, df=14, p<0.0001), the thalamus (r=0.62, df=14, p<0.0001), the amygdala (r=0.51, df=14, p<0.0001), and the inferior temporal cortex (r=0.57, df=14, p<0.0001;
Figure 1 ).
Figure 1 shows the relationship between aripiprazole serum concentration and receptor occupancy in the putamen and the inferior temporal cortex. D
2 /D
3 dopamine receptors were almost completely occupied homogeneously throughout the brain at aripiprazole serum concentrations above approximately 100–150 ng/ml. There were only marginal differences in EC
50 values between the analyzed brain regions (range=4–10 ng/ml;
Table 2 ).
Correlations between receptor occupancies and serum concentrations were slightly better in four of the five brain regions when values for aripiprazole and the active main metabolite dehydroaripiprazole were added (putamen: r=0.67, df=14, E max =95%, EC 50 =20 ng/ml, p<0.0001; caudate nucleus: r=0.67, df=14, E max =95%, EC 50 =18 ng/ml, p<0.0001; thalamus: r=0.70, df=14, E max =92%, EC 50 =12 ng/ml, p<0.0001; amygdala: r=0.50, df=14, E max =89%, EC 50 =7 ng/ml, p<0.0001; inferior temporal cortex: r=0.60, df=14, E max =92%, EC 50 =15 ng/ml, p<0.0001).
The PET scans were performed at a range of time points after the last drug administration (range=4–78 hours;
Table 1 ). Aripiprazole occupancy of D
2 /D
3 dopamine receptors persisted for several days after the last dosing (
Table 1 ).
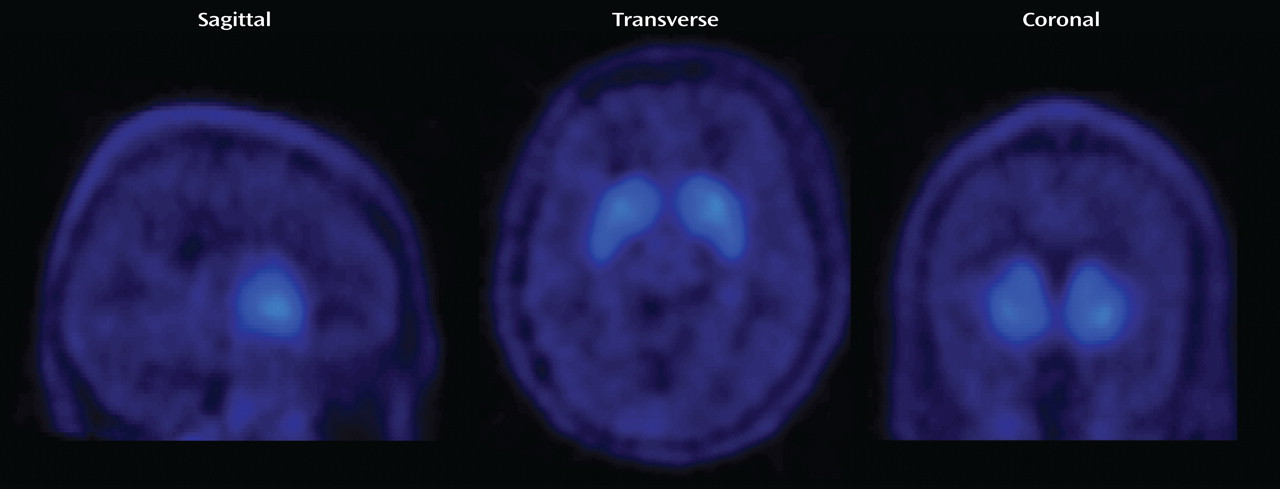
Figure 3 shows parametric BP images of a patient who was treated with a daily aripiprazole dose of 30 mg. He was withdrawn from medication and underwent scanning approximately 78 hours after the last dose. Even after 3 days off medication, the D
2 /D
3 dopamine receptor occupancy in this patient’s brain was close to 80% (putamen, 81%; caudate nucleus, 83%; thalamus, 75%; amygdala, 75%; inferior temporal cortex, 64%). Regardless of the time of the PET scan relative to the last drug administration, serum concentrations and occupancy values could be described by one single concentration/occupancy curve (
Figure 1 ).
Discussion
In this study, we demonstrated that aripiprazole almost completely saturates both striatal and extrastriatal D
2 /D
3 receptors over a wide range of serum levels typical of those obtained in clinical practice. With regard to aripiprazole’s striatal binding, our results are entirely concordant with our earlier observations in a PET study with [
11 C]raclopride in normal volunteers
(3,
5), a finding that was recently confirmed in patients with schizophrenia
(4) . In addition, we could not detect any preferential extrastriatal binding of aripiprazole. This feature of aripiprazole stands in contrast to the preferential extrastriatal binding of other second-generation antipsychotics. Furthermore, this study showed that the rate of aripiprazole’s dissociation from D
2 /D
3 receptors is very low. Taking into account aripiprazole’s long serum elimination half-life of about 72 hours, our observation of almost complete D
2 /D
3 receptor occupancy above a serum concentration of approximately 100–150 ng/ml suggests that in patients treated with aripiprazole under clinical conditions, D
2 /D
3 receptors remain almost saturated for as long as 1 week after the last drug administration. Our findings have important theoretical and clinical implications, as discussed below.
Although this is the third study demonstrating striatal D
2 /D
3 receptor occupancies above 80% under clinically used dosages of aripiprazole
(3,
5), it is the first to clearly show a relationship between aripiprazole serum concentrations under clinical conditions and D
2 /D
3 receptor occupancy in striatum and extrastriatal regions. While D
2 /D
3 receptor occupancy by aripiprazole reaches a plateau of almost complete D
2 /D
3 receptor saturation at serum concentrations of approximately 100–150 ng/ml, the mean aripiprazole serum concentration in the larger clinical sample of 128 patients was above 200 ng/ml. Considerably higher serum concentrations, in some cases even above 1000 ng/ml, were not rare in the clinically established dosage range (
Table 1,
Figure 2 ). In a recent study with 164 patients treated with aripiprazole, the mean serum aripiprazole concentration was 214 ng/ml
(25) . In a subsample of 75 patients receiving aripiprazole monotherapy, it was demonstrated that clinical improvement was optimal at serum concentrations between 150 and 300 ng/ml and that side effects were rare below 250 ng/ml
(25) . This clearly confirms the view that the very high D
2 /D
3 receptor occupancy associated with aripiprazole not only is innoxious but also represents a requirement for effective treatment
(5) . This unique characteristic of aripiprazole is most likely due to its particular pharmacological profile, namely, partial agonism or “functional selectivity” at D
2 -like dopamine receptors
(26) . Extrapyramidal side effects are rare even under very high aripiprazole serum concentrations
(25), and even the highest serum concentrations in our patient sample were not associated with significant extrapyramidal side effects. Taken together, these observations suggest that there is a serum concentration threshold of 100–150 ng/ml for antipsychotic efficacy. Furthermore, the therapeutic index of aripiprazole is evidently very broad and not usually limited by the occurrence of extrapyramidal side effects. Individual differences in the sensitivity for prodopaminergic effects of aripiprazole might explain the occasional presentation of the main side effects, which are agitation and sleeplessness.
Aripiprazole is metabolized via the hepatic cytochrome P450 enzyme system, specifically the isoenzymes CYP2D6 and CYP3A4. Inhibition or induction of these enzymes—for example, through comedication—leads to predictable changes in aripiprazole serum concentrations
(25) . Mutation in the gene encoding for the CYP2D6 isoenzyme can lead to markedly increased aripiprazole serum concentrations
(27,
28) . Conversely, CYP2D6 ultrarapid metabolizers would be expected to present with unusually low serum concentrations of aripiprazole. Thus, in many clinical situations, individual assessment of the aripiprazole serum concentration may guide further treatment decisions.
Another finding of this study is that aripiprazole produces prolonged occupancy of cerebral D
2 /D
3 dopamine receptors (
Table 1,
Figure 3 ). This observation was expected, given aripiprazole’s high affinity for dopamine receptors and its long plasma elimination half-life (approximately 60–70 hours)
(29) . We calculate that if aripiprazole were withdrawn in patients with serum levels above 600 ng/ml, the drug would still almost completely occupy D
2 /D
3 receptors for almost 1 week after the last dose. Regardless of the time of the PET scan relative to the last drug administration, the estimated data could be almost perfectly described by a single nonlinear fit according to the law of mass action (
Figure 1 ). These findings seem to contrast somewhat with a recent report that aripiprazole dissociates very rapidly from the D
2 receptor
(30) . However, PET cannot provide information about the temporal dynamics of a pharmaceutical on a microenvironmental synaptic level. Therefore, it is theoretically possible that aripiprazole is slowly released from the D
2 /D
3 receptor from a macroscopic view but still dissociates rapidly if the association rate is comparably high. Nevertheless, our PET studies indicate that “atypicality” in its original sense (absence of extrapyramidal side effects) can be achieved by several mechanisms, such as D
2 partial agonism or low D
2 affinity
(8) . We show that transient occupancy of D
2 /D
3 receptors, as seen with some low-affinity second-generation antipsychotics, is not a prerequisite for low liability to extrapyramidal side effects
(31) . Aripiprazole’s properties as a 5-HT
1A agonist and a 5-HT
2 antagonist might also contribute to its “atypical” clinical characteristics, although these receptors are occupied to a relatively small extent at clinically used dosages
(4) .
It has been demonstrated, by us and others
(8,
9), that especially low-affinity antipsychotics, such as clozapine and quetiapine, occupy brain D
2 /D
3 receptors to a lesser extent in striatal than in extrastriatal, especially cortical, brain regions. In the present case of aripiprazole, we could not detect regional differences in occupancy. Striatal and cortical binding could be described by virtually identical serum concentration/occupancy curves (
Figure 1 ). A lack of regionally heterogeneous binding and a slow dissociation from D
2 receptors have also been described for haloperidol
(32,
33) . Aripiprazole and haloperidol have in common their high affinity for D
2 -like dopamine receptors and their long plasma elimination half-life. Therefore, we suggest that the lack of differential regional binding at D
2 receptors is not a characteristic that separates first-generation from second-generation antipsychotics. Rather, regional differences in occupancy may occur as a function of affinity of the specific antipsychotic. Compounds with a short half-life and/or a low affinity, such as clozapine, typically present a flat plasma concentration/occupancy curve
(8), whereas compounds with a long plasma half-life and/or a high affinity, such as haloperidol, are described by a steep curve. The most likely explanation for differential regional binding of low-affinity compounds is the regionally different competition of these compounds from endogenous dopamine
(34) . Interstitial dopamine concentrations in animal striatum are significantly higher compared with cortical concentrations when measured with microdialysis
(35,
36) . Furthermore, there are markedly different kinetics of dopamine release and reuptake across brain regions
(37) . For compounds that are characterized by a much higher affinity for D
2 receptors than dopamine itself, this competition might be irrelevant.


