The Roles of Maternal Depression, Serotonin Reuptake Inhibitor Treatment, and Concomitant Benzodiazepine Use on Infant Neurobehavioral Functioning Over the First Postnatal Month
Abstract
Objective:
Method:
Results:
Conclusions:
Method
Participants
| Total | No-Exposureb | Depressionc | SSRId | SSRI Plus Benzodiazepinee | ||||||
|---|---|---|---|---|---|---|---|---|---|---|
| Variable | N | % | N | % | N | % | N | % | N | % |
| Total enrolled/met eligibility criteria in pregnancy | 243 | 86 | 78 | 65 | 14 | |||||
| Withdrew, lost to follow-up, or moved before delivery | 17 | 8 | 4 | 5 | 0 | |||||
| Anxiety disorder diagnosis only | 4 | 4 | 0 | 0 | 0 | |||||
| Other psychiatric medication without SSRI medication | 18 | 6 | 12 | 0 | 0 | |||||
| Total eligible through pregnancy (N; % of enrolled) | 204 | 84.0 | 68 | 79.1 | 62 | 79.5 | 60 | 92.3 | 14 | 100.0f |
| Preterm birth (N; % of eligible at birth) | 20 | 9.8 | 2 | 2.9 | 6 | 9.7 | 8 | 13.3 | 4 | 28.6g |
| Final sample eligible for standardized newborn assessment (N; % enrolled) | 184 | 90.2 | 66 | 97.1 | 56 | 90.3 | 52 | 86.7 | 10 | 71.4 |
| Completed all five assessments (N; % of eligible) | 104 | 56.5 | 39 | 59.1 | 31 | 55.4 | 29 | 55.8 | 5 | 50.0 |
| Completed 2–4 assessments (N; % of eligible) | 70 | 38.0 | 25 | 37.9 | 19 | 33.9 | 23 | 44.2 | 3 | 30.0 |
| Completed one assessment (N; % of eligible) | 10 | 5.4 | 2 | 3.0 | 6 | 10.7 | 0 | 0.0 | 2 | 20.0 |
Measures
Depression and Antidepressant Group Classification
Infant Measures
Statistical Analyses
Results
Demographic Characteristics
| Characteristic | Total (N=184) | A: No Exposure (N=66)a | B: Depression (N=56)b | C: SSRI (N=52)c | D: SSRI Plus Benzodiazepine (N=10)d | Test Statistice | Pairwise Comparisonsf | ||||||
|---|---|---|---|---|---|---|---|---|---|---|---|---|---|
| Mothers | |||||||||||||
| Mean | SD | Mean | SD | Mean | SD | Mean | SD | Mean | SD | F | p | ||
| Maternal age (years) | 28.3 | 5.9 | 27.3 | 5.9 | 27.1 | 6.0 | 30.4 | 5.1 | 30.8 | 4.9 | 4.44 | 0.005 | C>A** & B** |
| Number of pregnancies | 2.3 | 1.5 | 1.9 | 1.1 | 2.4 | 1.4 | 2.6 | 1.4 | 4.1 | 2.3 | 8.57 | 0.001 | A<C* & D***; D>B*** & C** |
| Number of living children | 0.8 | 1.1 | 0.5 | 0.7 | 0.9 | 1.2 | 1.0 | 0.9 | 1.9 | 1.9 | 6.27 | 0.001 | A<C* & D***; D>B*** & C* |
| Maternal body mass index prepregnancyg | 27.0 | 6.4 | 25.5 | 6.2 | 27.2 | 6.5 | 28.2 | 6.3 | 29.9 | 6.1 | 2.48 | 0.063 | |
| Gestational weeks at first prenatal visith | 7.8 | 3.4 | 8.1 | 3.9 | 7.6 | 3.9 | 7.6 | 2.5 | 7.1 | 3.0 | 0.38 | 0.765 | |
| Anxiety severity-pregnancyi | 10.0 | 7.2 | 4.8 | 3.2 | 11.6 | 5.8 | 14.0 | 8.4 | 15.4 | 7.3 | 27.09 | 0.001 | B, C, & D>A***; B=C=D |
| Depression severity-pregnancyj | 18.7 | 9.8 | 11.9 | 4.7 | 22.9 | 7.7 | 21.1 | 9.9 | 28.7 | 16.7 | 26.29 | 0.001 | B, C, & D>A***; D>C**; B=C & D |
| Depression severity-pospartumj | 12.6 | 9.8 | 7.4 | 4.3 | 14.6 | 7.7 | 15.3 | 11.0 | 24.8 | 19.3 | 15.91 | 0.001 | B, C, & D>A***; D>B** & C** |
| N | % | N | % | N | % | N | % | N | % | χ2 | p | ||
| Depression severity categoryj | |||||||||||||
| None | 74 | 40.4 | 50 | 75.8 | 5 | 8.9 | 17 | 33.3 | 2 | 20.0 | 42.46 | 0.001 | B, C, & D>A***; B=C=D |
| Mild | 69 | 37.7 | 16 | 24.2 | 30 | 53.6 | 21 | 40.4 | 3 | 30.0 | |||
| Moderate | 32 | 17.5 | 0 | 0.0 | 19 | 33.9 | 12 | 23.5 | 1 | 10.0 | |||
| Severe | 8 | 4.4 | 0 | 0.0 | 2 | 3.6 | 2 | 3.9 | 4 | 40.0 | |||
| Any anxiety disorder | 48 | 26.1 | 0 | 0.0 | 15 | 26.8 | 23 | 44.2 | 10 | 100 | 16.11 | 0.001 | D>B*** & C*** |
| Not married | 83 | 45.9 | 25 | 37.9 | 34 | 64.2 | 18 | 34.6 | 6 | 60.0 | 11.68 | 0.008 | B>A* & C* |
| Ethnicity | |||||||||||||
| Hispanic | 57 | 31.0 | 24 | 36.4 | 26 | 46.4 | 4 | 7.7 | 3 | 30.0 | 16.17 | 0.001 | C<A*** & B*** |
| Non-Whitek | 59 | 33.0 | 25 | 38.5 | 21 | 40.4 | 11 | 21.2 | 2 | 20.0 | 6.04 | 0.110 | |
| Lowest socioeconomic status on Hollingshead Four-Factor Indexl | 28 | 15.8 | 9 | 13.6 | 11 | 21.2 | 6 | 12.0 | 2 | 22.2 | 2.13 | 0.546 | |
| Infants | |||||||||||||
| Mean | SD | Mean | SD | Mean | SD | Mean | SD | Mean | SD | F | p | ||
| Birth weight (grams) | 3.4 | 0.5 | 3.6 | 0.6 | 3.4 | 0.4 | 3.4 | 0.5 | 3.3 | 0.3 | 2.22 | 0.088 | |
| Gestational age at birth (weeks) | 39.4 | 1.0 | 39.5 | 1.1 | 39.5 | 0.9 | 39.3 | 1.1 | 38.6 | 0.7 | 2.58 | 0.055 | |
| N | % | N | % | N | % | N | % | N | % | χ2 | p | ||
| Male | 89 | 48.4 | 36 | 54.5 | 26 | 46.4 | 23 | 44.2 | 4 | 40.0 | 1.72 | 0.632 | |
| 5-Minute Apgar score <9 | 20 | 10.9 | 6 | 9.1 | 6 | 10.7 | 7 | 13.5 | 1 | 10.0 | 0.52 | 0.914 | |
| Cesarean section delivery | 54 | 29.3 | 16 | 24.2 | 18 | 32.1 | 18 | 34.6 | 2 | 20.0 | 2.13 | 0.545 | |
| Neonatal intensive care unit admission | 13 | 7.1 | 4 | 6.1 | 1 | 1.8 | 6 | 11.5 | 2 | 20.0 | 5.15 | 0.161 | |
| Respiratory distress | 10 | 5.4 | 4 | 6.1 | 1 | 1.8 | 4 | 7.7 | 1 | 10.0 | 1.96 | 0.581 | |
| Breastfeeding at birth | 138 | 75.2 | 56 | 85.7 | 41 | 73.5 | 35 | 67.4 | 6 | 60.0 | 5.84 | 0.120 | |
Birth Outcomes
Prenatal SSRI Use
| Variable | SSRI (N=52) | SSRI Plus Benzodiazepine (N=10) | ||
|---|---|---|---|---|
| Mean | SD | Mean | SD | |
| Mean daily standard dose equivalent SSRIb | 1.7 | 1.0 | 1.7 | 0.9 |
| Days of SSRI use in pregnancy | 189.7 | 90.6 | 167.3 | 85.3 |
| Days of SSRI use in the first postnatal month | 19.5 | 12.4 | 27.0 | 1.1 |
| Maternal plasma SSRI level at delivery (ng/ml)c | 21.4 | 24.3 | 29.6 | 17.7 |
| Infant cord blood SSRI level at delivery (ng/ml)d | 12.3 | 9.9 | 7.3 | 4.4 |
| N | % | N | % | |
| Number using SSRIs in the first trimester | 39 | 75.0 | 5 | 50.0 |
| Number using SSRIs in the second trimester | 44 | 86.6 | 8 | 80.0 |
| Number using SSRIs in the third trimester | 41 | 78.9 | 9 | 90.0 |
| Number using SSRIs in the first postnatal month | 41 | 78.9 | 10 | 100.0 |
| Primary SSRI Taken | ||||
| Sertraline | 32 | 61.5 | 6 | 60.0 |
| Citalopram | 7 | 13.5 | 3 | 30.0 |
| Escitalopram | 3 | 5.8 | 0 | |
| Fluoxetine | 5 | 9.6 | 1 | 10.0 |
| Venlafaxine | 4 | 7.7 | 0 | |
| Duloxetine | 1 | 1.9 | 0 | |
| Benzodiazepine use in pregnancy | ||||
| Benzodiazepine use through delivery | 0 | 9 | 90.0 | |
| Benzodiazepine use in the first postnatal month | 0 | 8 | 80.0 | |
| Clonazepam | 0 | 2 | 20.0 | |
| Lorazepam | 0 | 6 | 60.0 | |
| Alprazolam | 0 | 2 | 20.0 | |
| Other concurrent medications | ||||
| Atypical antidepressant (bupropion) | 3 | 5.8 | 3 | 30.0 |
| Hypnotic antidepressant (trazodone, amitriptyline) | 6 | 11.5 | 1 | 10.0 |
| Hypnotic, non-benzodiazepine | 5 | 9.6 | 3 | 30.0 |
| Buspirone | 0 | 1 | 10.0 | |
| Melatonin | 1 | 1.9 | 0 | |
| Hydroxyzine | 0 | 1 | 10.0 | |
| Zolpidem tartrate | 4 | 7.7 | 1 | 10.0 |
| Atypical antipsychotic (quetiapine) | 1 | 1.9 | 0 | |
Main Effects of Exposure Group on Newborn Neurobehavior
| Variable | Group Main Effect | Model 3 Group-Estimated Means (Standard Errors) | Comparison Tests for Significant Modelsh | ||||||||||||
|---|---|---|---|---|---|---|---|---|---|---|---|---|---|---|---|
| Model 1 | Model 2 | Model 3 | A | B | C | D | |||||||||
| Unadjusteda | Adjustedb | Adjusted Plusc | No Exposured | Depressione | SSRIf | SSRI Plus Benzodiazepineg | |||||||||
| χ2 | p | χ2 | p | χ2 | p | Mean | SE | Mean | SE | Mean | SE | Mean | SE | ||
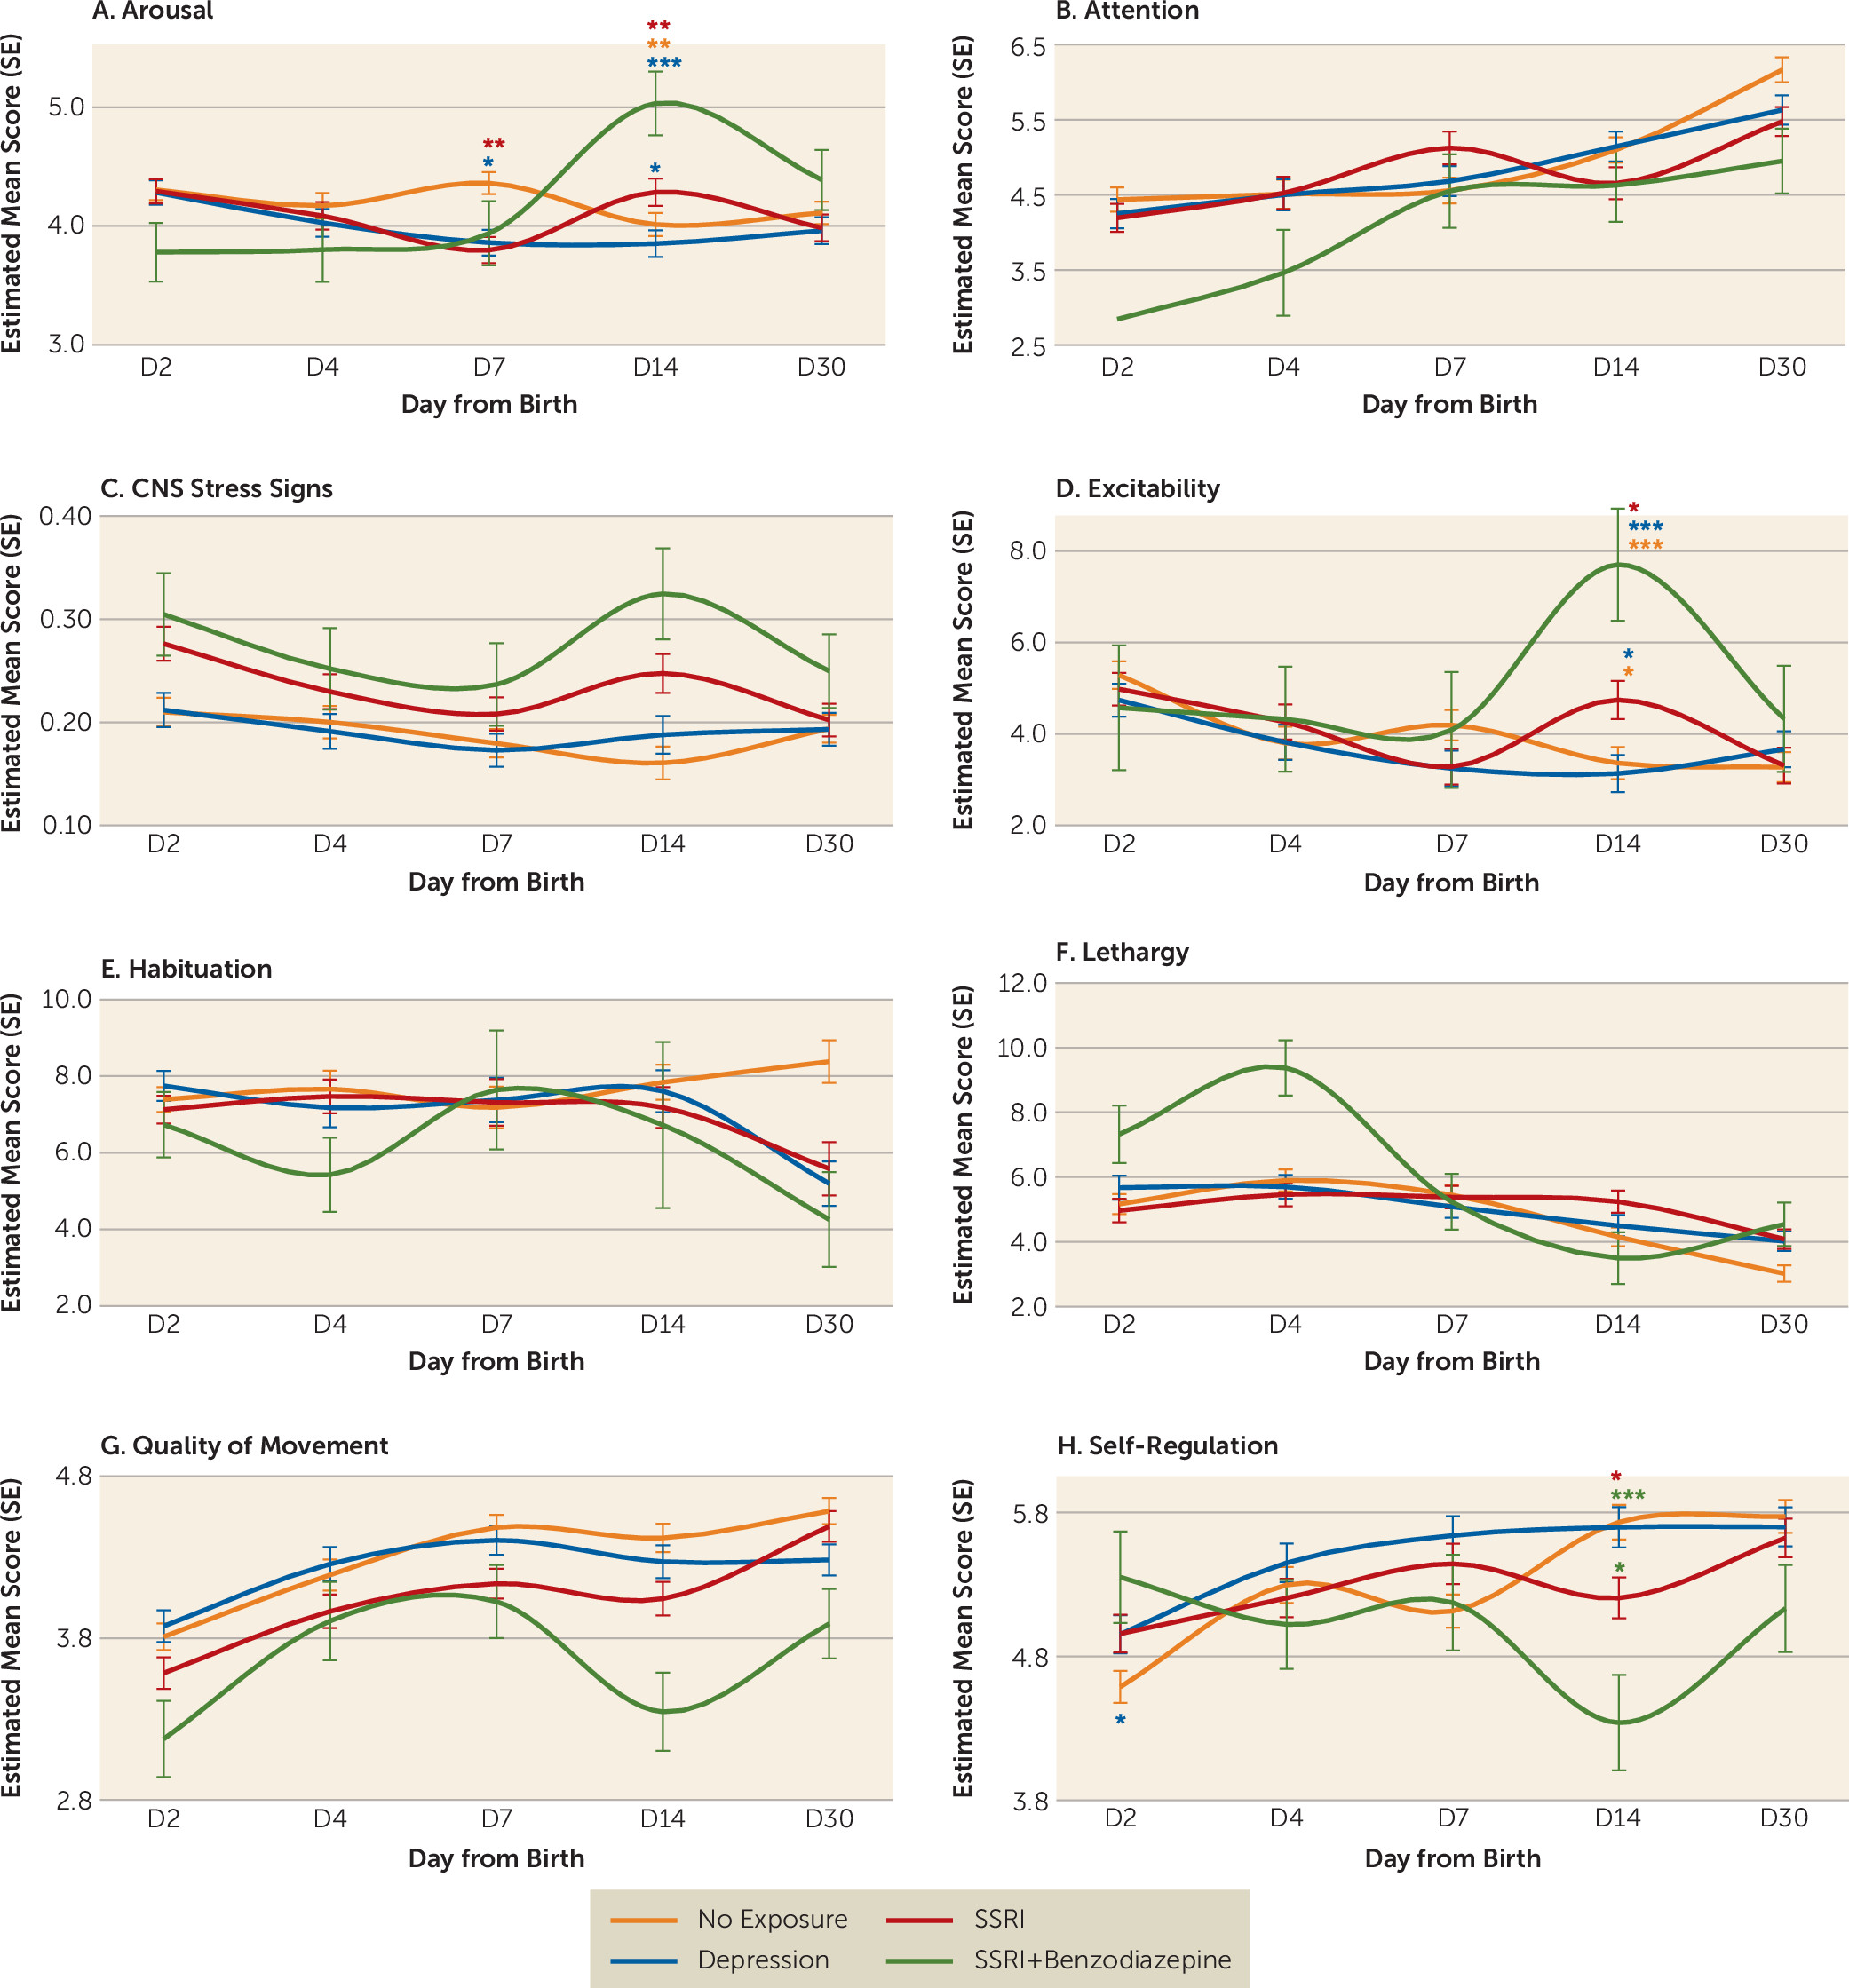
| Arousal | 1.30 | 0.729 | 0.83 | 0.841 | 11.06 | 0.011 | 4.19 | 0.10 | 4.00 | 0.07 | 4.09 | 0.07 | 4.19 | 0.20 | None |
| Excitability | 2.43 | 0.488 | 1.94 | 0.586 | 7.33 | 0.062 | 3.98 | 0.34 | 3.72 | 0.25 | 4.11 | 0.23 | 5.00 | 0.68 | |
| Handling | 1.05 | 0.790 | 0.74 | 0.865 | 0.33 | 0.954 | 0.36 | 0.04 | 0.35 | 0.03 | 0.36 | 0.03 | 0.39 | 0.08 | |
| Self-regulation | 3.00 | 0.392 | 2.72 | 0.438 | 4.55 | 0.208 | 5.30 | 0.13 | 5.49 | 0.09 | 5.29 | 0.09 | 5.00 | 0.25 | |
| Quality of movement | 26.49 | <0.0001 | 25.16 | <0.0001 | 12.41 | 0.006 | 4.30 | 0.09 | 4.22 | 0.06 | 4.04 | 0.06 | 3.67 | 0.17 | A>C* & D**; B>C* & D** |
| Stress-abstinence signs | |||||||||||||||
| CNS | 11.27 | 0.010 | 14.01 | 0.003 | 9.19 | 0.027 | 0.19 | 0.02 | 0.19 | 0.01 | 0.23 | 0.01 | 0.27 | 0.03 | A<C* & D*; B<C** & D* |
| Total | 4.79 | 0.188 | 3.86 | 0.278 | 5.92 | 0.116 | 0.16 | 0.01 | 0.15 | 0.01 | 0.17 | 0.01 | 0.16 | 0.02 | |
| Hypertonia | 2.13 | 0.545 | 3.03 | 0.388 | 2.35 | 0.503 | 0.44 | 0.11 | 0.44 | 0.08 | 0.31 | 0.08 | 0.32 | 0.23 | |
| Hypotonia | 10.52 | 0.015 | 11.59 | 0.009 | 4.94 | 0.176 | 0.27 | 0.08 | 0.31 | 0.06 | 0.51 | 0.05 | 0.46 | 0.16 | Model 2: C>A** & B* |
| Lethargy | 6.47 | 0.091 | 5.00 | 0.172 | 3.22 | 0.358 | 4.74 | 0.30 | 5.00 | 0.23 | 5.03 | 0.21 | 5.99 | 0.61 | |
| Attention | 6.44 | 0.092 | 4.63 | 0.201 | 3.59 | 0.309 | 4.95 | 0.19 | 4.84 | 0.14 | 4.79 | 0.13 | 4.09 | 0.42 | |
| Habituation | 10.63 | 0.014 | 10.22 | 0.017 | 2.22 | 0.528 | 7.69 | 0.50 | 7.02 | 0.34 | 6.94 | 0.30 | 6.85 | 0.68 | Model 2: A>B* & C** |
| Non-optimal reflexes | 5.76 | 0.124 | 5.87 | 0.118 | 1.53 | 0.675 | 4.27 | 0.26 | 4.53 | 0.20 | 4.76 | 0.18 | 4.95 | 0.54 | |
| Asymmetry | 1.70 | 0.636 | 1.87 | 0.601 | 1.73 | 0.630 | 0.92 | 0.15 | 0.95 | 0.12 | 1.17 | 0.11 | 1.16 | 0.32 | |
Main Effects of Days From Birth at Infant Neurobehavioral Assessment

Group-by-Day Interactions
Discussion
Limitations
Conclusions and Implications for Clinical Practice
Acknowledgments
Supplementary Material
- View/Download
- 356.31 KB
References
Information & Authors
Information
Published In
History
Authors
Competing Interests
Funding Information
Metrics & Citations
Metrics
Citations
Export Citations
If you have the appropriate software installed, you can download article citation data to the citation manager of your choice. Simply select your manager software from the list below and click Download.
For more information or tips please see 'Downloading to a citation manager' in the Help menu.
View Options
View options
PDF/EPUB
View PDF/EPUBLogin options
Already a subscriber? Access your subscription through your login credentials or your institution for full access to this article.
Personal login Institutional Login Open Athens loginNot a subscriber?
PsychiatryOnline subscription options offer access to the DSM-5-TR® library, books, journals, CME, and patient resources. This all-in-one virtual library provides psychiatrists and mental health professionals with key resources for diagnosis, treatment, research, and professional development.
Need more help? PsychiatryOnline Customer Service may be reached by emailing PsychiatryOnline@psych.org or by calling 800-368-5777 (in the U.S.) or 703-907-7322 (outside the U.S.).

