Alcohol is among the most commonly used intoxicating substances during adolescence, with 43% of adolescents between ages 12 and 18 reporting past-year alcohol use and 25% reporting past year drunkenness (
1). By age 18, almost a quarter of adolescents report recent heavy episodic drinking, defined as consuming five or more drinks on one occasion during the past 2 weeks (
1). These high rates of heavy alcohol use are concerning, as the adolescent brain undergoes extensive morphometric and functional maturation involving decreases in gray matter volume and increases in white matter volume (
2,
3). Cross-sectional studies have shown that cortical gray matter volume reduction begins before adolescence, during the period from ages 5 to 10 (
3,
4) and is generally considered to be related to pruning of excess neurons, changes in the extracellular matrix, and white matter encroachment (
5), beginning primarily in posterior brain regions and progressing to more anterior regions (
6), with decreases in dorsal prefrontal cortical volume continuing into early adulthood (mid-20s) (
7). In concert with cortical thinning, white matter volume increases over adolescence, partly as a result of myelination of white matter tracts and axonal extension for connectivity (
3,
8). These co-occurring neural processes are integral components of functional development, creating localized and enhanced efficient information processing required for mature complex cognitive and motor abilities (
9). Because of these extensive maturational changes, the developing adolescent brain may be especially vulnerable to the deleterious effects of exogenous agents, including alcohol (
10).
Cross-sectional studies using structural MRI have reported smaller hippocampal, prefrontal cortical, and cerebellar volumes in heavy-drinking compared with nondrinking teens (
10). Given the dynamic neural events of adolescence, controlled longitudinal study is essential for determining whether group differences can be explained by developmental change itself or is a result of interactions with other causes. Using a longitudinal design, a recent study (
11) examined adolescents before (approximately age 17) and after (approximately age 19) initiation of heavy alcohol use. Adolescents who began heavy drinking (N=30) over the follow-up period showed accelerated cortical thinning of the right middle frontal gyrus and decreased white matter volume subjacent to the precentral gyral and middle temporal gyral cortices compared with demographically matched nondrinking teens (N=25). In a similar study of adolescents followed from approximately age 15 to age 18 (
12), participants who initiated heavy drinking over the follow-up period (N=20) showed significantly greater volume reduction in the left ventral diencephalon, the left inferior and middle temporal gyrus, and the left caudate and brainstem than adolescents who remained substance-naive over the follow-up period (N=20). Yet to be addressed is whether heavy drinking during adolescence alters the trajectories of regional volume declines in cortical gray matter and growth of white matter and whether any such changes differ between the sexes.
The goal in this controlled longitudinal study was to measure within-subject changes in regional brain morphometry and to quantify cortical and white matter volume changes over longer intervals and in larger samples of adolescents than previously reported, and to compare those who remained nondrinkers with those who drank heavily during adolescence. Examination of adolescents over multiple MRI sessions (as many as six sessions) enabled modeling of normal development of cortical and white matter volumes in nondrinkers and deviations from growth trajectories in adolescents who went on to be heavy drinkers. Accordingly, we tested two hypotheses: 1) adolescents who refrained from drinking would have cortical gray matter volume decline and volume expansion of white matter brain structures; 2) adolescents who transitioned to heavy drinking would show deviations from the normal developmental volume trajectories—specifically, accelerated regional cortical volume loss and slowed white matter expansion—relative to nondrinking adolescents. Secondary analyses considered the potential compounding effect of other drug use with heavy alcohol drinking.
Method
Participants
The sample was obtained from a larger ongoing neuroimaging study of 296 adolescents examining youths at risk for substance use disorders. Participants were recruited through flyers sent to households of students attending local middle schools; the flyers listed the major eligibility criteria, financial compensation, and contact information. Informed consent and assent were obtained and included approval for adolescents and parents to be contacted for follow-up interviews and scans. Eligibility criteria information, substance use history, family history of substance use, developmental data, and mental health functioning data were obtained from the adolescent, a biological parent, and one other parent or close relative. The study protocol was executed in accordance with the standards approved by the University of California, San Diego, Human Research Protections Program.
Exclusionary criteria included any neurological or DSM-IV axis I disorder, determined by the NIMH Diagnostic Interview Schedule for Children, version 4.0 (
13); a history of head trauma or loss of consciousness >2 minutes; a history of chronic medical illness; a learning disability or mental retardation; use of medications that potentially affect the brain; premature birth (before the 35th gestational week); any suggestion of prenatal alcohol (>2 drinks within a week) or illicit drug exposure; contraindication to MRI (e.g., braces); inadequate comprehension of English; noncorrectable sensory problems; and clinically abnormal brain anatomy as determined by neuroradiologist review. Of 1,987 adolescents screened, approximately 15% remained eligible (
Table 1).
This longitudinal study was begun in July 2002 with imaging conducted on a 1.5-T scanner that was replaced with a 3-T system in June 2005. Attempts to merge data across 1.5-T and 3-T field strengths were unsatisfactory, so only participants who had multiple valid 3-T scans that could be quantified with a longitudinal atlas-based parcellation method (
14,
15) were included in this study. Participants for this study (N=134) all had at least two 3-T brain scans over the course of the study, for a total of 390 scans. Participants completed substance use interviews every 3 months, and at each annual time point were defined as heavy drinkers or nondrinking control participants, based on previously reported classification schemes (
16,
17) (
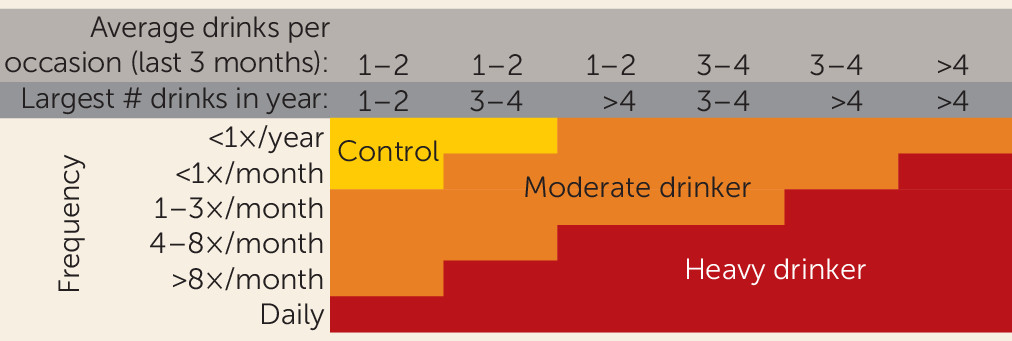
Figure 1). The final sample for this analysis consisted of 59 continuous nondrinkers—adolescents who had no lifetime drinking, or minimal drinking, throughout all follow-ups—and 75 heavy drinkers—adolescents who initiated heavy drinking during the follow-up period. Moderate drinkers were not included in the primary analyses. See
Figure 1 and
Table 2 for substance use information.
Measures
Substance use measures.
The Customary Drinking and Drug Use Record (
18) was used to obtain self-reported quantity and frequency of lifetime and past-3-month alcohol, tobacco, and other drug use (amphetamines, barbiturates, hallucinogens, cocaine, inhalants, opiates, Spice, benzodiazepines, Ecstasy, ketamine, gamma hydroxybutyrate, and other misused prescription medications), withdrawal/hangover symptoms, and endorsement of substance use disorder criteria. The Timeline Followback method was used to assess substance use for the 30 days prior to the scan, and reports from a parent or other informant (e.g., roommate, sibling, friend) on the adolescent’s substance use were collected as collateral evidence. Each participant was categorized as a control or a heavy drinker at each time point (
16,
17) (see
Figure 1). (As noted, moderate drinkers were not included in these analyses.) Breath analysis and urine toxicology screens confirmed self-report data.
Family background.
The Family History Assessment Module (
19) was used to ascertain familial density of alcohol and other drug use disorders by adding 0.5 for each biological parent and 0.25 per biological grandparent endorsed by either adolescent or parent report as meeting criteria. Family history data were collected from one parent plus the other parent or a close relative. Information on socioeconomic background (i.e., educational attainment, occupation, and salary of each parent) was obtained from parents.
Development.
The Pubertal Development Scale (
20) provided a reliable and valid 5-item self-report measure of pubertal maturation that correlates well with physician ratings and Tanner Sexual Maturation Scale self-ratings (
21). Scores ranged from 1 (prepubertal) to 5 (postpubertal).
Psychopathology and mood.
To obtain levels of adolescent psychopathological syndromes (e.g., internalizing and externalizing behaviors), the Child Behavior Checklist (
22) was completed by parents for participants under age 18 and the Adult Self Report (
22) was completed by participants over age 18. The Beck Depression Inventory–II was used to assess depressive symptoms (
23).
Image Acquisition
All imaging data included in the longitudinal statistical analysis of group differences reported here were collected with the same 3-T CXK4 short-bore Excite-2 scanner (General Electric, Milwaukee, Wisc.) with an 8-channel phase-array head coil, at the University of California, San Diego, Keck Center for Functional MRI. Eight high-bandwidth receivers for ultrashort repetition times reduced signal distortion and signal dropout. Sessions involved a scout scan for head placement and slice selection, followed by a sagittal high-resolution three-dimensional T1-weighted anatomical MRI (FOV=24 cm, 256×256×192 matrix, 0.94×0.94×1 mm voxels, 176 slices, TR=20 ms, TE=4.8 ms; flip angle=12°; scan time=9 minutes).
Image Processing
All images were first corrected for intensity bias using a second-order polynomial correction function computed by minimization of image entropy (
24). Each bias-corrected image was then skull stripped using ROBEX (
http://www.nitrc.org/projects/robex) (
25). A brain mask was constructed from images acquired at the first MRI session. Each baseline brain mask was visually inspected and, when necessary, manually corrected.
Next, each follow-up image was aligned with the first image from the same subject in a two-step procedure: first, the skull-stripped follow-up image was linearly aligned with the skull-stripped initial image; second, the bias-corrected whole-head follow-up image was nonrigidly aligned with the bias-corrected whole-head initial image via nonrigid registration (
26). By using skull-stripped images for initial linear alignment, we ensured robust registration regardless of pose and shape changes in nonbrain soft tissue. By using the whole-brain images for nonrigid registration, we ensured consistently good alignment quality throughout the brain, up to its surface, regardless of inconsistencies in the independently computed brain masks.
After alignment across time, the brain mask from each baseline image was resliced to each of the follow-up images from the same subject. This ensured temporally consistent brain masks for all time points for the subsequent processing steps.
Skull-stripped images acquired at 1.5-T were intensity normalized by histogram matching with respect to the first-acquired 3-T image of the same subject. The 3-T baseline or 1.5-T image-intensity normalized baseline image was then aligned (first linearly, then nonlinearly) with the T
1-weighted (spoiled gradient-recall acquisition) channel of the SRI24 atlas (
27). Using these alignment transformations, the tissue probability maps of the SRI24 atlas were then resliced into the baseline image space of each subject. The probability maps were furthermore resliced into the space of each follow-up image for each subject via a concatenation of the atlas-to-baseline and the baseline-to-follow-up transformation for that subject and follow-up. Likewise, cortical and subcortical parcellation maps of the SRI24 atlas were resliced into the space of each baseline and follow-up image.
Using the resliced tissue probability maps as both initializers and priors during segmentation, tissue classification maps were then computed for each image using FSL’s FAST tool (
28). Finally, the FAST tissue map for each image was combined with the SRI24 parcellation maps to obtain regional tissue volumes for all regions of interest in the parcellation maps.
Fitting of age trajectories after segmentation and parcellation resulted in discrete discontinuities across scanner strength within a subject. Therefore, subsequent data analyses used only 3-T data from subjects who had multiple 3-T scans. Those whose initial scan was at 1.5 T were included in the analysis only if they had two or more subsequent scans at 3 T, and their first 3-T scan was used as the baseline for trajectory analysis.
Regions of Interest
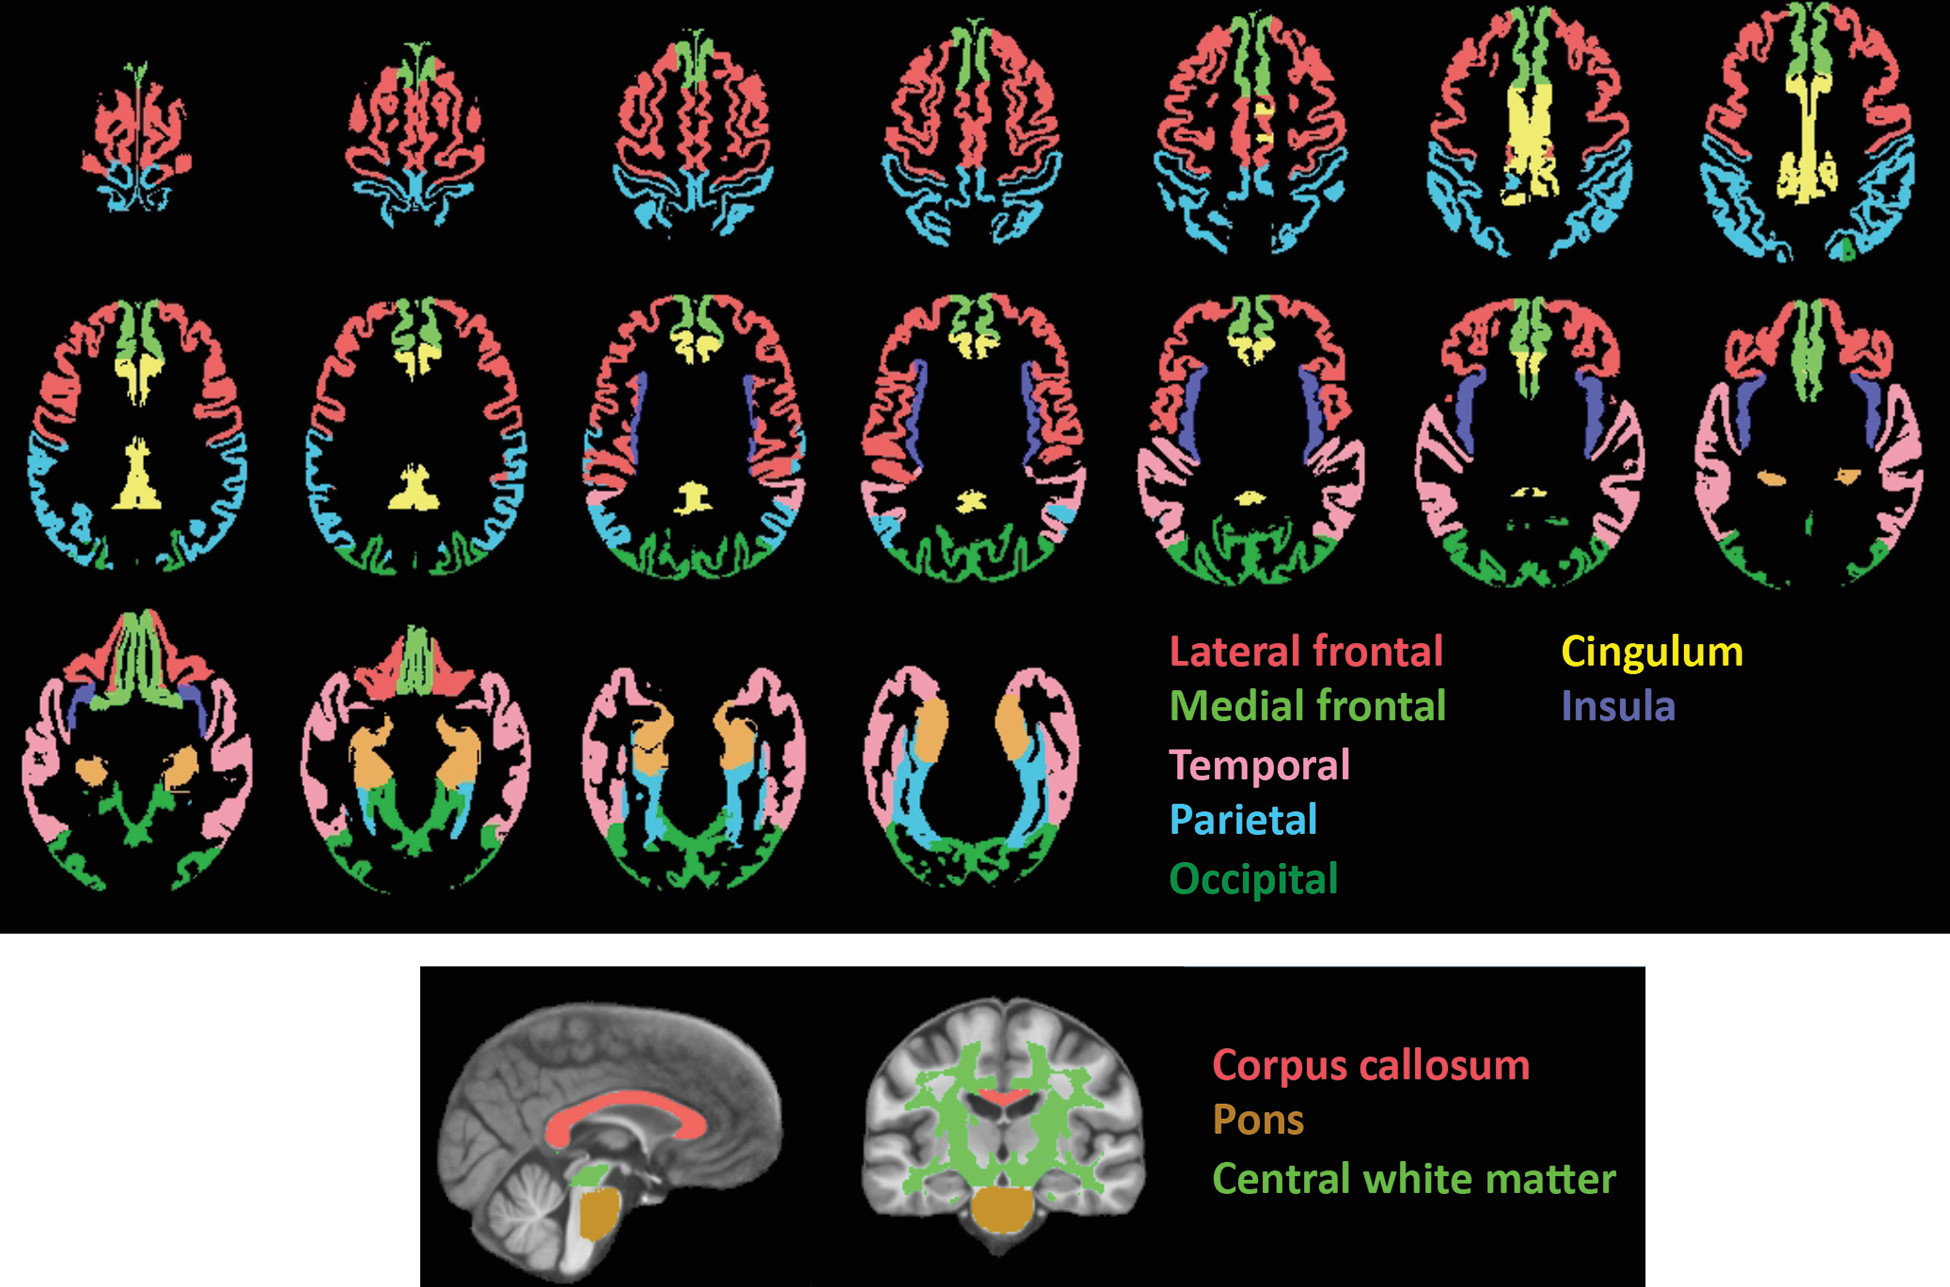
All regions of interest (
Figure 2) were identified with the SRI24 atlas with tissue segmented into gray matter and white matter (
15). Gray matter regions of interest included the total neocortex and lobar regions (the frontal [including the lateral and medial frontal], temporal, parietal, and occipital cortices) and allocortex (the cingulum and insula). The white matter regions of interest were the pons, the corpus callosum, and the central white matter, which was a large volume of subcortical white matter including much of the centrum semiovale and excluding white matter subjacent to neocortex. Subcortical structural measurement presented a particular challenge in these data and will be pursued in the future.
Statistical Analysis
The volumes of each brain region were first transformed into standardized Z-scores, which adjusted regional volumes for differences in supratentorial volume modeled from all subjects at all times, thereby adjusting for sex-related volume differences (
3,
29,
30). As described previously (
15), change trajectories of individual participants were calculated using the lmer function for linear mixed-effects modeling in the lme4 R statistical package (
http://www.r-project.org/). The lmer function also allowed for testing of nested random effects; in the present study, the effects of age and drinking status were tested first to identify group differences in slopes of regional brain volumes adjusted for supratentorial volume. To examine longitudinal trajectories of volume change independent of age at data acquisition, we computed the trajectory slopes of each participant for each brain region by first removing the subject’s average age across the acquisitions to create a “centered-age” variable (i.e., the slope across the years of observation regardless of chronological age). We also entered the participant’s mean age across acquisitions (“mean-age”) into the model and sought group (“alcohol_use”)-by-centered-age interactions (that is, did the slope of volume change differ between alcohol users and nonusers?):
Results
The primary analysis model calculated trajectories of change over age, indicative of development, with the overarching hypothesis that heavy alcohol use during adolescence would affect the normal developmental trajectories of gray matter and white matter volume changes with aging. Outputs of interest were group differences in 1) the mean slope of each volume over time, indicative of normal development in nondrinkers, and 2) alcohol use-by-centered-age trajectory (i.e., slope) interactions, indicative of deviation from normal development.
Trajectories of Neocortical Volumes
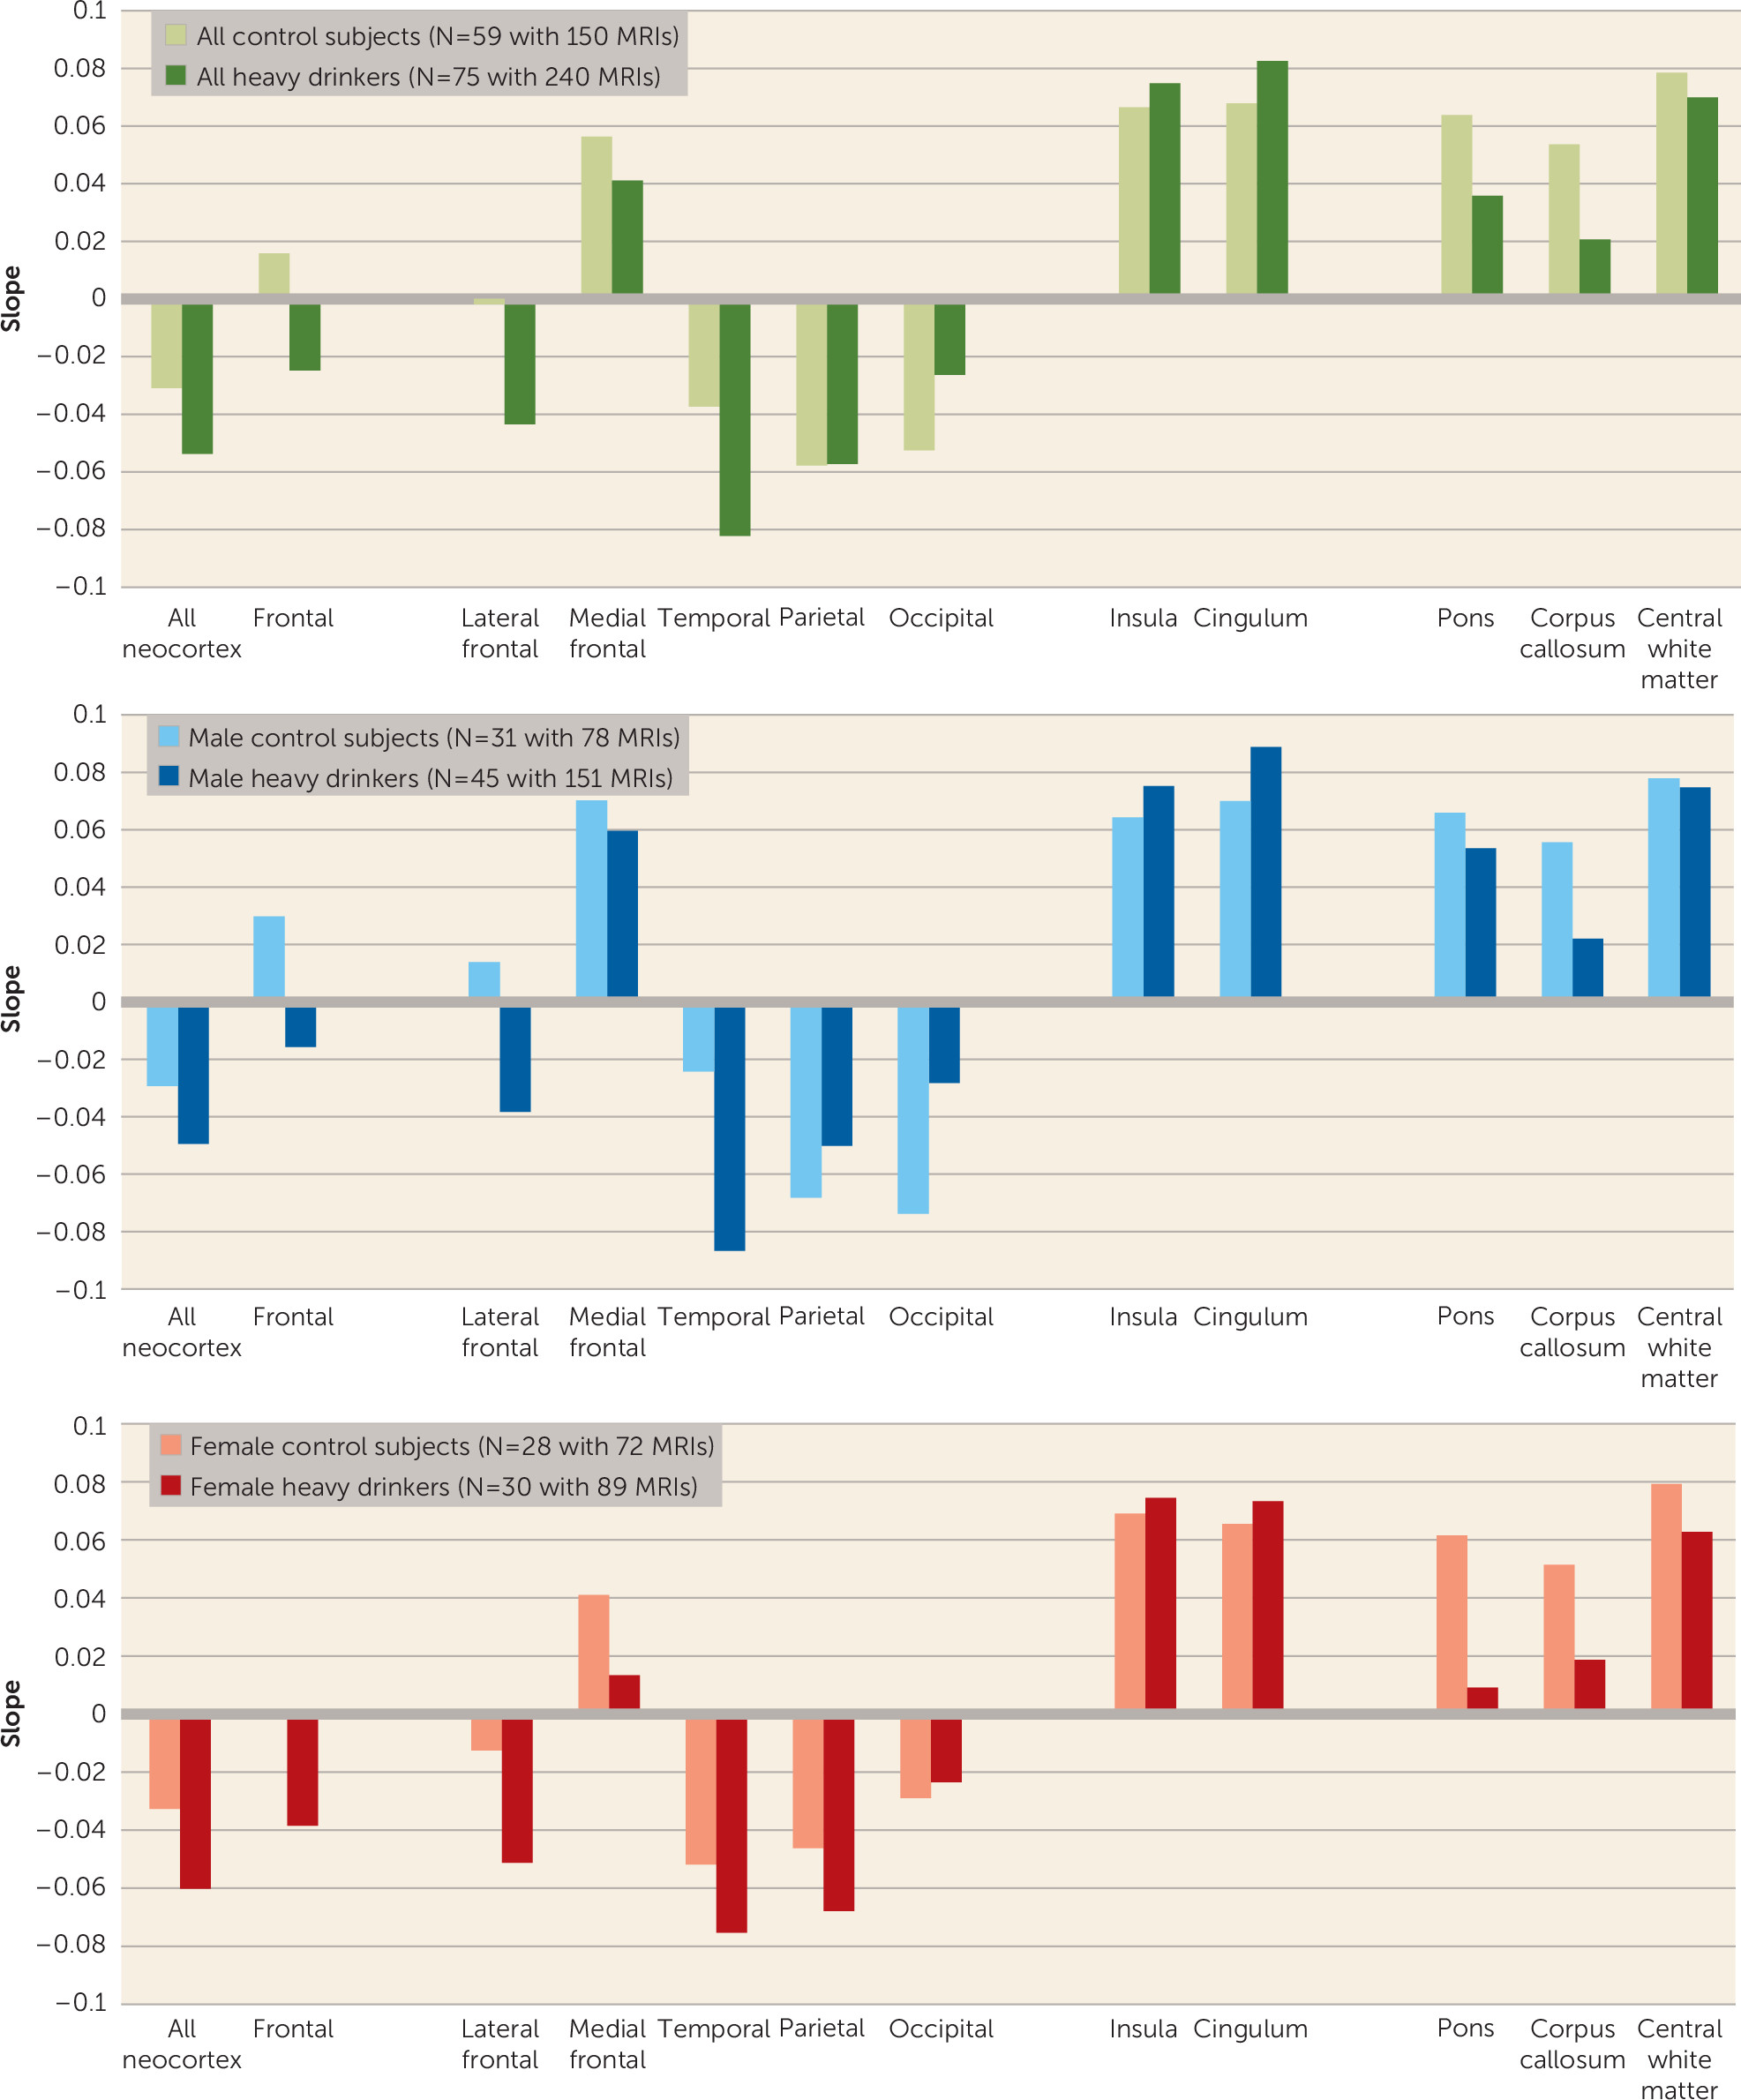
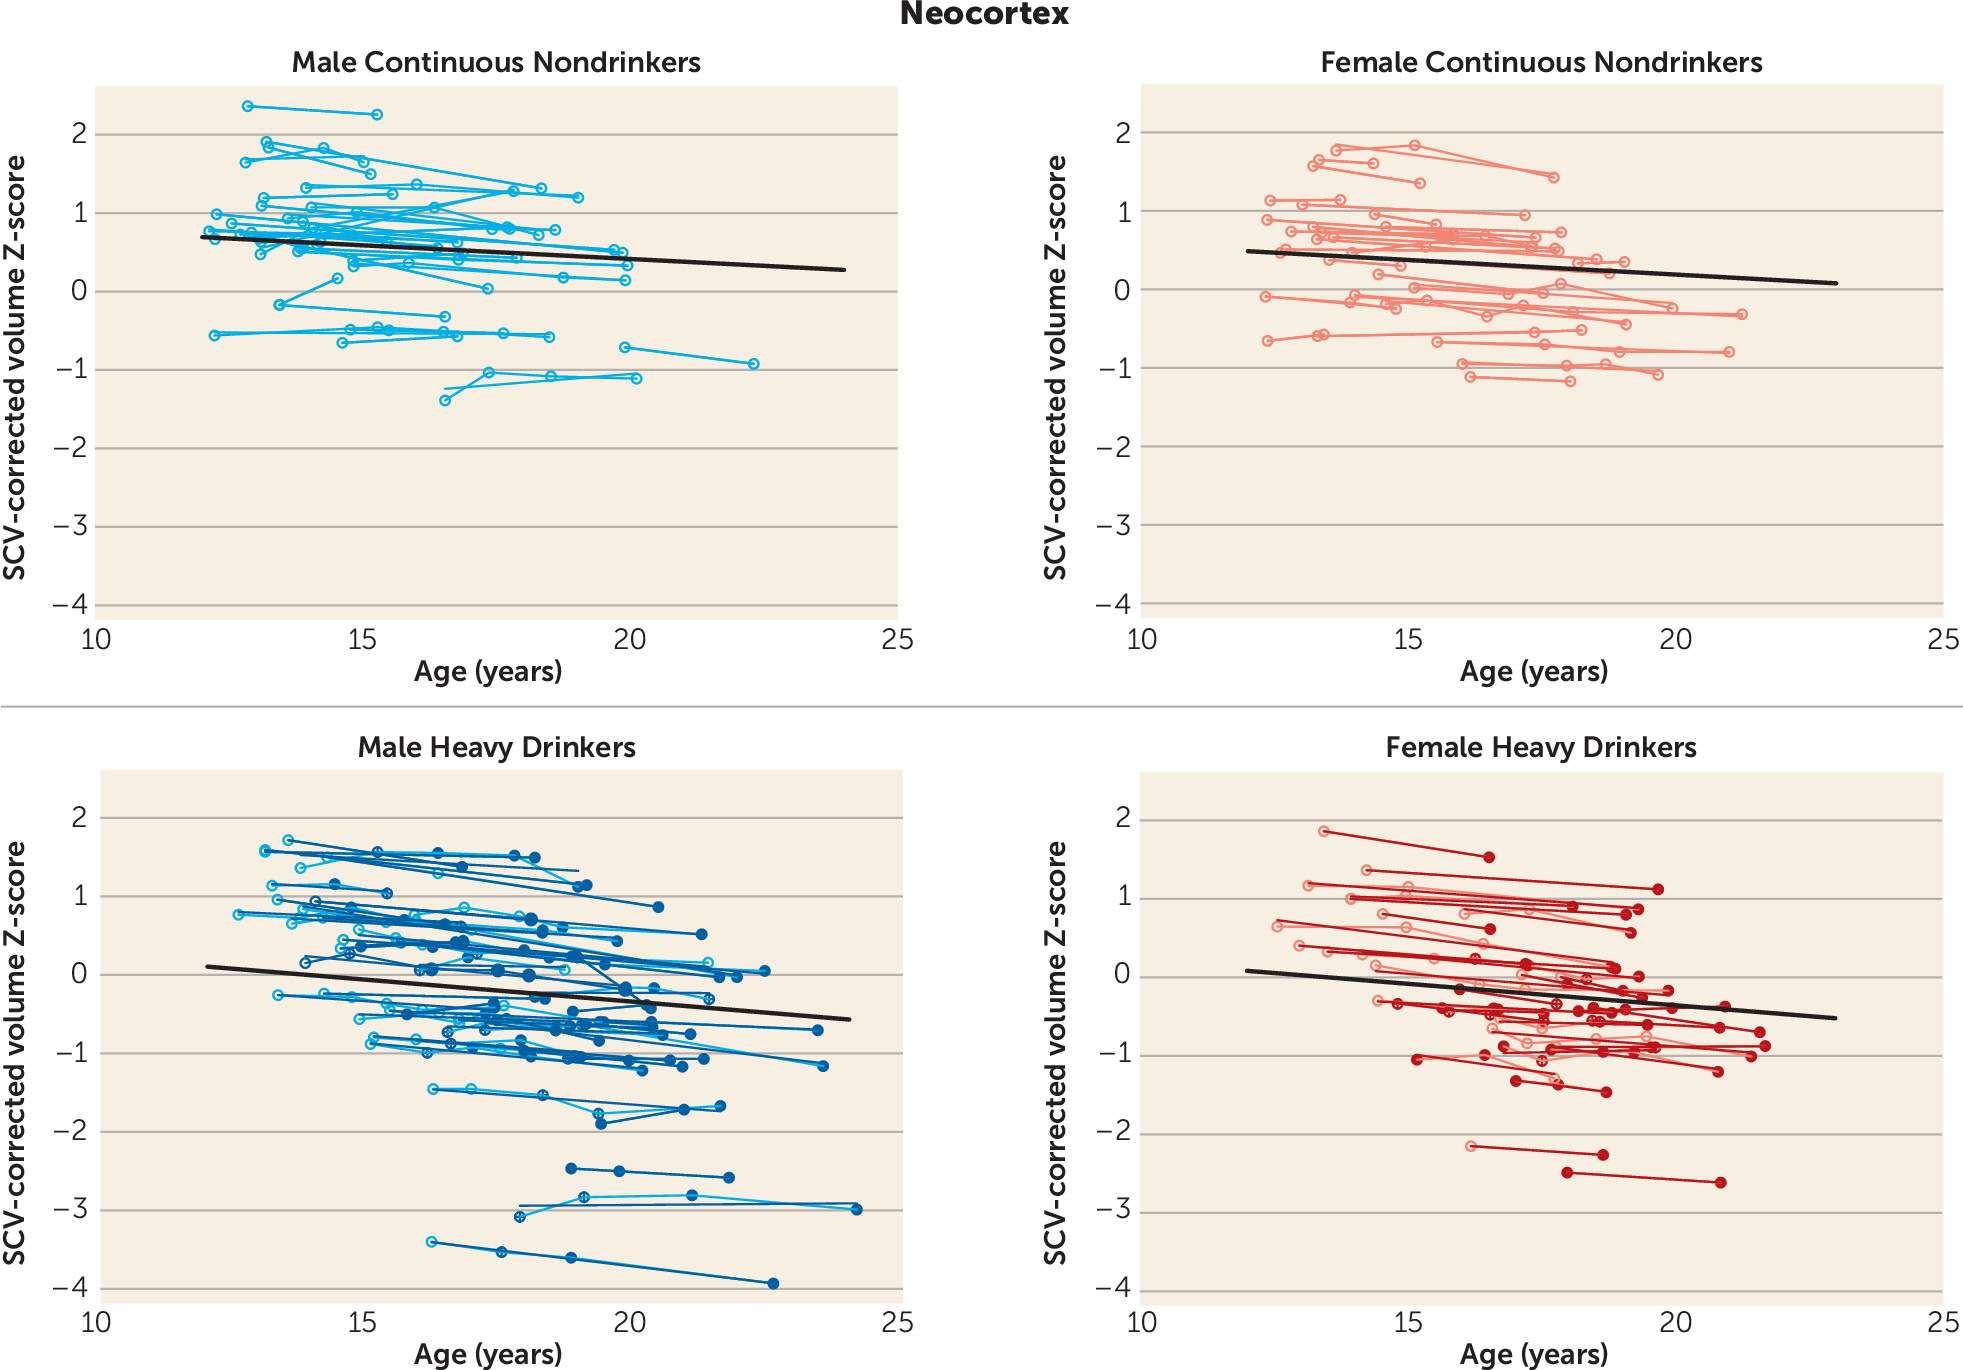
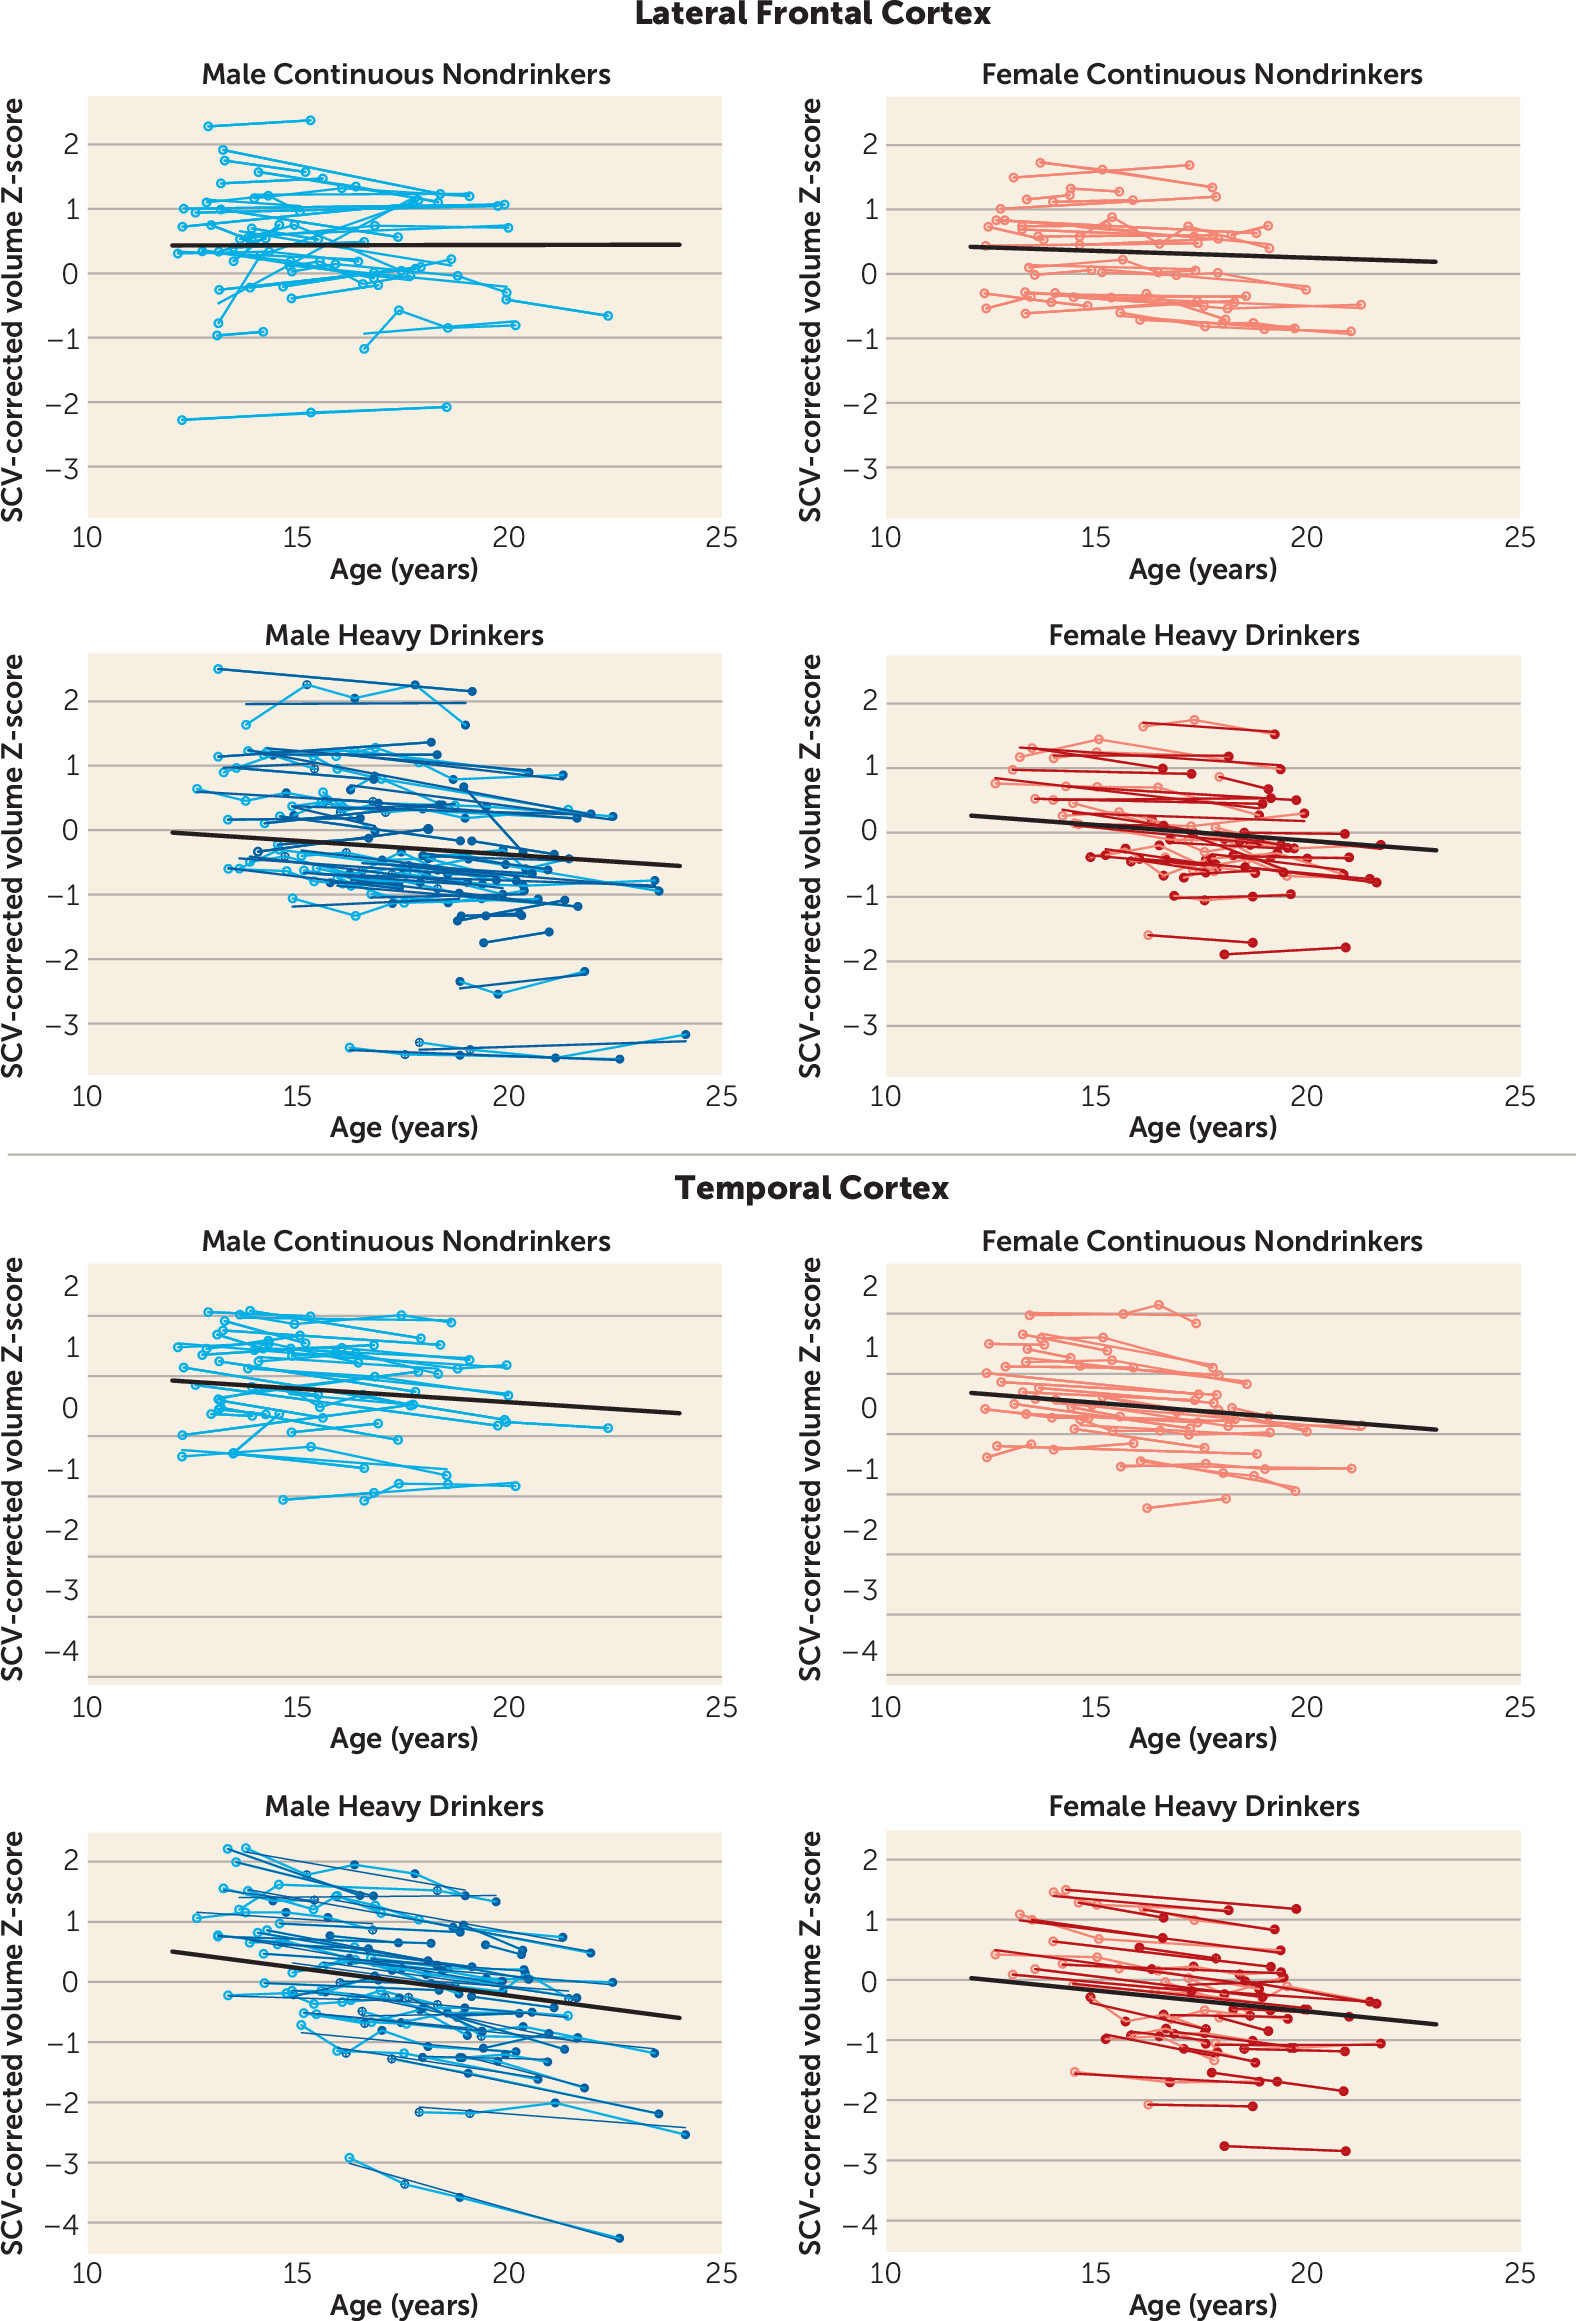
During the adolescent and young-adult years examined (mean ages 12.13 years to 24.14 years, with follow-up intervals of 0.85–8.40 years), neocortical volumes in most regions measured decreased over time in both nondrinking and heavy-drinking adolescents (negative mean slopes in
Figures 3–
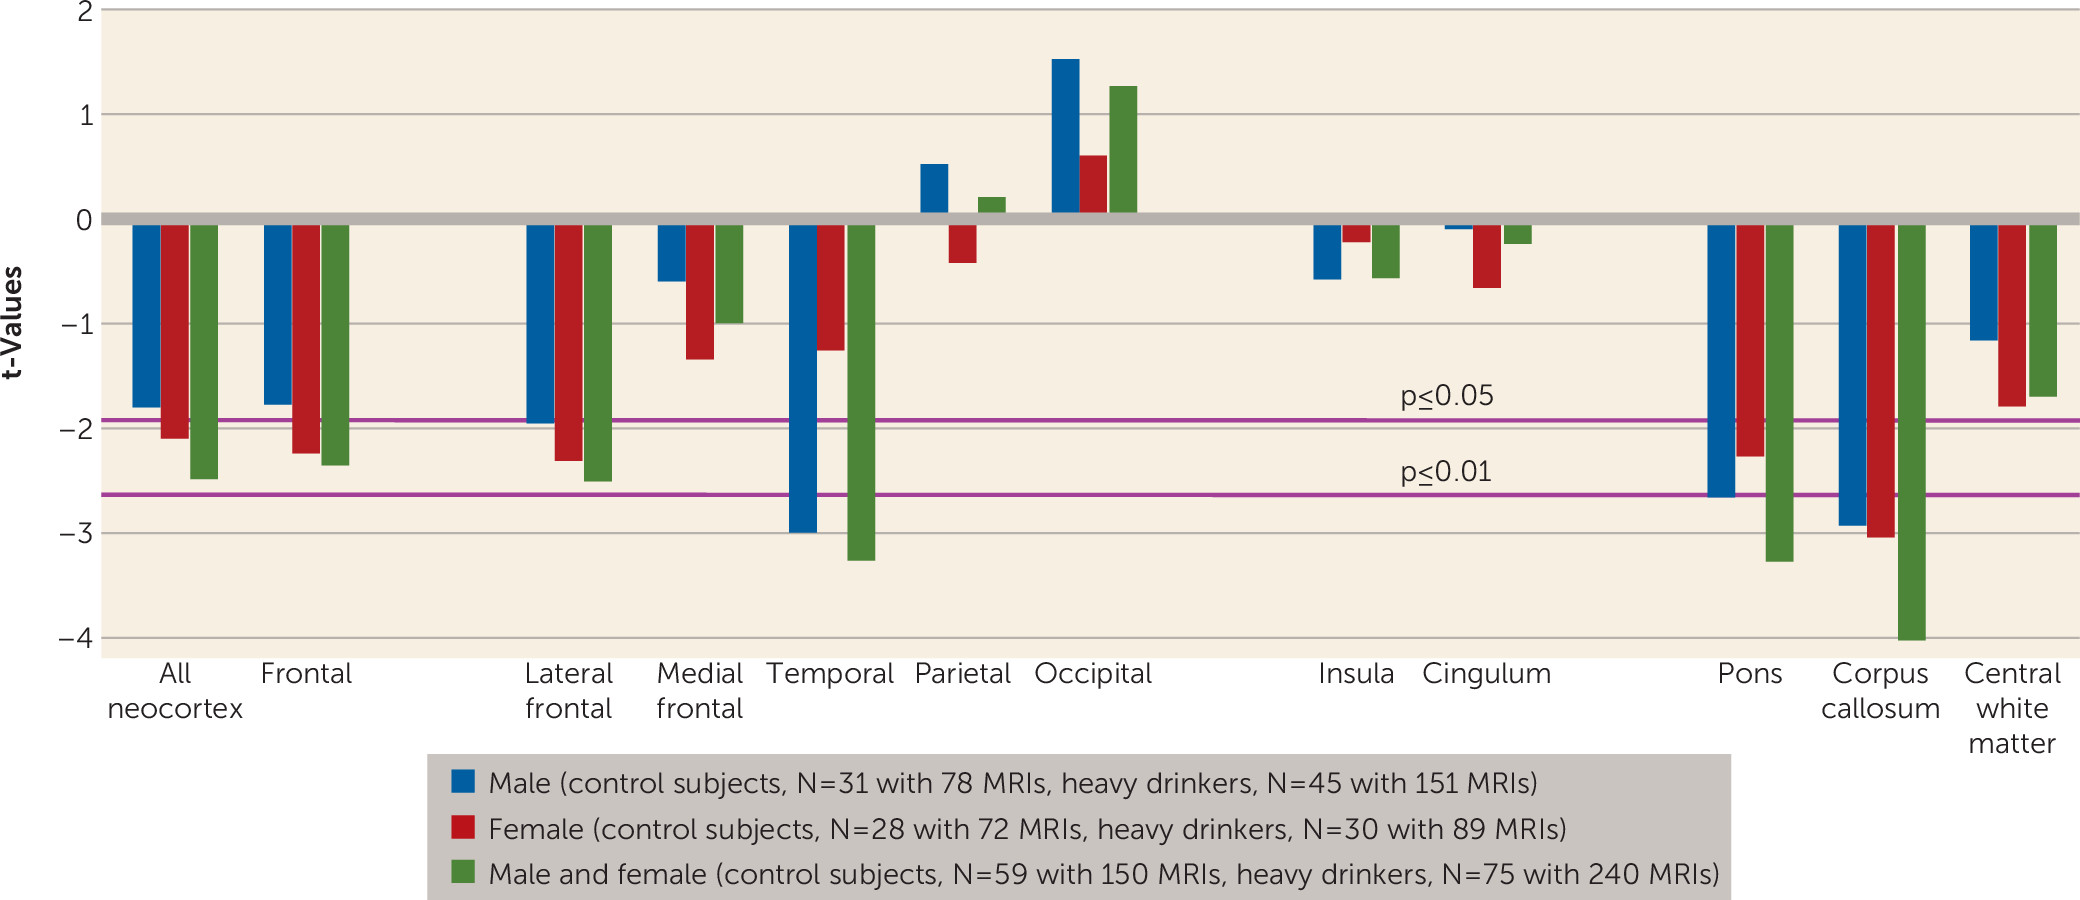
4). Relative to nondrinking adolescents, heavy drinkers exhibited greater volume reduction in the total neocortex (p=0.013) (
Figure 5) and specifically in the frontal (p=0.019), lateral frontal (p=0.013), and temporal cortices (p=0.001) (
Figure 6). Dividing the groups by sex yielded a similar pattern of results in the same regions observed in the total group, although differences fell short of statistical significance between male nondrinkers and heavy drinkers for the total neocortical (male, p=0.073; female, p=0.041) and lateral frontal (male, p=0.052; female, p=0.026) slopes (
Figures 3–
6). Sex differences were greater in the temporal lobe, which showed significantly decreasing volume in the male (p=0.003) but not the female (p=0.211) heavy drinkers (
Figure 6). The medial prefrontal cortex was the single exception to neocortical gray matter volume shrinkage in these adolescents: although both heavy drinkers and nondrinkers, whether male or female, showed volume expansion, the group-by-centered-age interactions were not significant (
Figures 3–
4).
Trajectories of Allocortical Volumes
Both nondrinking and heavy-drinking male and female participants exhibited significant volume enlargement of the insula and cingulum over the course of the study (
Figure 3). Neither structure, however, showed growth attenuation in the heavy drinkers relative to the nondrinkers, indicated by the absence of group-by-centered-age interactions (
Figure 4).
Trajectories of Regional White Matter Volume
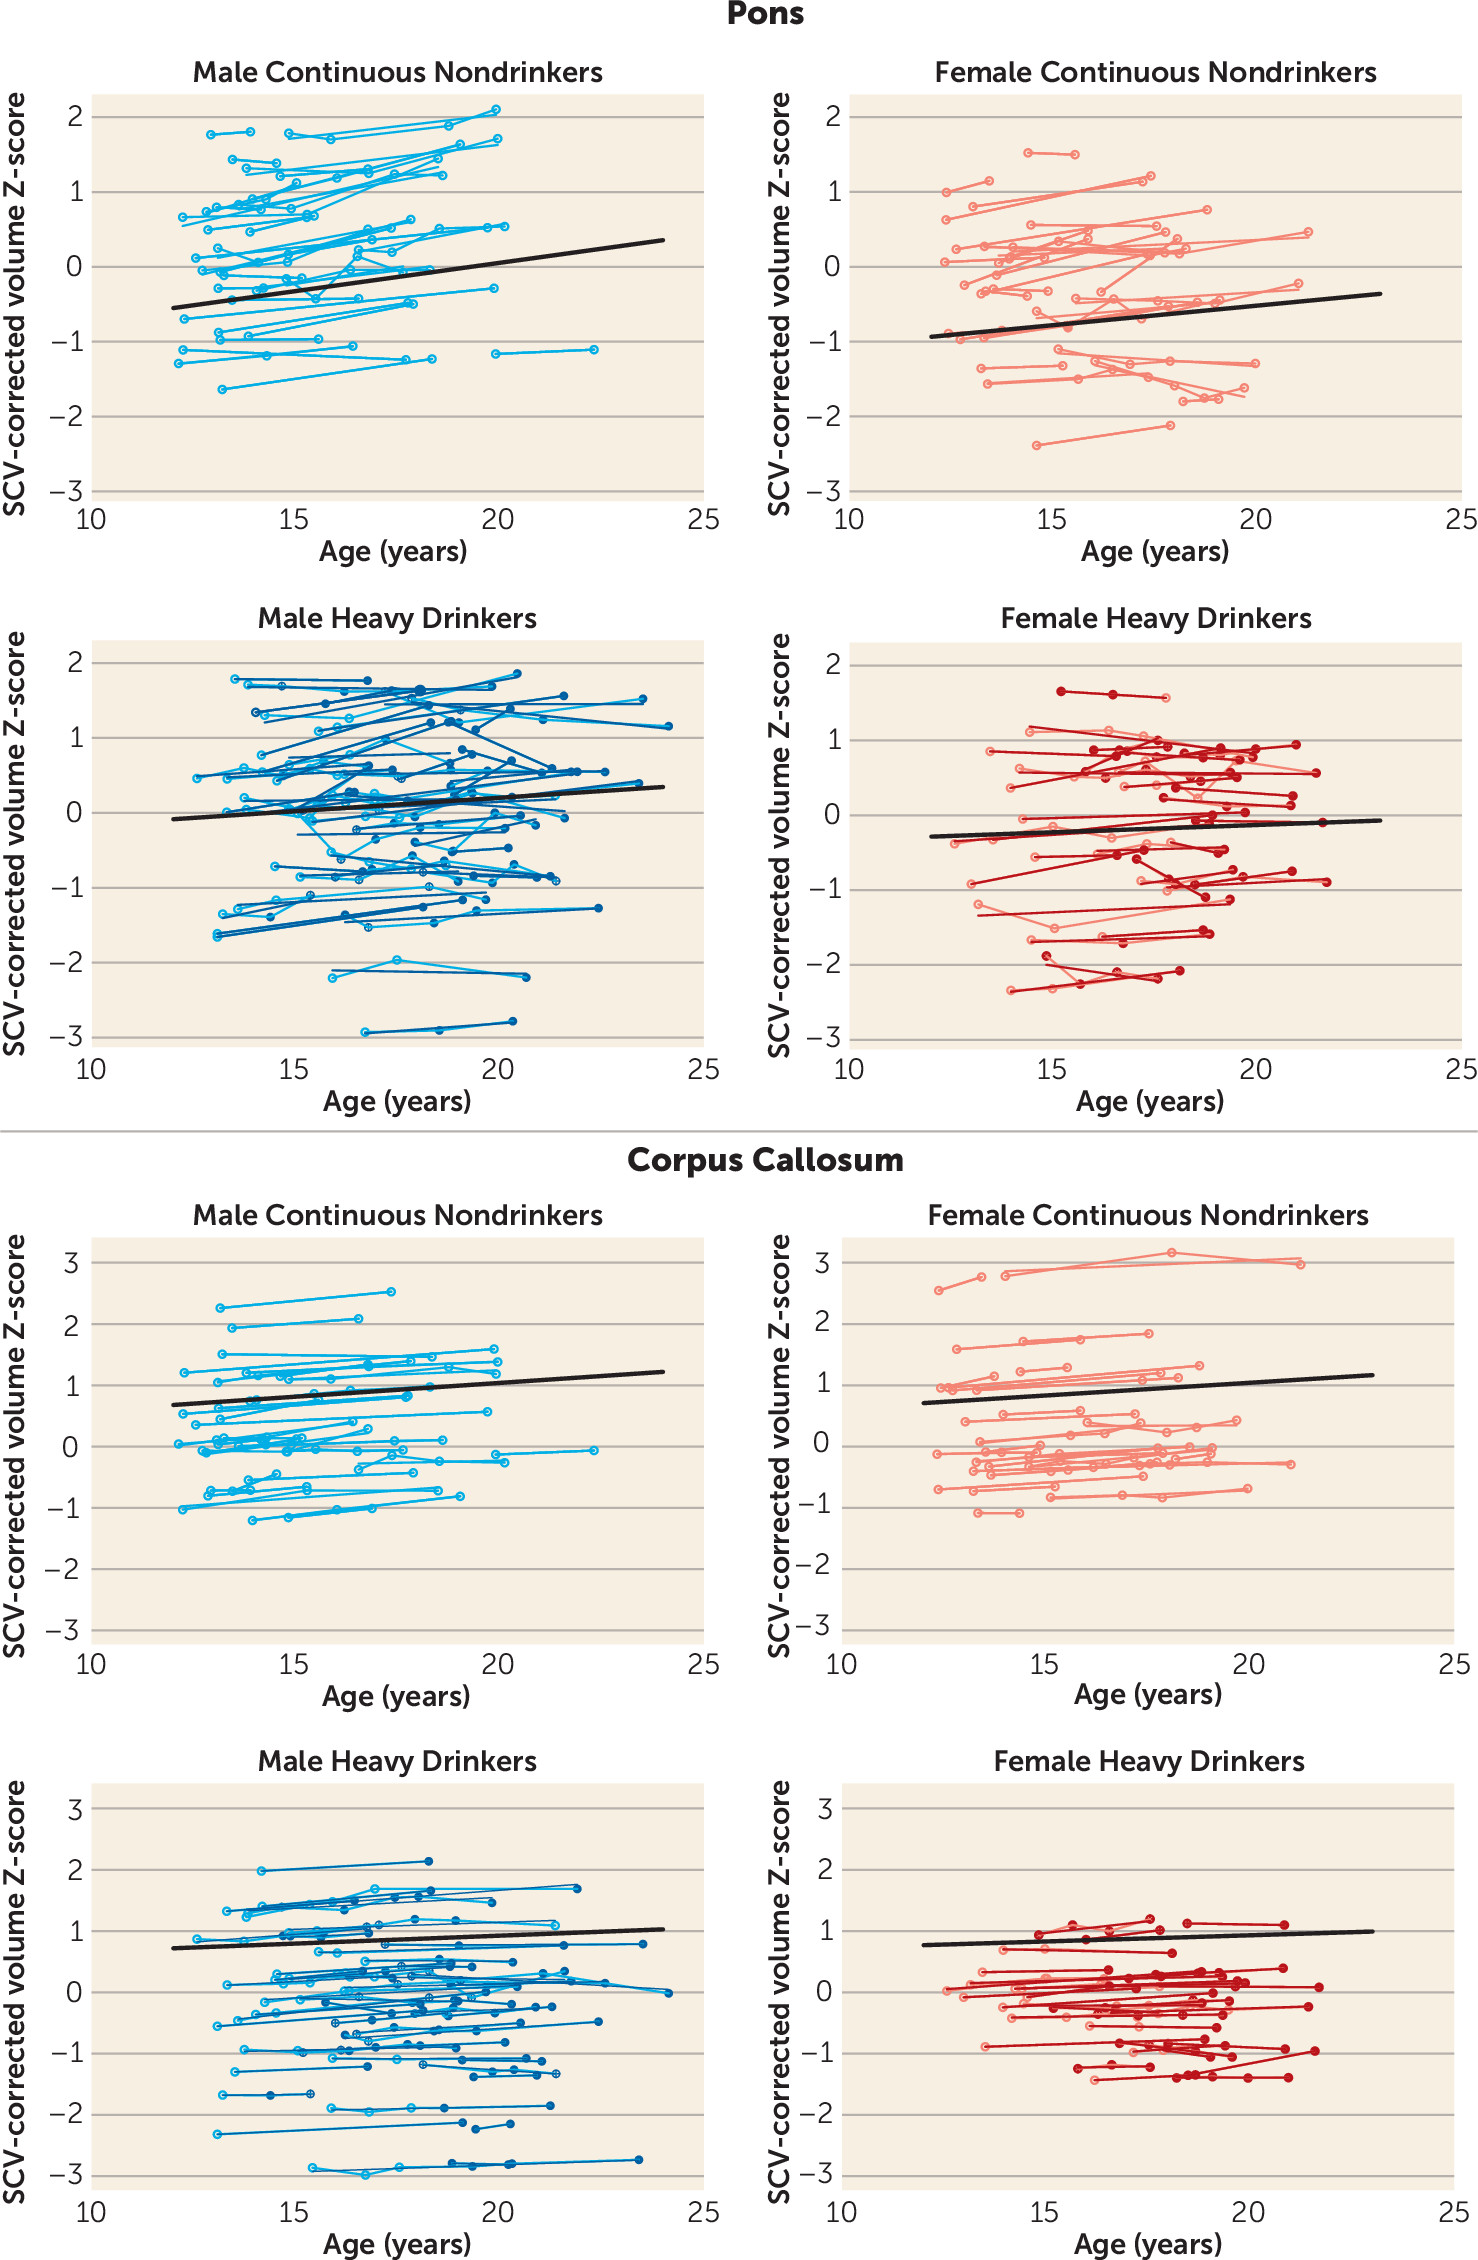
All three white matter regions showed volume growth in both heavy-drinking and nondrinking male and female participants, with the enlargement significant for the pons and the corpus callosum (
Figures 3–
4). Growth trajectories were attenuated, however, in the heavy drinkers relative to the nondrinkers in the pons (male, p=0.009; female, p=0.025; male and female, p=0.001) and the corpus callosum (male, p=0.004; female, p=0.003; male and female, p<0.001) (
Figures 4 and
7). The group trajectory differences in the central white matter volume of heavy drinkers did not reach statistical significance (
Figure 4).
Contribution of Other Substance Use to Developmental Trajectories
Illicit drug use was limited primarily to marijuana, with the exception of two heavy-drinking marijuana users, one of whom also used amphetamines and the other, cocaine and opiates. Drug use was non-normally distributed, thereby precluding it as a continuous variable. Instead, we employed three different criteria (based on drug use cut-points) in secondary analyses to examine the role of drugs other than alcohol in modifying the results: 1) The number of days of marijuana use per year of observation interval (first to last scan used in the analyses) was discontinuous, at ≥100 in 11 male and six female heavy drinkers. 2) A liberal criterion of 20 drug use days per year captured 15 male and seven female heavy drinkers. 3) A stricter criterion of 100 drug use days per year captured eight male and four female heavy drinkers. The mixed effects model 1 was extended to model 2 to include the interaction of centered-age and non-alcohol drug use (drug_use) as a dichotomous variable and tested with the three criteria:
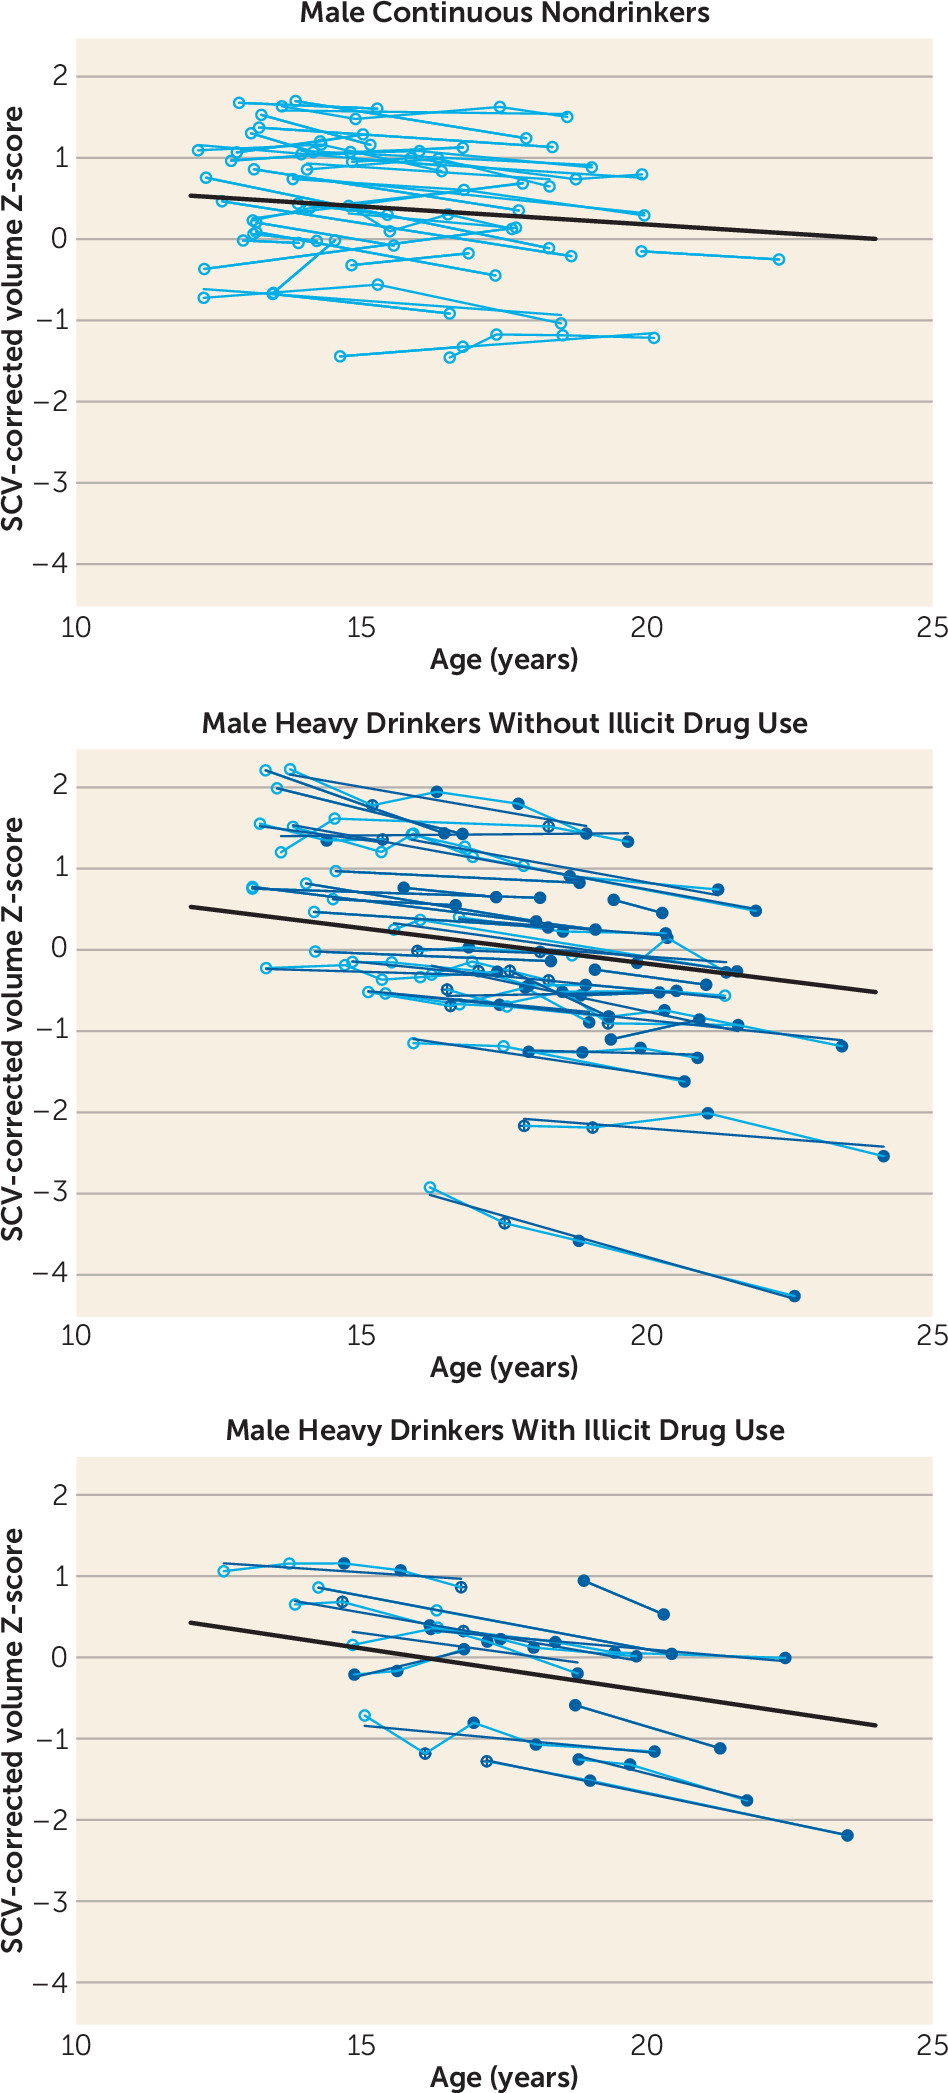
Adding “drug_use × centered-age” to the model confirmed the original regional alcohol use effects, with insubstantial changes in significance values (e.g.,
Figure 8). Only in the corpus callosum, using the criterion of 100 drug use days per year, was there a significant “centered-age × alcohol_use” and a significant “centered-age × drug_use” interaction (male and female, t=−4.514, p<0.001 for alcohol; t=2.142, p=0.033 for drugs and alcohol). Here, the alcohol users exhibited retarded corpus callosum growth, whereas the alcohol-plus-drug-use group had accelerated corpus callosum growth. This unpredicted result did not reach statistical significance with the other two drug use criteria.
In two regions where the alcohol_use × centered-age effect was not significant, the drug_use × centered-age effect was, suggesting attenuation of the normal trajectory. Using the criterion of 100 drug days per year and the combined group of both sexes, the alcohol-plus-drug-use group was significantly different from the nondrinking control group (medial frontal cortex: t=−2.03, p=0.043; insula: t=−2.12, p=0.035) but the alcohol-only group was not.
Discussion
Adolescents who had experienced episodes of heavy drinking had faster declining volumes in selective neocortical gray matter regions and smaller increases in regional white matter volumes relative to continuously nondrinking adolescents. This study is novel with respect to the number of assessments participants completed (two to six scans), the length of the study (multiple observations between ages 12 and 24), and the large sample size, allowing for comparison of sex-linked differences. The nondrinking adolescents studied over the same period served as a control group for estimating typical developmental trajectories over the same early- to late-adolescence age range as the heavy drinkers.
Dynamic brain growth and differential trajectories of gray and white matter volumes (
3,
8) were notable in both the heavy-drinking and nondrinking adolescents. To the extent that the cortical volume reduction reflects normal, beneficial processes of neuronal pruning (
3,
5,
8) and cortical restructuring, one might have expected a lesser change with age in the heavy drinkers; however, this was not the case, as they exhibited accelerated declining volume trajectories. Possible interpretations of this pattern include accelerated but nonbeneficial pruning or, alternatively, premature cortical gray matter decline similar to senescent volume declines seen in adult alcoholics (
29) or even “normal” aging (
3,
15). Over this same period, white matter volume increased in the corpus callosum and the pons, with a trend toward increases in a large sample of white matter of the centrum semiovale. The attenuated volume growth among heavy drinkers’ callosal and pontine white matter suggests a widespread effect, which has also been observed in adults with chronic alcoholism (
31). Longitudinal studies of adults with chronic alcohol dependence who sustained sobriety report normalization of white matter volumes (
32) and microstructural integrity of selective fiber systems (
33). To the extent that excessive alcohol consumption contributed to attenuated white matter volume growth in our heavy-drinking adolescents, and given white matter fibers’ capacity for repair (
20), one might speculate that constituent white matter processes could resume a normal growth trajectory and regain volume with abstinence from drinking.
This is the first study with a large sample size to measure macrostructural brain development over extended periods using an atlas-based parcellation and segmentation approach for longitudinal registration and quantification of major neocortical and allocortical regions and white matter structures in heavy-drinking and nondrinking adolescents. The accelerated cortical volume regression together with slowed white matter volume growth in heavy-drinking adolescents is largely consistent with previous findings in heavy-drinking adolescents that reported focal gray matter thinning in right middle frontal and left inferior and middle temporal cortical and other subcortical regions, as well as slower expansion of white matter in the right hemisphere in the precentral gyrus, lingual gyrus, middle temporal gyrus, and anterior cingulate, relative to alcohol-naive adolescents (
11,
12). Differences in specific loci showing significant growth deviations between groups might be attributable to differences related to measurement, sex, or subject sampling or to population differences with respect to behavioral attributes distinguishing drinkers from nondrinkers. Whether exposure to high doses of alcohol during critical periods of brain development in adolescence puts young people at risk for developing alcohol use disorders, or for exacerbated brain structural or functional abnormalities if they progress to alcohol dependence, remains to be determined. Animal models of youthful drinking could help address this void. One series of studies in adolescent rodents exposed to high intermittent doses of alcohol exhibited increased neuroimmune expression of the receptor for advanced glycation end products (RAGE) in prefrontal cortex only after extended periods without alcohol (
34). This delayed response suggests that the effect of binge-like bouts of alcohol, even if not initially detectable, might reflect a form of neuroadaptation that has potential for later expression.
Previous cross-sectional findings have suggested that women may be more negatively affected by alcohol use than men (
35). Our sample was adequately large to address possible sex differences in adolescent drinkers. While our male drinkers endorsed drinking more drinks on each occasion, they obtained peak blood alcohol levels similar to those of female drinkers. Despite their similar drinking levels, the only sex difference observed in our adolescents was for the temporal lobe group-by-age interaction, which was significant for the male but not the female adolescents, although the trajectory of the female drinkers showed a nonsignificant trend toward deviation from normal in the same direction as male drinkers. These findings suggest that male and female heavy drinkers can sustain similar alterations in cortical brain volume growth during adolescence, taking into account potential differences in normal brain growth trajectories related to sex and pubertal development. However, smaller-volume regions such as the amygdala, the hippocampus, and other sexually dimorphic regions known to be affected by alcohol were not examined in this analysis and should be examined in future studies.
Disruption of the normal developmental trajectory of brain volume maturation during adolescence may have the potential to exert a negative effect on normal performance and development of cognitive and motor abilities (
36). Deviations in structural brain development may partly explain previous longitudinal findings that adolescent heavy drinkers show worsening performance on behavioral tasks of visuospatial processing, attention, and working memory after initiating alcohol use (
16,
37,
38). Furthermore, abnormalities of neural growth patterns in heavy drinkers may contribute to short-term or long-term negative effects on cognitive, social, and academic functioning. Even longitudinal study, however, precludes discerning whether such functional difficulties are the result of excessive drinking alone or occur in interaction with the burden of a family history of alcohol dependence and a heightened likelihood of engaging in externalizing behaviors, including risk for consuming licit and illicit drugs along with alcohol, which occurs with greater incidence in heavy-drinking adolescents (
39). Indeed, a large proportion of the heavy drinkers in this study also consumed small to large amounts of marijuana and other drugs. Comparing only the drug-using heavy drinkers to nondrinking control subjects produced results similar to the comparison of all heavy users. For instance, as seen in
Figure 8, for the temporal cortex, the heavy alcohol drinkers with or without illicit drug use had similarly accelerated trajectories. There were, however, a few measures in which an effect for other substance use could be demonstrated over and above that of heavy alcohol use, and one of these (the corpus callosum) was counterintuitive. Despite substantial drug use among a few participants, the small sample size may have been inadequate to detect a compounded alcohol and drug effect.
Drinking levels in the adolescents in this study ranged from none to moderate to heavy, and likely limited our ability to identify an adequate number of adolescents who never exceeded a moderate level of drinking. Therefore, we focused the primary analysis on those participants who reported heavy drinking on at least one of their visits, thereby maximizing the likelihood of observing an effect because of the sample size and reported level of exposure. Post hoc analysis of the moderate drinkers failed to identify significant differences from nondrinkers in trajectory for any of the brain measures, likely in part because of lack of power.
Familial density of alcoholism did not differ between groups, and although externalizing symptoms were higher in heavy drinkers, the vast majority of participants in both groups were, not surprisingly, in the normal range. Rates of conduct disorder were higher in the heavy drinkers compared with the nondrinkers (10 heavy drinkers compared with two nondrinkers). Future studies with larger sample sizes and higher rates of adolescents with externalizing disorders will be able to disentangle the effects of heavy drinking from predisposing factors such as comorbid psychological disorders and genetics.
Despite their strengths, controlled longitudinal studies suffer limitations, including interpretation of causality underlying observed brain volume changes. Nonetheless, our longitudinal analysis enabled detection of acceleration of normal volume decline in anterior and temporal cortical volumes and attenuation of growth in principal white matter structures in heavy-drinking adolescents. These results provide a call for caution regarding heavy alcohol use during adolescence, whether heavy alcohol drinking is the cause or one of many factors in a constellation of causes of these alterations in brain development.
