Does Smoking Predict Subsequent Risk for Schizophrenia?
Smoking status at first midwife assessment from the birth registry was available for 1,413,849 women with no prior history of nonaffective psychosis. (For all other relevant sample sizes, see
online data supplement.) Their mean age at first assessment was 27.3 years (SD=5.2), and their mean follow-up period was 18.5 years (SD=8.4). In
Table 1 and
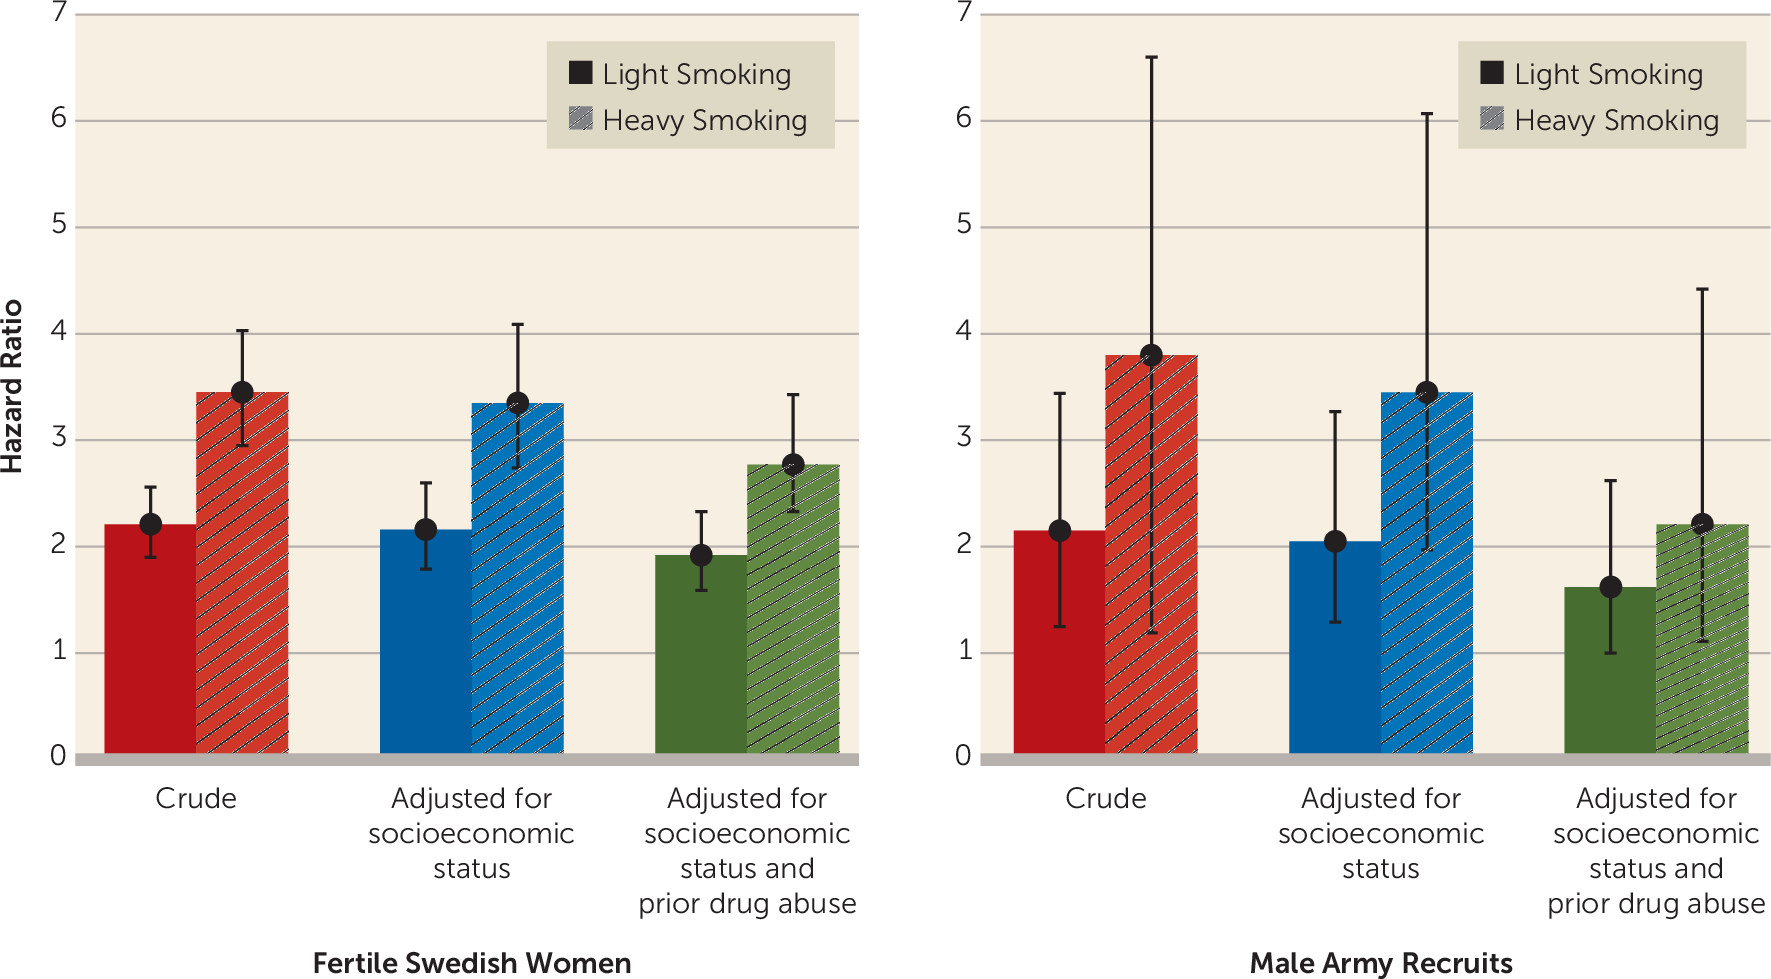
Figure 1, we first present raw hazard ratios for future episodes of schizophrenia associated with light smoking (hazard ratio=2.21, 95% CI=1.90–2.56) and heavy smoking (hazard ratio=3.45, 95% CI=2.95–4.03).
Smoking data were available for 233,879 men with no prior diagnosis of nonaffective psychosis, as part of their evaluation for army conscription between 2002 and 2008. Their mean age at evaluation was 18.3 years (SD=0.6), and their mean follow-up period was 7.9 years (SD=1.9). We analyzed the observed association between light and heavy smoking and subsequent risk for schizophrenia in the same manner as with the female sample (
Table 2 and
Figure 1). The raw hazard ratios for future episodes of schizophrenia in this sample were 2.15 (95% CI=1.25–3.44) for light smoking and 3.80 (95% CI=1.19–6.60) for heavy smoking.
Is There a Dose-Response Relationship Between Smoking and Risk for Schizophrenia?
In both our female and male samples, risk for schizophrenia was more strongly associated with heavy than with light smoking. We sought to validate our smoking exposure in the female sample, which both was larger and had a much longer follow-up period. Could we show that the heavy-smoking group indeed had greater smoke exposure than our light-smoking group? Odds ratios for subsequent onset of lung cancer in this sample were 4.31 (95% CI=3.75–4.96) for light smoking and 8.18 (95% CI=7.17–9.34) for heavy smoking. For the more commonly occurring COPD, the odds ratios were 4.63 (95% CI=4.38–4.90) and 9.39 (95% CI=8.89–9.91), respectively.
We explored another measure of smoking severity as a proxy for nicotine dependence, namely, smoking behavior just before and in early and late pregnancy. A total of 643,968 women reported their smoking status prior to the start of their pregnancy, and 763,899 women reported their smoking status at week 30–32. Compared with the smoking rate at their first prenatal visit, typically at week 1 or 2 (19.4%), smoking was slightly more common prior to pregnancy (21.9%) and much lower at week 30–32 (10.1%). In the subset of our sample seen in 1999 and later, when smoking was assessed at all three time points, we constructed five categories that likely reflect increasing levels of nicotine dependence (
Table 3). For example, women in category 1 only smoked lightly before becoming pregnant and quit before their first midwife visit. Those in category 5, by contrast, were smoking heavily at week 30–32. For COPD, substantially increased risks were seen for women in categories 3 to 5, so we can infer that it was these groups that had the highest lifetime smoke exposure. For schizophrenia, a significantly increased risk was restricted to women in categories 4 and 5, and for nonaffective psychosis, increased risk was seen for women in categories 2 to 5.
Does the Smoking-Schizophrenia Association Arise From Key Potential Confounders?
As seen in
Table 1 and
Figure 1, when we added covariates that reflected neighborhood and parental socioeconomic status to the regression model in our female sample, the hazard ratios between smoking and schizophrenia were slightly lower (2.16 and 3.35, respectively). Drug abuse, another potential confounder, was present in 4.8% (95% CI=4.7–4.9) of the smoking women and 0.8% (95% CI=0.8–0.9) of the nonsmoking women in our sample. Adding registration for prior drug abuse to the model further reduced the hazard ratios, although modestly (to 1.92 and 2.77, respectfully). As seen in
Table 2 and
Figure 1, adding controls for family-level and community-level socioeconomic status results in our male sample also resulted in a modest diminution of the smoking-schizophrenia association (to hazard ratios of 2.05 and 3.45, respectively). A somewhat greater reduction in hazard ratios was seen in the male sample when we added prior registration for drug abuse to the model (to 1.62 and 2.21, respectively), perhaps because of the higher prevalence in this sample (22.4% [95% CI=21.9–22.8] for the smokers and 4.0% [95% CI=3.9–4.1] for the nonsmokers).
Does the Smoking-Schizophrenia Association Arise From Shared Familial/Genetic Risk Factors?
We next conducted co-relative analyses to examine the degree to which the smoking-schizophrenia association could be explained by shared familial/genetic risk factors. We compared the association between smoking and schizophrenia in our female cohort to the associations observed within pairs of relatives of increasing genetic relatedness who had been selected on the basis of discordance for smoking. If the smoking-schizophrenia association arises largely from shared familial/genetic risk factors, the magnitude of that association should decline within pairs of increasing familial/genetic relationship. As most easily seen in monozygotic twins discordant for smoking, if smoking and schizophrenia co-occur because of the effect of a common set of risk genes, the risk for schizophrenia should be the same in the smoking and the nonsmoking member of such a pair, as they share all of their genes.
Because the rarity of schizophrenia in this sample resulted in unstable statistical estimates, we emphasize our analyses of nonaffective psychosis and, for comparison, COPD. To simplify the interpretation of these findings, we estimated the hazard ratio per one-unit increase in the three-level risk factor of nonsmoking, light smoking, and heavy smoking.
In
Table 4, we present the descriptive hazard ratios estimated from the entire population and from full sisters, half sisters, and female cousins discordant for smoking. No appreciable difference is seen in the magnitude of the smoking-nonaffective psychosis association in the general population and in cousins. Modest decreases are seen in half and full siblings.
To estimate the critical results in monozygotic pairs, we fitted a model based on four sets of relative pairs: first cousins, half siblings, full siblings, and monozygotic twin pairs (
Table 5). For both nonaffective psychosis and COPD, a model that constrained these hazard ratios to be dependent on genetic resemblance only slightly changed the within-pair estimates and, as detailed in the footnotes to
Table 5, fit the data well. For nonaffective psychosis, this model predicted a significant association within discordant monozygotic twins between smoking and nonaffective psychosis. Where one member of a monozygotic twin pair is a nonsmoker and the other a smoker, the model predicts a relative risk for nonaffective psychosis, respectively, 30% higher for the light-smoking co-twin and 69% higher for the heavy-smoking co-twin (the confidence intervals do not include unity for either of these estimates).
For interest, we also present results for COPD, which has a well-established causal association with smoking. The pattern is similar, although the association is stronger overall.
Analogous to results presented for nonaffective psychosis in
Table 4, we calculated the hazard ratio for schizophrenia in the entire sample (3.58, 95% CI=3.10–4.15) and in cousins (3.87, 95% CI=2.86–5.25), half sisters (4.75, 95% CI=2.27–9.91), and full sisters (2.27, 95% CI=1.59–3.23) discordant for heavy smoking. While known less precisely, the trend—showing moderate familial confounding in sisters but none in cousins or half sisters—is similar to that seen for nonaffective psychosis.