Full access
Articles
Published Online: 22 January 2016

Depression-Related Increases and Decreases in Appetite: Dissociable Patterns of Aberrant Activity in Reward and Interoceptive Neurocircuitry

Abstract

Objective:

Appetite and weight changes are common but variable diagnostic markers in major depressive disorder: some depressed individuals manifest increased appetite, while others lose their appetite. Many of the brain regions implicated in appetitive responses to food have also been implicated in depression. It is thus remarkable that there exists no published research comparing the neural responses to food stimuli of depressed patients with increased versus decreased appetites.

Method:

Using functional MRI, brain activity was compared in unmedicated depressed patients with increased or decreased appetite and healthy control subjects while viewing photographs of food and nonfood objects. The authors also measured how resting-state functional connectivity related to subjects' food pleasantness ratings.

Results:

Within putative reward regions, depressed participants with increased appetites exhibited greater hemodynamic activity to food stimuli than both those reporting appetite decreases and healthy control subjects. In contrast, depressed subjects experiencing appetite loss exhibited hypoactivation within a region of the mid-insula implicated in interoception, with no difference observed in this region between healthy subjects and those with depression-related appetite increases. Mid-insula activity was negatively correlated with food pleasantness ratings of depressed participants with increased appetites, and its functional connectivity to reward circuitry was positively correlated with food pleasantness ratings.

Conclusions:

Depression-related increases in appetite are associated with hyperactivation of putative mesocorticolimbic reward circuitry, while depression-related appetite loss is associated with hypoactivation of insular regions that support monitoring the body’s physiological state. Importantly, the interactions among these regions also contribute to individual differences in the depression-related appetite changes.
Major depressive disorder is a leading cause of chronic disability (1) and mortality (2) worldwide. Many of the health consequences associated with depression are due to the fact that this disorder predisposes and exacerbates other chronic medical conditions, including diseases related to depression’s vegetative symptoms, such as obesity and diabetes (3, 4). Importantly, the vegetative symptoms to which these conditions are most closely related, namely appetite and weight changes, are not shared by all patients with depression. Patients with major depressive disorder exhibit marked heterogeneity in appetite, with approximately 48% of adult depressed patients exhibiting depression-related decreases in appetite, while approximately 35% exhibit depression-related increases in appetite (5). In fact, across large depressed cohorts, appetite and weight changes are often some of the most discriminating symptoms in latent class analyses of depression subtypes (68). These changes in appetite and weight are 75%−85% stable across depressive episodes (9, 10), suggesting that they may be trait markers of how depression is manifested within a particular individual.
In light of the variable involvement of eating-related symptoms in depression, it is significant that the orbitofrontal cortex, ventromedial prefrontal cortex, amygdala, insula, and striatal-pallidal neurocircuits are involved in various aspects of appetitive responses to food (1117), and some of these regions also exhibit histopathological and functional differences in major depressive disorder patients that are thought to underlie depression (18, 19). Remarkably, although increases and decreases in appetite are antipodal criteria in the diagnosis of major depressive disorder, and core regions implicated in the pathophysiology of depression are implicated in appetite, there are no studies comparing the neural responses to food stimuli of patients whose depression manifests with appetite increases versus those for whom depressive episodes result in appetite loss. This is significant because phenotypic variability among depressed patients’ appetitive responses to food may provide a heretofore-unexplored neural phenotype to identify subgroups within depression. In fact, although there is now evidence that functional neuroimaging may classify patients according to how they respond to psychological and pharmacological treatments (20, 21), there are surprisingly few additional examples of differential neural responses among depression subgroups defined strictly by behavioral symptoms. Evidence of differential neural responses between those for whom depressive episodes are associated with either appetite decreases or increases would support the claim that major depressive disorder is not a unitary disorder, but rather results from distinct pathophysiological constructs. It remains unclear, however, which brain regions might be implicated by such an analysis, as depression-related appetite changes may stem from altered activity within multiple dissociable neural circuits. Functional neuroimaging provides the most direct way to assay these neural circuits and their interactions. In the long term, elucidating which brain regions distinguish between depressed individuals who manifest increased versus decreased appetite may prove seminal to the identification of biomarkers for depression and its subtypes.
We asked healthy adults, unmedicated currently depressed adults reporting depression-associated appetite increases, and unmedicated currently depressed adults reporting depression-associated appetite decreases to perform both a food/nonfood picture-viewing task and a resting-state scan while undergoing functional MRI (fMRI) (see Figure S1 in the data supplement accompanying the online version of this article). In addition, the subjects viewed a different set of food photographs and provided ratings of how pleasant it would be to eat the pictured foods (see Figure S2 in the online data supplement). The study’s methods and analyses were aimed at addressing the following previously unanswered questions. First, do adults who experience depression-related increases and decreases in appetite exhibit differential activity within brain regions that underlie appetitive responses to food stimuli in healthy nondepressed adults? Second, what additional brain regions exhibit differential responses to food stimuli among adults manifesting depression-related increases and decreases in appetite, and what might the anatomical distribution of these differential responses tell us about the pathophysiologies underlying depression subtypes? Third, how does activity in these regions relate to the food pleasantness inferences of depressed subjects with increased and decreased appetite? Fourth, how does the intrinsic functional connectivity of these regions influence these individuals’ food pleasantness ratings?

Method

Participants

Forty-eight right-handed native English-speaking volunteers between the ages of 20 and 50 years with a body mass index (BMI) ≥18.5 participated in the study: 16 participants with major depressive disorder who reported increased appetite in the current depressive episode (female, N=13; age range=24–47 years), 16 participants with major depressive disorder who reported decreased appetite in the current depressive episode (female, N=10; age range=20–50 years), and 16 healthy control subjects (female, N=11; age range=21–48 years). In addition to matching for age, the three groups also did not differ in BMI (see Table 1) and were in line with the BMI values of the community in which the data were collected (Oklahoma), where nearly 70% of the population is either overweight or obese according to the Centers for Disease Control and Prevention (http://www.cdc.gov/brfss/brfssprevalence/). Subjects with an unhealthily low BMI <18.5 were excluded from the study. All depressed subjects met DSM-IV criteria for current major depressive disorder. None of the depressed participants had received any psychotropic medication within the preceding 3 weeks (6 weeks for fluoxetine). For additional exclusion criteria and scales used to characterize the sample, see the Methods section in the online data supplement. After complete description of the study to the subjects, written informed consent was obtained.
TABLE 1. Demographic and Clinical Characteristics of Participantsa
VariableHealthy Control Subjects (N=16)Depressed Appetite-Increase Subjects (N=16)Depressed Appetite-Decrease Subjects (N=16)Analysis
 MeanSDMeanSDMeanSDp
Age (years)33.99.036.37.835.48.90.75
Body Mass Index (kg/m2)29.14.530.25.529.36.20.64
Hamilton Depression Rating ScaleN/AN/A24.67.121.46.20.20
Hamilton Anxiety Rating ScaleN/AN/A18.45.316.17.50.32
State-Trait Anxiety Inventory–StateN/AN/A42.313.740.911.10.77
State-Trait Anxiety Inventory–TraitN/AN/A55.19.253.112.40.61
Modified Snaith-Hamilton Pleasure ScaleN/AN/A23.95.828.27.80.09
 N%N%N%p
Number of female subjects1168.81381.31062.50.24b
Number of medicated subjects000000 
a
The Snaith-Hamilton Pleasure Scale was modified to remove items referring to consumption of food and drink.
b
The data were determined using chi-square statistics.
Depressed subjects were assigned to either the appetite increase or decrease groups based on their responses to the questions about appetite changes in the mood disorders module of the Structured Clinical Interview for DSM-IV Axis I Disorders and confirmed in an interview with a research psychiatrist. Anhedonia was assessed using the Snaith-Hamilton Pleasure Scale. Because the Snaith-Hamilton Pleasure Scale rates loss of interest in food and drink more severely than increased interest, we excluded these questions from scoring, and the depression subgroups did not differ significantly in anhedonia severity (Table 1).

Experimental Design

Subjects were scanned between the hours of noon and 16:00. The timing of scanning relative to the last meal was recorded but not fixed (the mean interval between the last feeding and scanning did not differ across groups; see the Methods section in the online data supplement). Upon entering the scanner, participants underwent an anatomical scan, then an 8-minute resting-state scan during which they were instructed to visually fixate on a small cross in the middle of the display screen and were asked to clear their mind and try not to think about anything in particular. In addition, they performed the food/nonfood picture task. In this task, subjects saw a diverse selection of 180 food photographs and 45 nonfood photographs. Foods included appetizing items high in fat and sugar, as well as fruits and vegetables. Nonfood photographs depicted small, manipulable household and office implements. On the same day, subjects also performed the Food Pleasantness Rating Task, in which they saw photographs of 144 different foods and made ratings of how pleasant it would be to eat each food item at that particular moment. This task requires subjects to make hedonic inferences about the foods. The stimuli depicted four broad classes of food items, including high-fat high-sweet foods (e.g., primarily “dessert” foods such as cake and ice cream), high-fat low-sweet foods (e.g., savory foods such as pizza), low-fat high-sweet foods (e.g., fruits), and low-fat low-sweet foods (e.g., vegetables). For additional details regarding the tasks, stimuli, and stimulus presentation, see the Methods section and Figures S1 and S2 in the data supplement.

MRI Data Acquisition, Image Preprocessing, and Subject-Level Statistical Analyses

Magnetic resonance images were acquired using a General Electric Discovery MR750 whole-body 3-Tesla MRI scanner (GE Healthcare, Little Chalfont, United Kingdom), using a scalable 32-channel digital MRI receiver. The Methods section in the online data supplement provides details of the preprocessing and motion-scrubbing techniques applied to the resting-state fMRI data and of the imaging parameters, data processing, and subject-level regression models applied to the task-based and resting-state imaging data. Briefly, functional data were coregistered to the anatomical scan, slice time corrected, motion corrected, spatially normalized to a standard stereotaxic array, smoothed, and converted to percent signal change of the blood-oxygenation-level-dependent (BOLD) signal. Each subject’s functional imaging data were analyzed using multiple linear regression, with regressors marking the onset of picture stimuli, as well as covariates for motion parameters and signal trends.

Group Analyses

Group analyses of the food/nonfood picture task data were implemented using multiple strategies, all employing two-tailed statistical tests. First, we used a whole-brain voxel-wise random-effects paired-sample t test of the healthy subjects’ beta coefficients for food and nonfood stimuli derived from the subject-level regression analyses. The resulting group statistical map was corrected for multiple comparisons according to procedures described in the Methods section of the online data supplement. We then used random-effects, independent samples t tests on the beta coefficients from the two depressed groups’ subject-level regression analyses within each of seven corrected regions of interest identified in the analyses of the healthy control subjects’ data.
We next determined whether additional regions outside of those normative regions of interest identified in the healthy control subjects might contribute to appetite differences between depressed groups. We therefore performed a voxel-wise one-way analysis of variance (ANOVA) to identify brain regions where the groups exhibited differential responses to food versus nonfood stimuli. The resulting ANOVA F-map was corrected for multiple comparisons using the procedures described in the data supplement. We then conducted follow-up planned comparisons using independent samples t tests of the simple effects within each region of interest to determine which group differences supported the significant ANOVA findings. The post hoc t tests were corrected for multiple comparisons using Tukey’s honest significant difference test.
Between-group t tests were used in the group analyses of the food pleasantness task ratings. Pearson correlations were used to examine the relationship between the subjects’ food pleasantness ratings and activity in the normative regions of interest (described above) that were responsive to food versus nonfood images in the healthy subjects.
To examine the relationship between subjects’ average food pleasantness ratings and the intrinsic functional connectivity of the seven normative food-responsive regions of interest, the resting-state BOLD activity in each region of interest was used as a seed in analyses of the resting-state data, using the AFNI [Analysis of Functional NeuroImages] program 3dttest++, with the subjects’ average pleasantness rating entered as a covariate. The subsequent statistical map was corrected for multiple comparisons (see the data supplement).
Exploratory group analyses examined whether the increased and decreased appetite depressed groups exhibited self-reported differences in sleep characteristics indicative of atypical and melancholic depression. No difference was observed (see the Discussion section and Table S12 in the data supplement).

Results

Food/Nonfood Picture Task

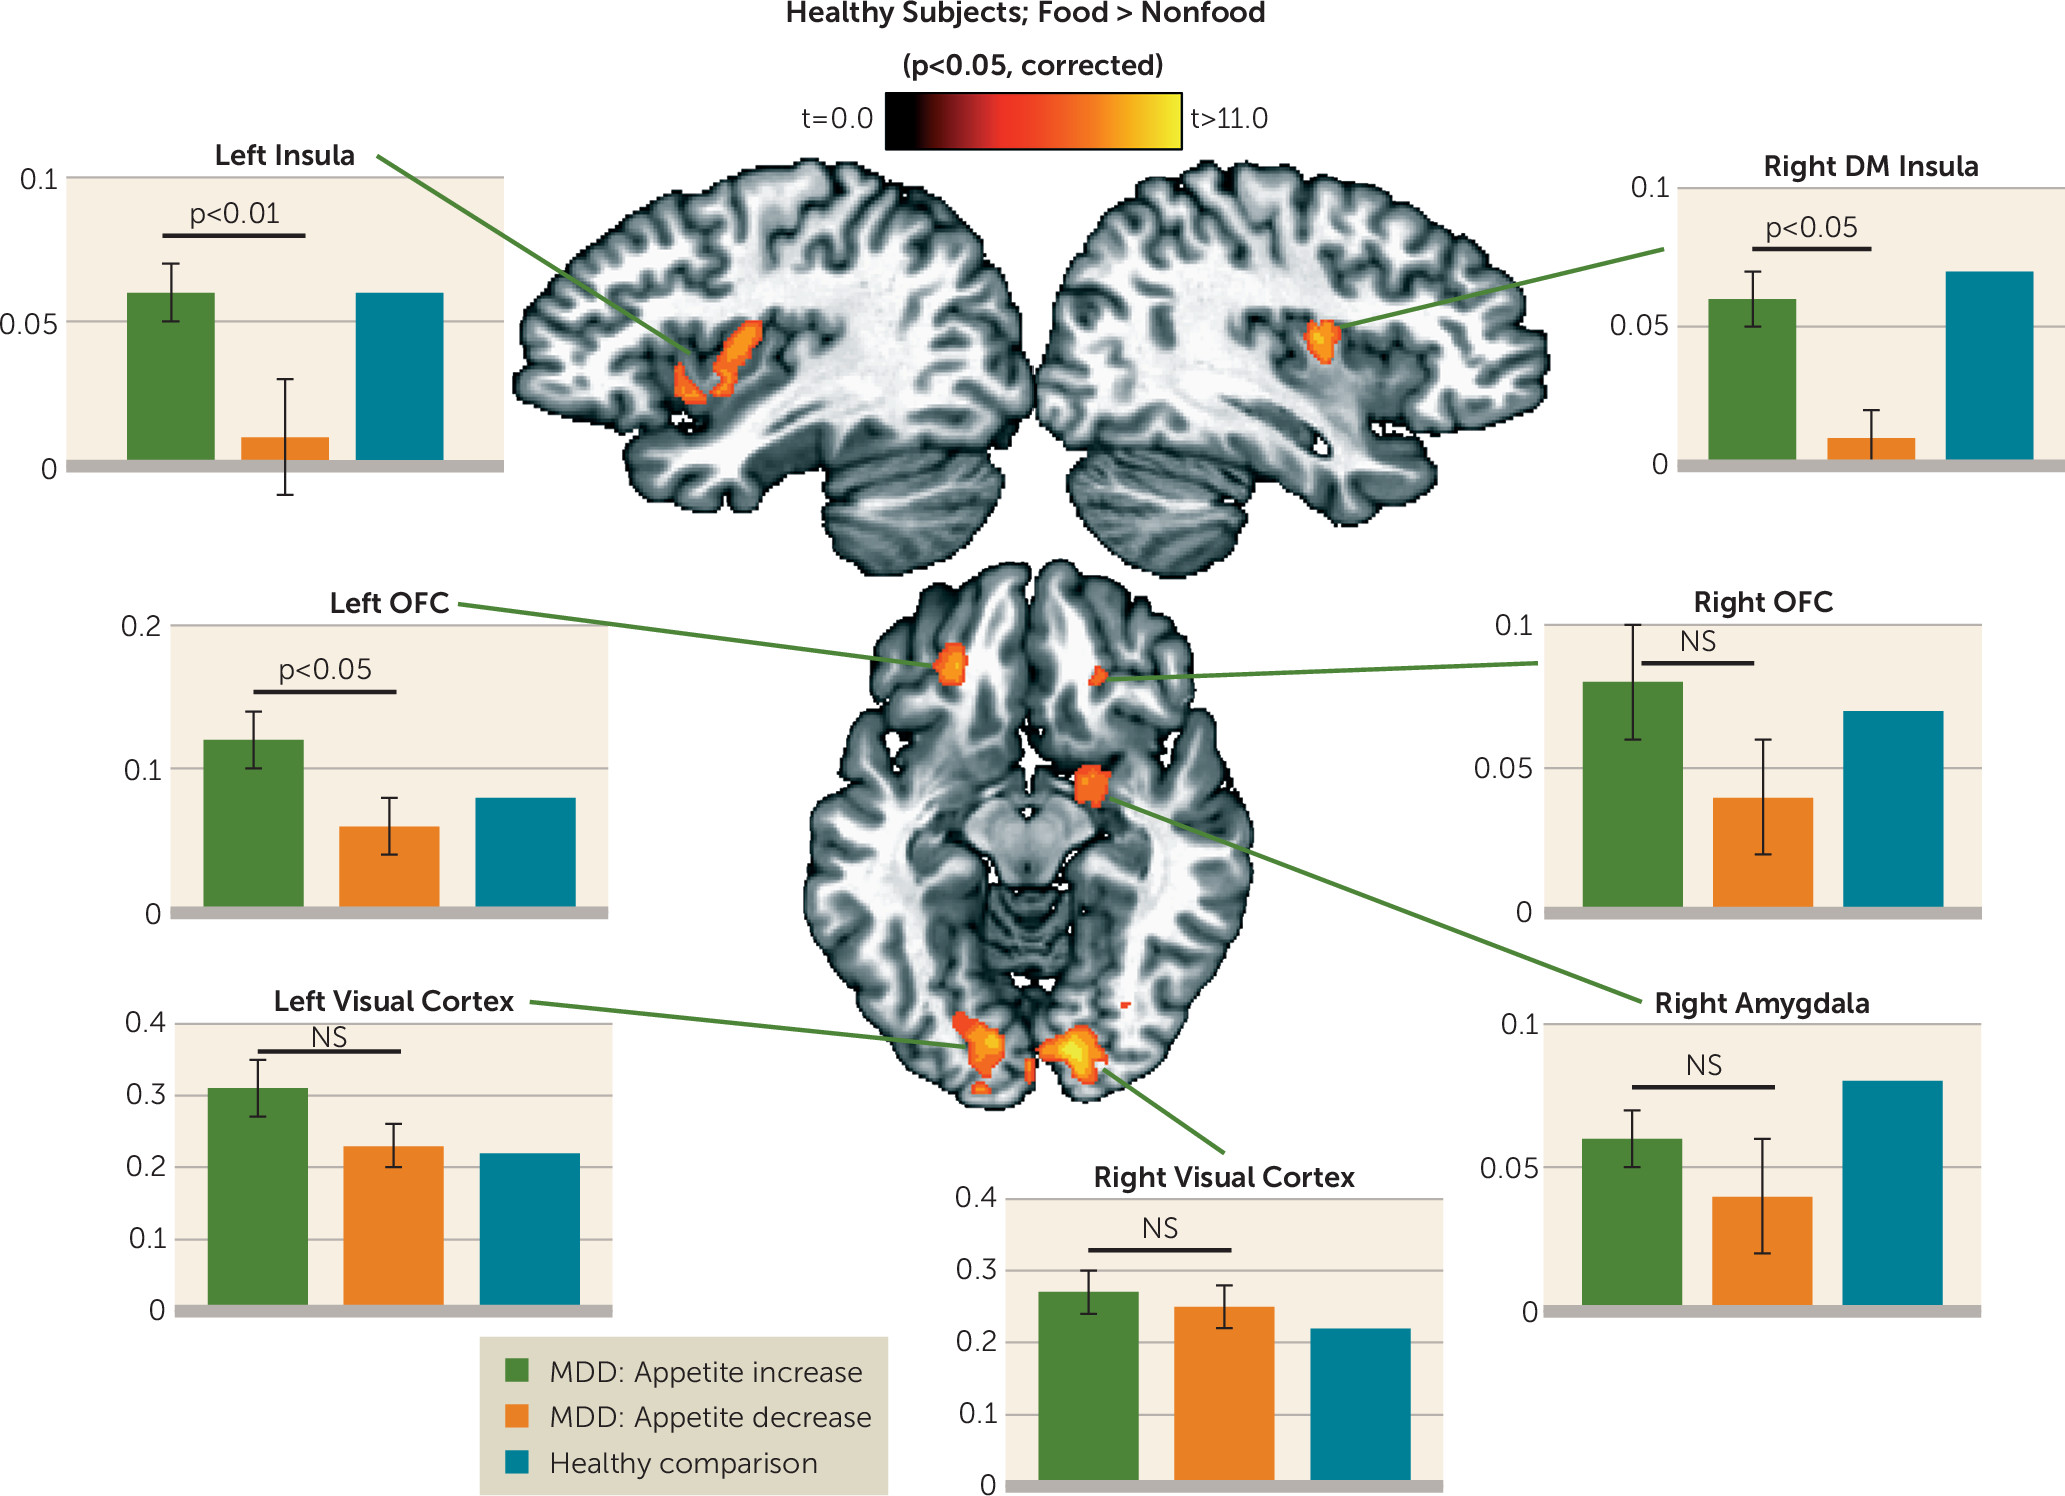
The healthy control subjects exhibited greater responses to food than nonfood stimuli in seven regions; notably each of these regions had been identified in previous studies of healthy adults’ responses to food pictures (Figure 1; also see Table S1 in the online data supplement) (14, 15, 22). Hemodynamic activity increased bilaterally in visual association cortex in an area that encompassed portions of the cuneus and lingual gyrus. Bilateral activity was also observed in the mid-insula region corresponding approximately to the middle short and posterior short insular gyri, with the left hemisphere cluster extending anteriorly into a region corresponding approximately to the anterior short and accessory insular gyri. In the medial orbitofrontal cortex, bilateral activity was observed in a region that appeared to be in the vicinity of Brodmann’s areas (BAs) 13l and 11l (23). Finally, food-related activity was also observed in the right amygdala. These seven clusters were subsequently used in region-of-interest analyses to determine whether the two depressed groups exhibit distinct activity within regions that respond to food stimuli in healthy nondepressed adults. Indeed, the depressed subjects with appetite increases exhibited greater activity than those with appetite decreases within the left orbitofrontal cortex and bilateral mid-insula (Figure 1; for effect sizes, see Tables S2 and S3 in the data supplement). For discussion of sex differences on this task, see the Results section in the data supplement.
FIGURE 1. Depression-Related Increases and Decreases in Appetite Associated With Differential Insula and Orbitofrontal Cortex Responses in Regions That Respond More to Food Images in Healthy Control Subjectsa
a The brain images show seven regions where activity was greater in response to food than nonfood pictures in the healthy nondepressed subjects (p<0.05, corrected). The bar graphs show the mean response for each depressed group within regions of interest defined using only the image data from the healthy control group. Significant differences were observed between the depressed groups in the bilateral insula and left orbitofrontal cortex regions of interest. Brain slice coordinates conform to the stereotaxic array of Talairach and Tournoux, with slices presented according to neurological convention (i.e., left hemisphere presented in left side of the image). The y-axis of each graph displays the functional MRI percent signal change for food relative to nonfood images. Error bars are not displayed for the healthy comparison subjects’ graphs because these subjects’ data were used to define the clusters, and therefore their variance estimate is overdetermined, and thus these data should not be compared statistically to the data from the other two groups. DM=dorsal mid-insula; MDD=major depressive disorder; OFC=orbitofrontal cortex.
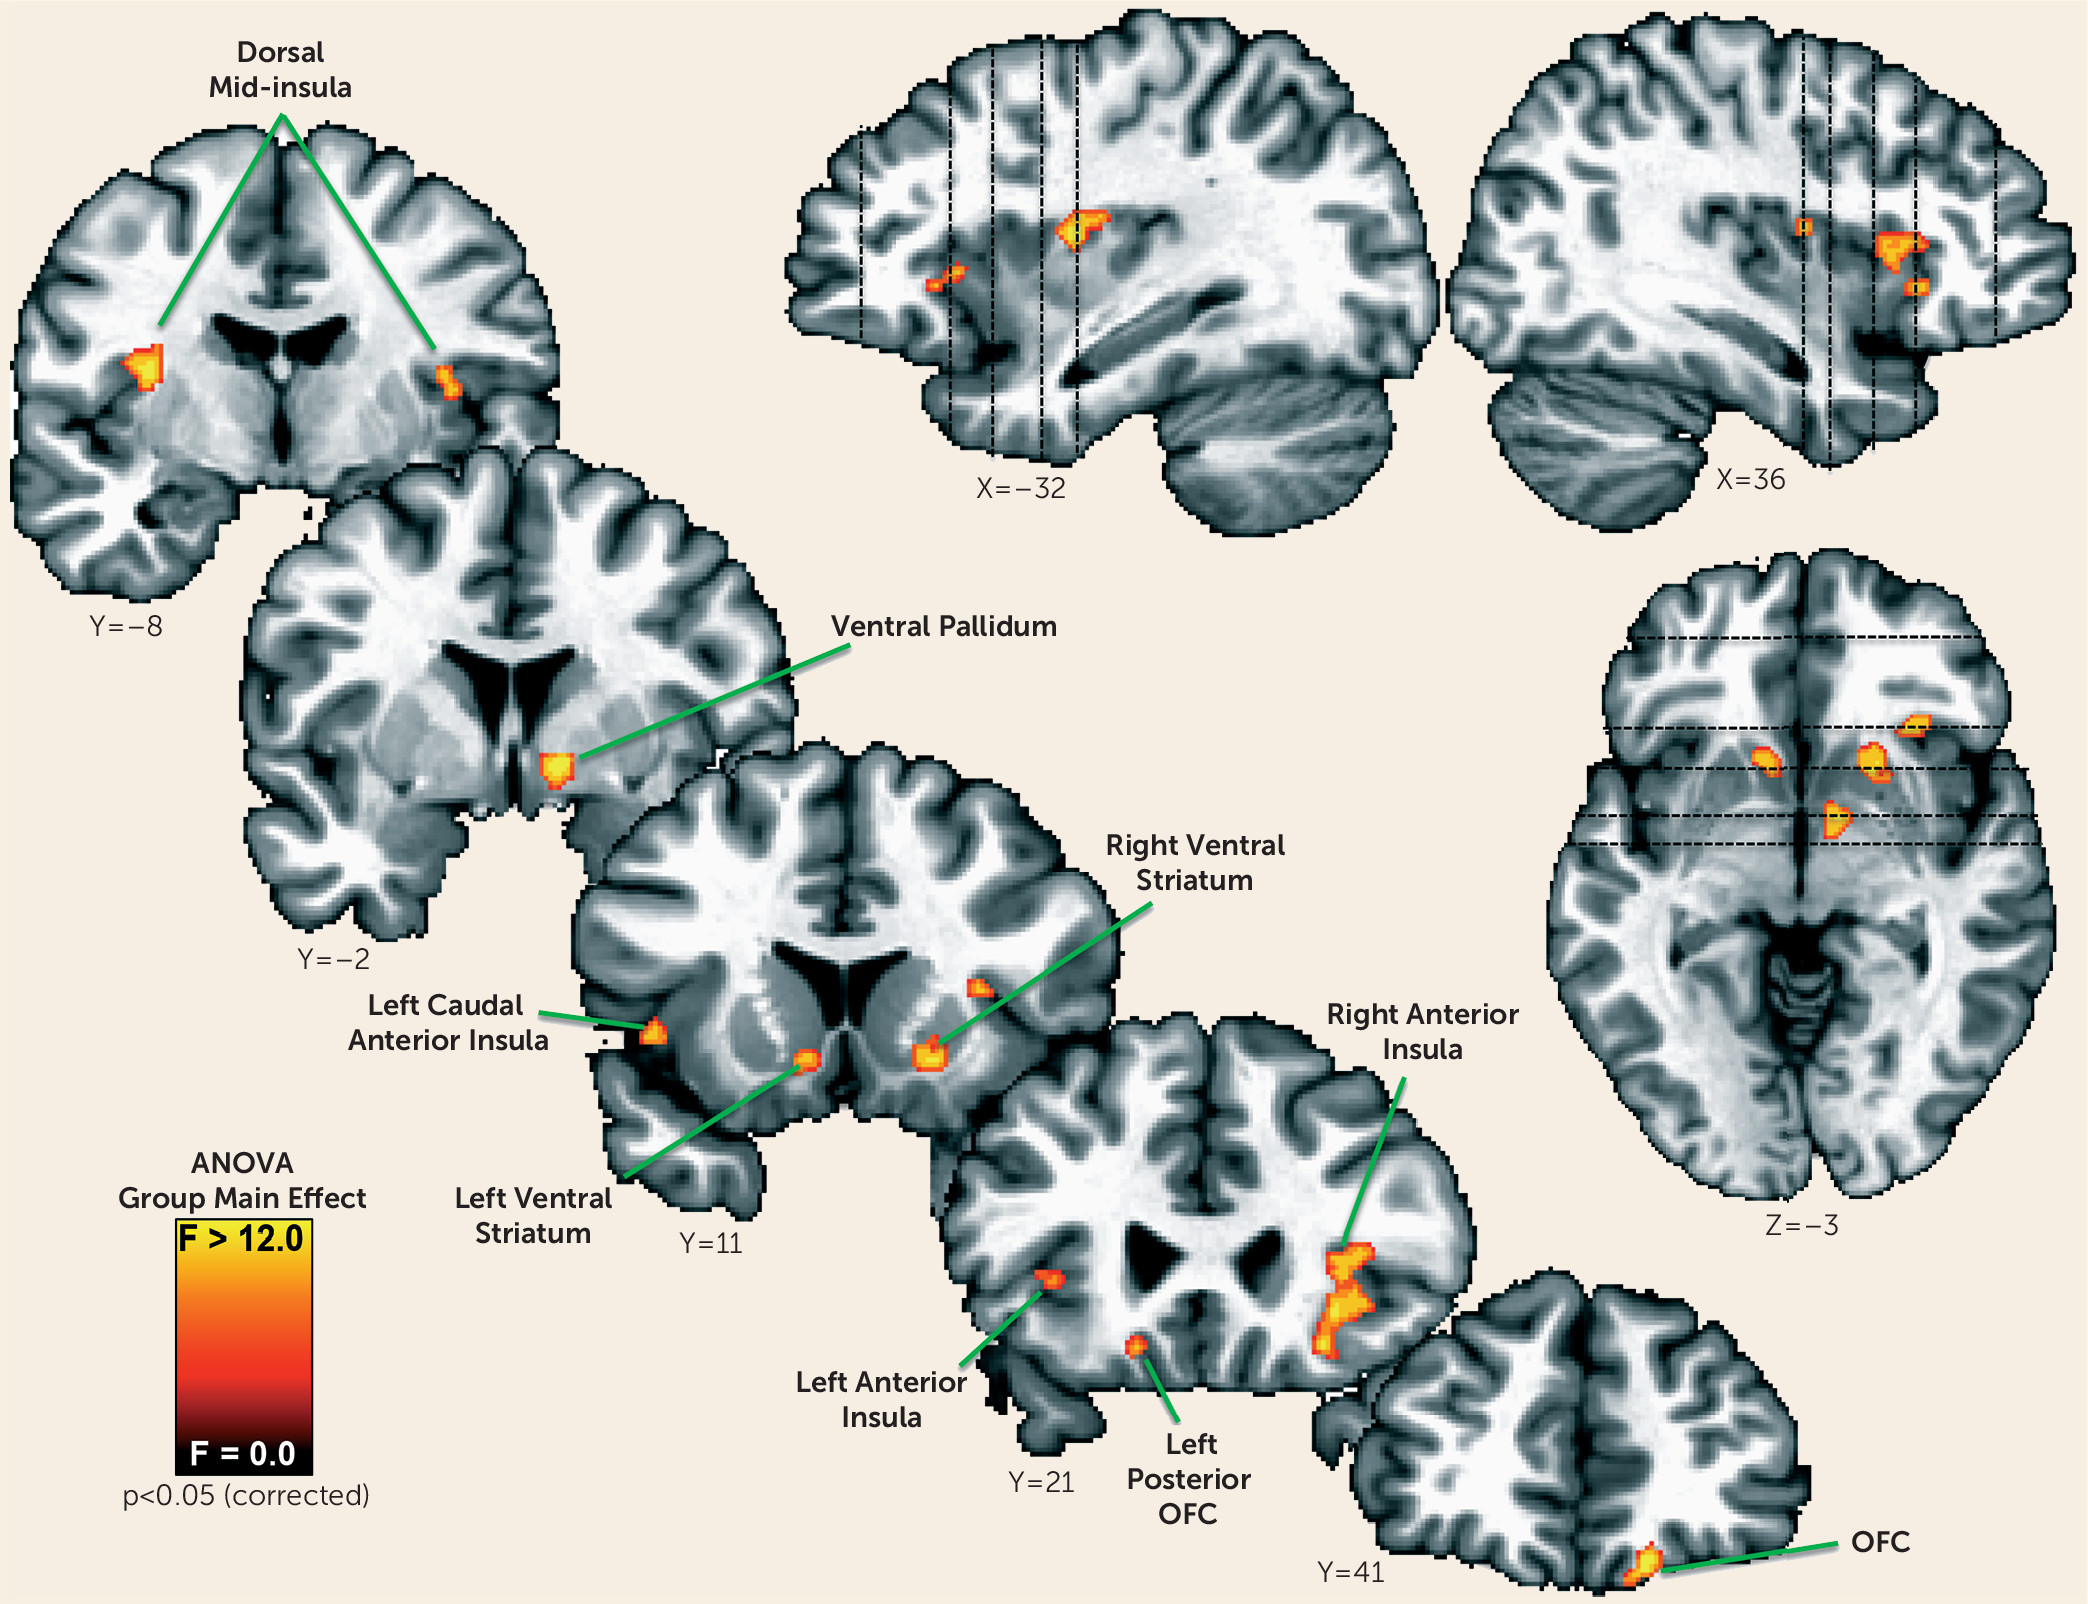
To assess the possibility that appetite changes in depression may also arise from abnormal activity in brain regions beyond those that exhibit food-specific responses in healthy subjects, a whole-brain ANOVA was used to identify regions that exhibited group differences in responses to food images relative to nonfood control images (see Table S4 in the data supplement). Activity differences emerged throughout reward and interoceptive pathways previously implicated both in depression and food perception. These regions included the right medial orbitofrontal cortex (approximately BA 11), the left posterior orbitofrontal cortex (approximately BA 13), and the bilateral ventral striatum, including the accumbens area, right ventral pallidum, and right putamen (Figures 2 and 3; also see Table S3 in the data supplement). Additionally, group differences were observed bilaterally within the anterior insula cortex. Finally, group differences were also observed in the left caudal anterior insula and bilaterally in the dorsal mid-insula in a region that corresponds approximately to the middle short and posterior short insula gyri.
FIGURE 2. One-Way Analysis of Variance (ANOVA): Regions Exhibiting Group Differences in Responses to Food Picturesa
a Statistical maps showing 11 brain regions where activity differed between the three groups (p<0.05, corrected). Slice coordinates conform to the stereotaxic array of Talairach and Tournoux, in which each plane is located by its distance in mm from the origin (anterior commissure), such that positive x, y, and z correspond to left, anterior, and dorsal, respectively. The left hemisphere is presented in the left. See Table S5 in the online data supplement and Figure 3 for tests of the simple effects and effect sizes underlying these ANOVA main effects. OFC=orbitofrontal cortex.
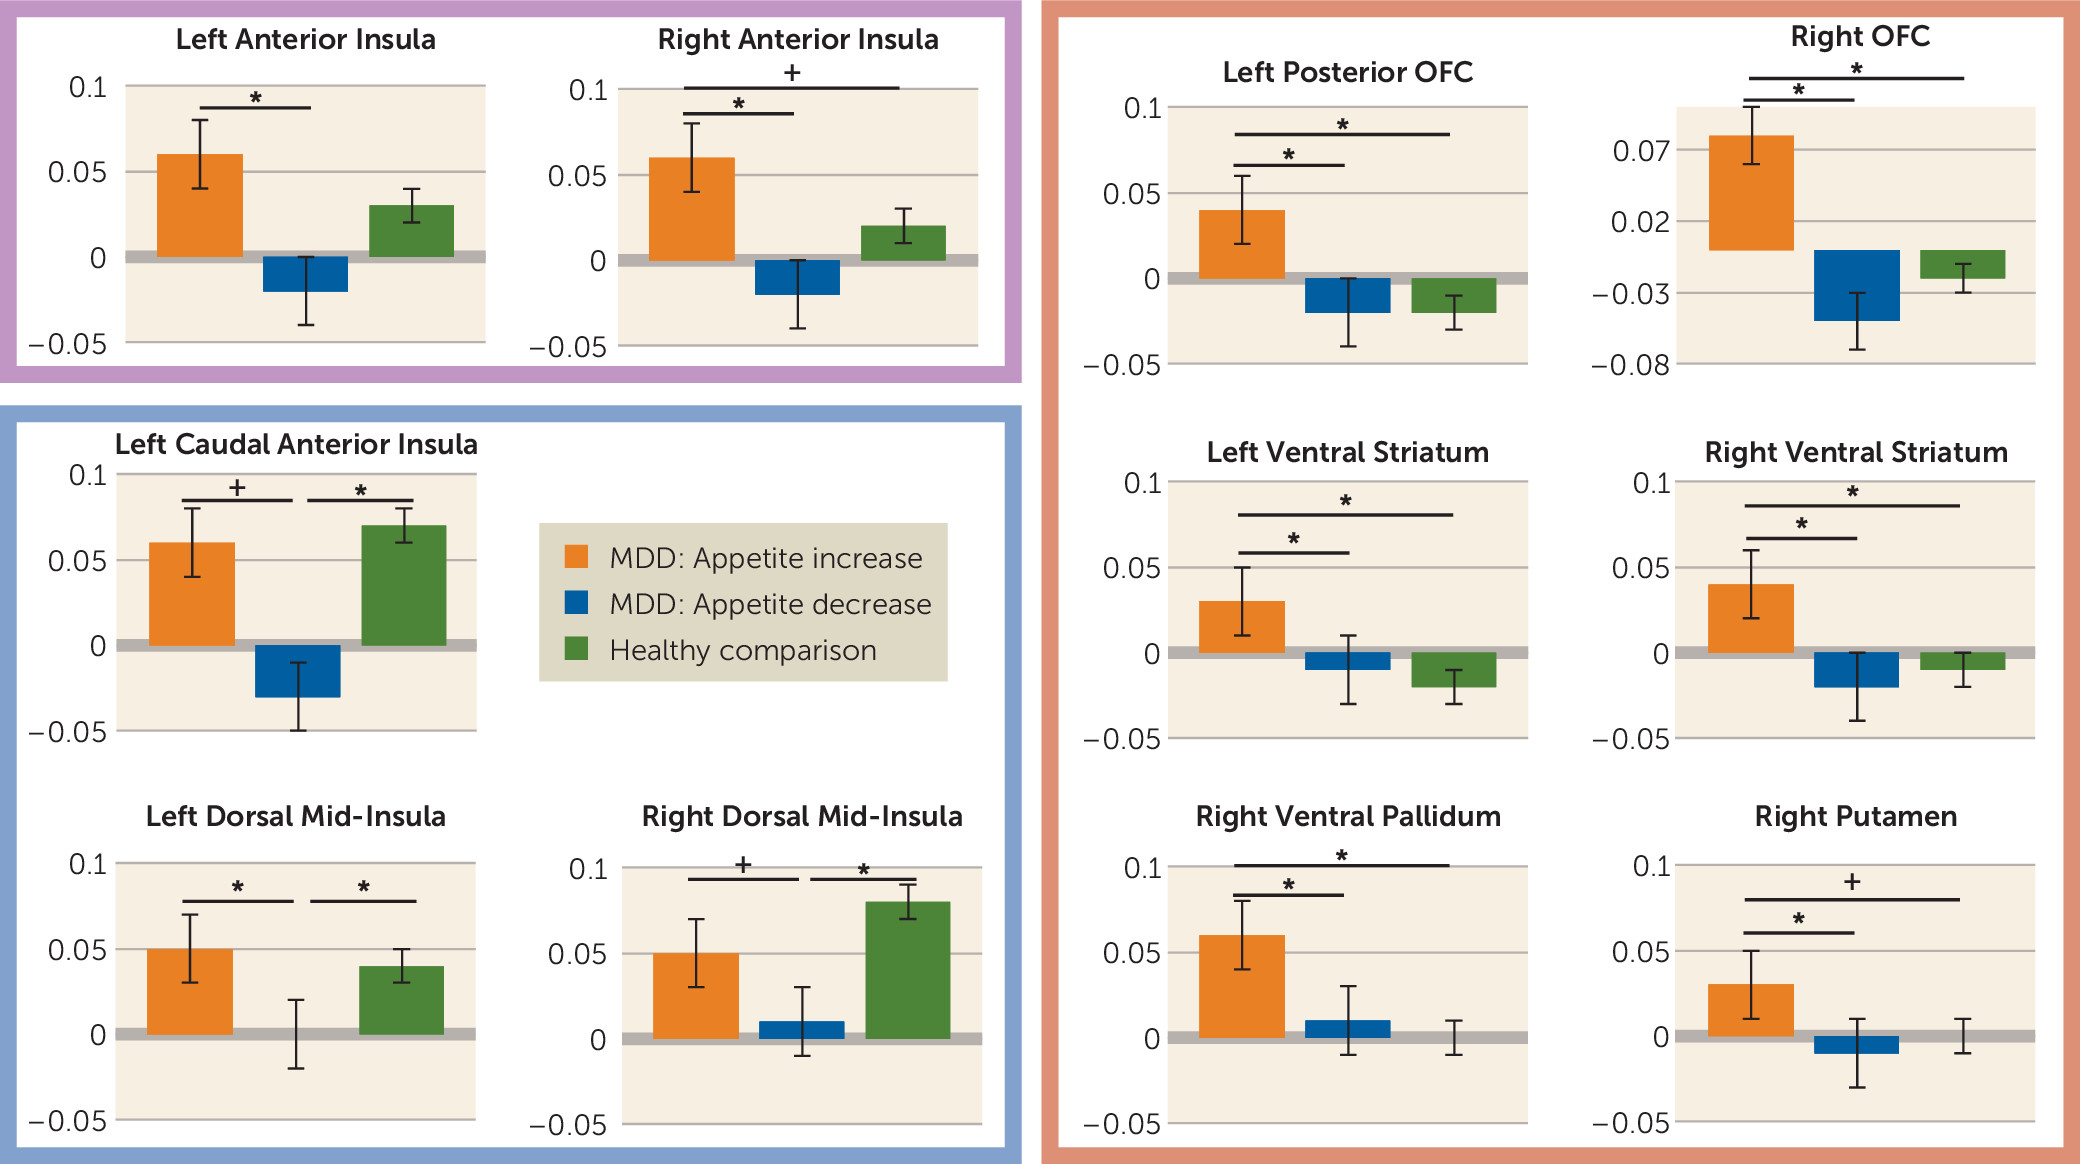
FIGURE 3. Bar Graphs Demonstrating Simple Effects Within the 11 Clusters Identified in the Between-Group Analysis of Variance (ANOVA)a
a The bar graphs show the mean response (beta value) and simple effects for each group within the clusters identified in the whole-brain ANOVA to assess for group differences in responses to food pictures. Three general patterns emerged from the data. Within canonical reward-related regions (graphs inside the orange box), depressed participants with increased appetites exhibited greater activity to food stimuli than both those reporting appetite decreases and healthy comparison subjects. In contrast, depression with appetite loss was associated with hypoactivation within a region of the mid-insula cortex previously implicated in interoceptive and homeostatic signaling (graphs inside the blue box). Activity in the anterior insula (graphs inside the purple box) exhibits a more graded response across the three groups. The y-axis of each graph displays the functional MRI percent signal change for food images relative to nonfood images. MDD=major depressive disorder; OFC=orbitofrontal cortex.
+p<0.04. *p<0.005.
Post hoc analyses of the simple effects underlying the main effects within the regions identified in the ANOVA revealed a dissociation in activity among depressed participants with appetite increases and decreases (Figure 3). Within all of the regions previously implicated in the mesocorticolimbic dopamine reward system, including the orbitofrontal cortex, ventral striatum, ventral pallidum, and putamen, depressed participants with increased appetites exhibited significantly greater activity than both those reporting appetite decreases and healthy control subjects (for effect sizes, see Table S5 in the data supplement). The activity within these regions did not differ between participants reporting depression-related appetite losses and healthy control subjects. In contrast, the depressed appetite-decrease group exhibited significantly lower BOLD responses in the caudal anterior and mid-insula regions compared with both healthy subjects and those reporting depression-related increases in appetite. This pattern appeared most prominent in the left mid-insula, where activity did not differ between healthy control subjects and depressed participants with increased appetites, and the activity of these two groups was greater than in those suffering from depression with appetite loss. In the left anterior insula, the depressed appetite-decrease group demonstrated significantly less activity than the depressed appetite-increase group, while no difference was observed between either depressed group and the healthy group. In the right anterior insula, the pattern across groups was qualitatively similar, but activity in the depressed appetite-increase group was significantly greater compared with both of the other groups.

Food Pleasantness Rating Task

Collapsing across all categories of food items, compared with the other two groups, depressed subjects with increased appetite inferred that visually perceived foods would be more pleasant to eat (p<0.02 in each comparison; also see Table S6 in the data supplement). However, the ratings provided by the healthy control and depressed subjects with appetite loss did not differ from each other (p>0.27). When separated by food type, depressed subjects with increased appetite provided higher inferred pleasantness ratings than both of the other groups for both high-fat high-sweet foods (p<0.03 in each comparison; see Tables S7 and S8 and Figure S3 in the data supplement) and high-fat low-sweet foods (p<0.005 in each comparison).
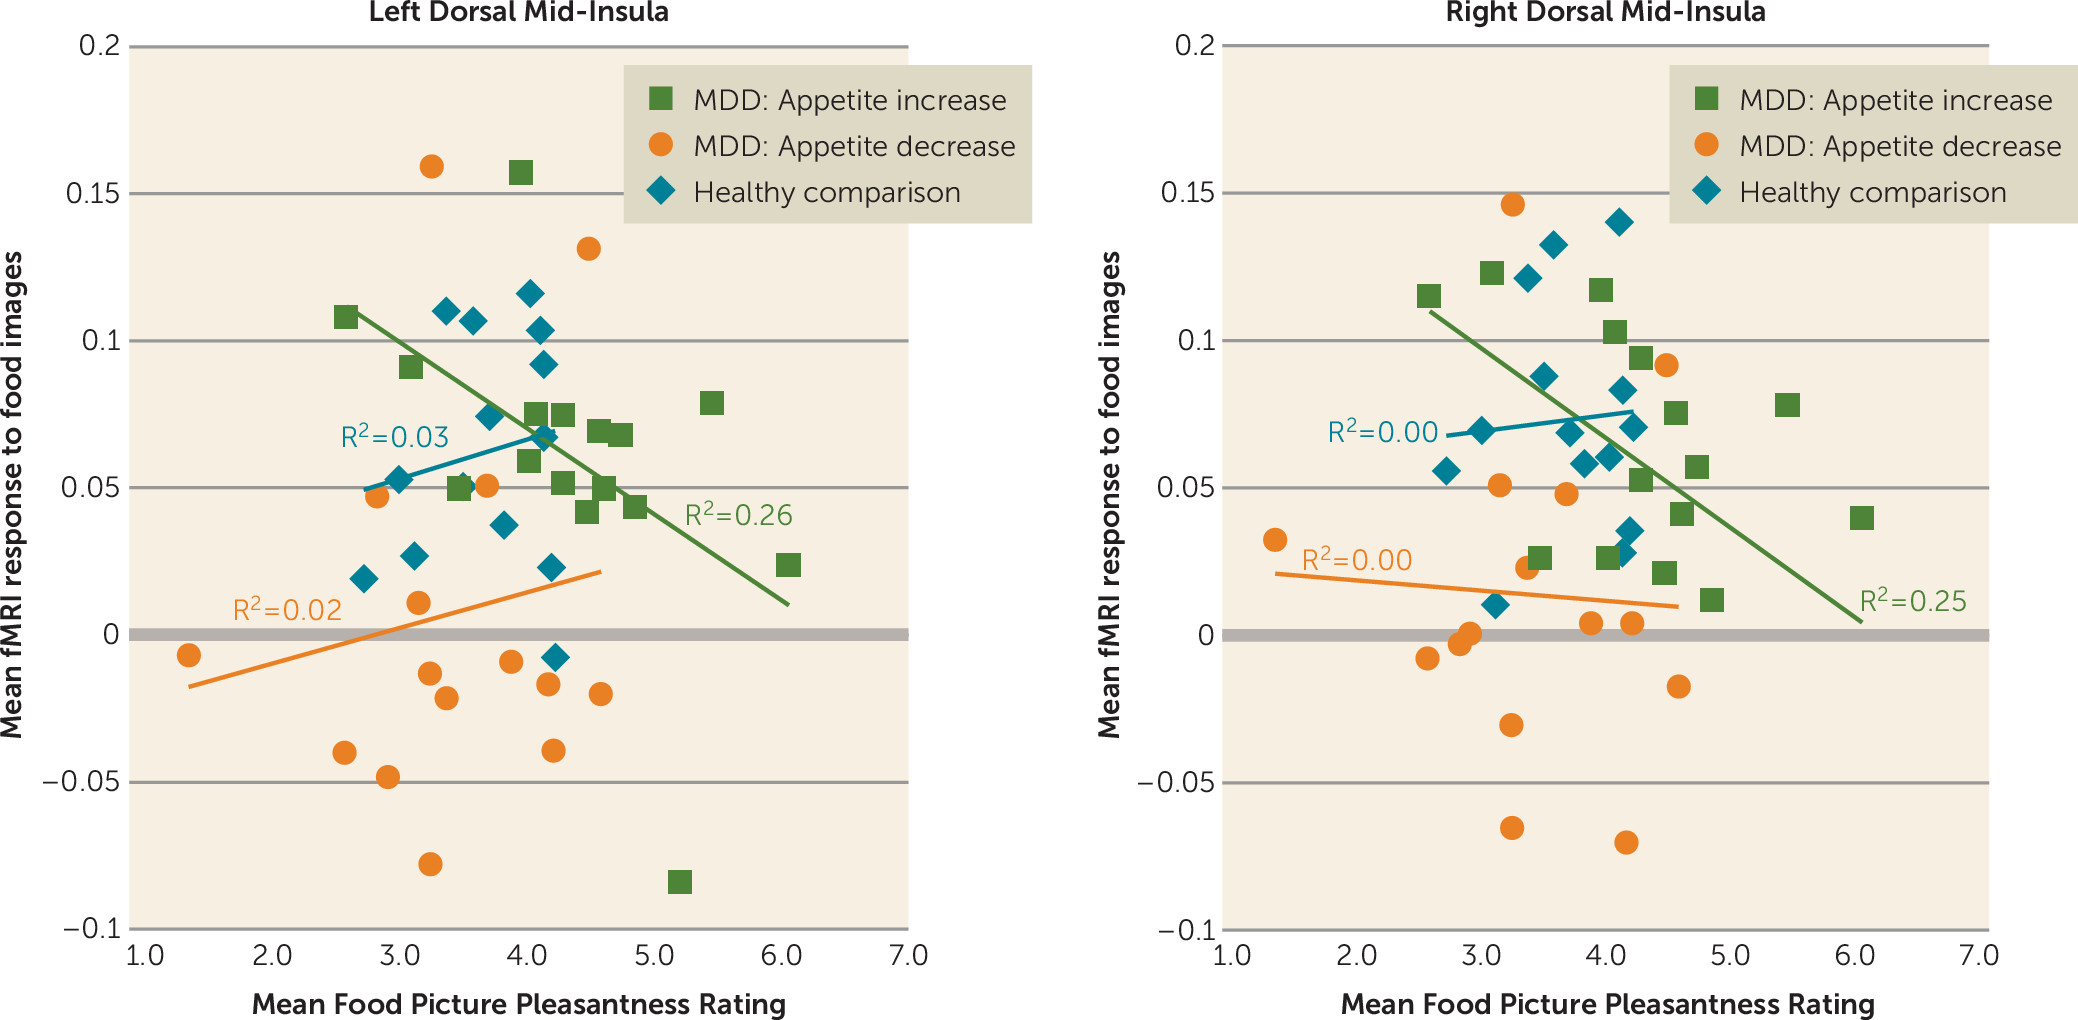
In examining the relationship between subjects’ average food pleasantness ratings and activity during the food/nonfood picture fMRI task within the seven regions of interest identified in the healthy subjects’ responses to food versus nonfood images, we observed negative correlations between the food pleasantness ratings of the depressed subjects with increased appetites and brain activity to food images in the left and right dorsal mid-insula (Figure 4). No significant relationship was observed in the other groups or regions.
FIGURE 4. Mid-Insula Activity and Food Pleasantness Ratingsa
a Depressed subjects with increased appetite exhibited a significant (p<0.05) negative correlation between how highly they rated the anticipated pleasantness of food pictures in the Food Pleasantness Rating Task and insula activity to food pictures (relative to nonfood pictures) during the food/nonfood picture task. MDD=major depressive disorder.
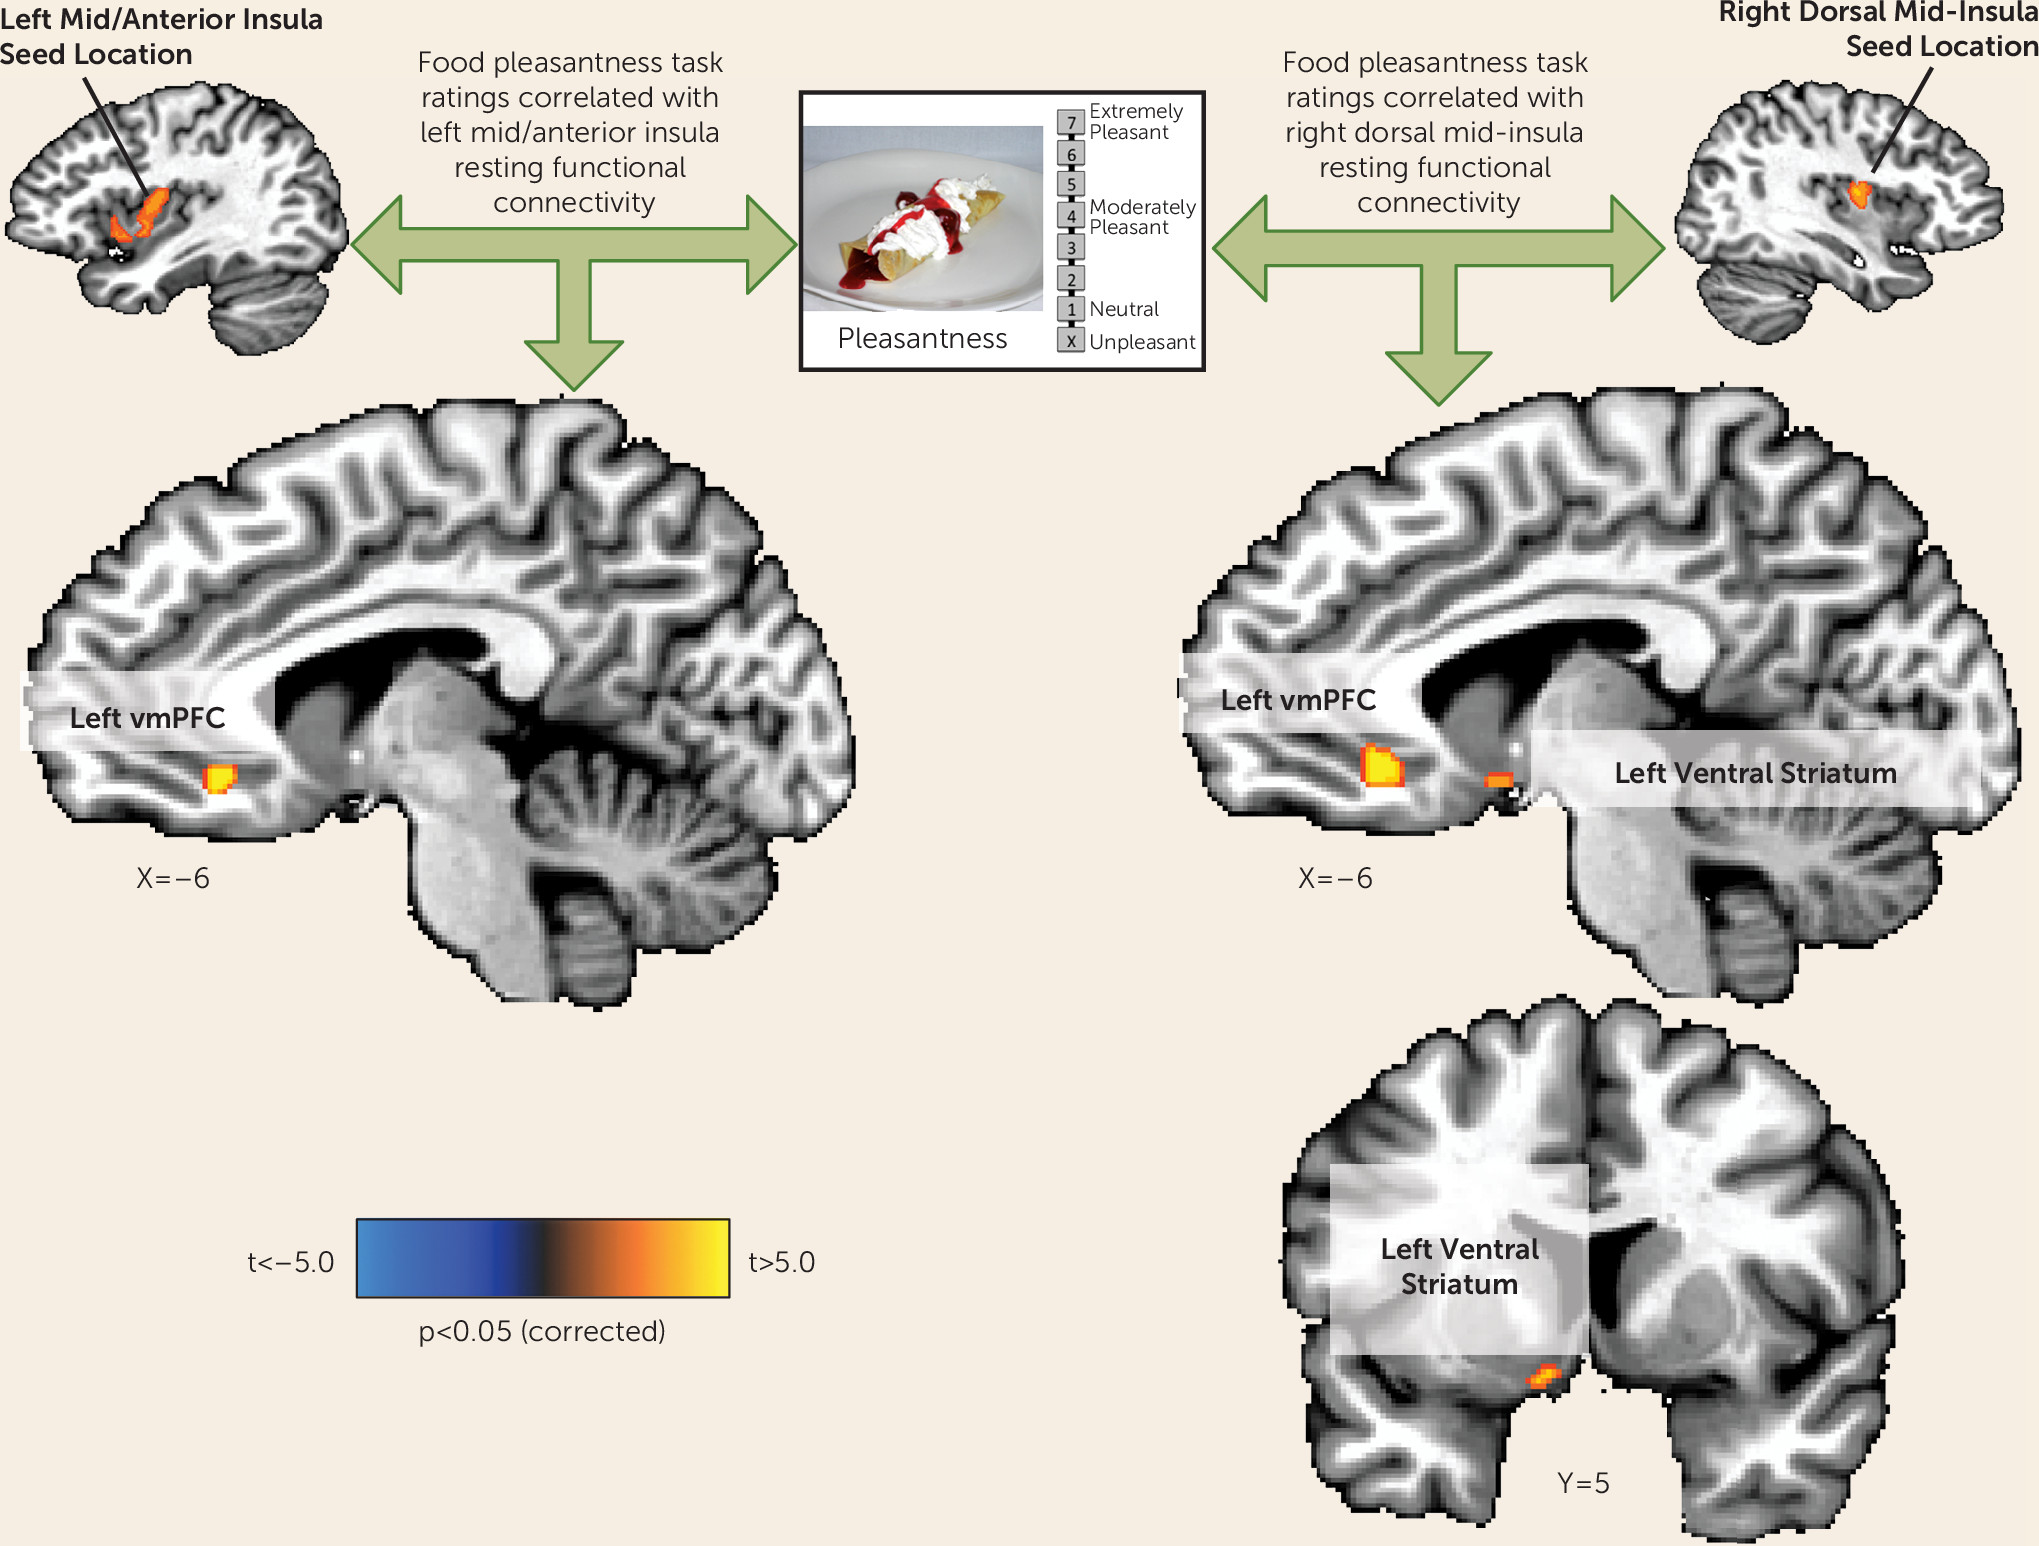
Finally, we examined the relationship between subjects’ food pleasantness inferences and the intrinsic resting-state functional connectivity of the seven normative food-responsive regions of interest. For both the right and left dorsal mid-insula seed regions, a significant positive correlation was observed between pleasantness ratings and functional connectivity to the left ventral medial prefrontal cortex (approximately BA 10) (Figure 5; also see Table S9 in the data supplement). Additionally, the left medial ventral striatum (in the region of the accumbens area) exhibited a significant positive correlation between pleasantness ratings and functional connectivity to the right dorsal mid-insula seed region. No other seed regions exhibited reliable correlations with any other brain regions.
FIGURE 5. Resting-State Functional Connectivity Between the Mid-Insula and Putative Reward Regions Correlated With Ratings of Anticipated Food Pleasantnessa
a Subjects’ anticipated food pleasantness ratings were positively correlated with the resting-state (intrinsic) functional connectivity between multiple regions within putative reward neurocircuitry and the left and right mid-insula region-of-interest seed region defined in the healthy control subjects. Both mid-insula seed regions exhibited greater activity in response to food than nonfood pictures in the healthy nondepressed subjects in the food/nonfood picture task and also exhibited a significant negative correlation between food picture activity and pleasantness ratings in the depressed appetite-increase group. vmPFC=ventromedial prefrontal cortex.

Discussion

The marked variability in the clinical course and symptomatology of depression suggests that this syndrome can arise from heterogeneous etiologies. This observation has motivated an expanding literature of studies using data-driven analytics to identify depression subtypes from behavioral symptom profiles (for example, see references 7, 8, 24). Nevertheless, there are presently few examples of differential neural responses among subgroups of depressed patients defined a priori by their behavioral symptoms (see references 20, 21). Depression-related increases and decreases in appetite and weight have long been codified as antipodal diagnostic markers in DSM (e.g., DSM-5). Yet while appetite changes have long been recognized as common diagnostic features of depression, and more recently as some of the most discriminating depressive symptoms in latent class analyses of depressive subtypes (68), there exist no data on differential brain activity among depressed subjects exhibiting increased versus decreased appetites. The present study thus investigated whether depression-related increases and decreases in appetite are associated with differential neural activity in response to food stimuli.
Within regions implicated in neurotypical responses to food stimuli (as defined by food-responsive regions mapped in healthy control subjects), the depressed appetite-increase group exhibited greater responses to food pictures than the depressed appetite-decrease group in the left orbitofrontal cortex and bilateral insula. In other areas, the depressed subjects with increased appetite also exhibited elevated activity compared with both healthy control subjects and depressed subjects with decreased appetite in the ventral striatum, putamen, ventral pallidum, and additional regions of the orbitofrontal cortex. Unexpectedly, we did not observe differences in hemodynamic activity between the depressed appetite-decrease and healthy control subjects in these regions. Rather, the depressed appetite-decrease group exhibited reduced activity relative to the depressed appetite-increase group in the bilateral anterior- and mid-insula. The most prominent effects were located bilaterally in the midinsula, where the depressed appetite-decrease group exhibited significantly less activity than both the depressed appetite-increase and healthy control groups, neither of which differed from each other.
Consistent with our findings of greater activity in the depressed appetite-increase group, the neuroscience literature demonstrates that the orbitofrontal cortex, ventral striatum, and ventral pallidum contribute to various facets of reward processing, including stimulus valuation, motivation, and hedonic experience (11, 15, 17, 25, 26). Each of these regions has been previously implicated both in appetitive responses to food stimuli and in the pathophysiology of depression. For example, a large human and nonhuman primate research literature demonstrates that the orbitofrontal cortex dynamically encodes the value of stimuli with respect to an individual’s homeostatic needs (for reviews, see references 25, 26). This can be seen both in monkey and human studies of stimulus-specific satiety, where orbitofrontal cortex activity is potentiated for stimuli that are novel and/or meet immediate homeostatic needs but declines as the stimulus is repeatedly presented and the physiological need is reduced (27). Recent human neuroimaging evidence demonstrates that the anterior orbitofrontal cortex may be particularly sensitive to secondary reinforcers, while the posterior orbitofrontal cortex may be specific to primary reinforcers (28). In the present study, photographs (secondary reinforcers) of food (a primary reinforcer) elicited hyperactivation in the depressed increased-appetite group in regions corresponding approximately to both BA 11 (anterior orbitofrontal cortex) and BA 13 (posterior orbitofrontal cortex). This suggests that the depressed increased-appetite subjects are excessively responsive to both food cues and food receipt, a possibility that warrants further research. Importantly, the orbitofrontal cortex has also often been implicated in major depressive disorder, since depressed patients exhibit abnormal orbitofrontal cortex volume and blood flow, and orbitofrontal cortex lesions increase the risk of developing depression (29, 30). These neuroanatomical and functional differences in depression may be associated with histological abnormalities, which have been demonstrated by postmortem neuropathology studies of the orbitofrontal cortex in depressed samples (31, 32). Likewise, both abnormal reward learning and anhedonia in depression are associated with attenuated activity and dopamine binding in the ventral striatum (18), a region known to underlie both food motivation (i.e., “wanting”) and hedonic perception (“liking”) (11). Finally, recent evidence from rodent electrophysiology and human neuroimaging demonstrates that the ventral pallidum is a key component in both the experience and anticipation of food hedonics (15) and is implicated in depression (33). (For a discussion of the relationship between findings in the present study and the subjects’ clinical ratings of anhedonia, see the online data supplement.)
The anterior insula exhibited a pattern in which the depressed group with increased appetite exhibited significantly greater activity to food pictures than the decreased-appetite group, while the hemodynamic response of the healthy group was intermediate between the two depressed groups (Figure 3). This pattern conceivably may reflect the anterior insula’s role as a center for integrating activity within reward and interoceptive circuitry. This account appears consistent with the anterior insula’s functional connectivity to multiple intrinsic networks in the brain, including reward and interoceptive regions (34). As such, the pattern of findings in the anterior insula is generally consistent with prior experimental evidence of altered anterior insula activity in depression. For example, both never-depressed adolescents at high familial risk of depression and currently remitted adults with a history of major depressive disorder exhibited weaker activity in the anterior insula and posterior orbitofrontal cortex to the sight and taste of chocolate (35, 36). Likewise, the anterior insula has emerged as a promising candidate for an imaging biomarker of treatment response in depression, with hypometabolism in this region associated with responsiveness to cognitive-behavioral therapy and hypermetabolism associated with responsiveness to pharmacotherapy using escitalopram (20, 21). In the present data set, we also find that activity in this region differentiates subgroups of depressed patients defined according to a behavioral phenotype (see the data supplement for a discussion of these findings in relation to the melancholic and atypical specifiers for major depressive disorder).
In contrast to both healthy control subjects and participants with depression-related increases in appetite, the subjects with depression-related appetite decreases exhibited abnormal activity in the interoceptive cortex. The most pronounced differences were observed bilaterally in the dorsal mid-insula, near the location thought to be the primary gustatory cortex in the human (37) and where vagal nerve afferent projections from the viscera first synapse in the cortex via connections in the brainstem and thalamus (38). The mid-insula has been repeatedly shown to play a role in interoception (i.e., a term referring broadly to the perception and integration of autonomic, humoral, and immune signals relating to the homeostatic state). Interestingly, the same region of the dorsal mid-insula observed here also exhibited homeostatically sensitive category-specific responses to food pictures in an earlier study (16). Specifically, this region exhibited strong responses to food pictures when circulating peripheral glucose levels were low but weak responses when glucose levels were high. This finding implicates the mid-insula both in interoception and in monitoring the body's homeostatic energy needs. These links to the normative function of the dorsal mid-insula, when taken together with the results observed here in depressed subjects with altered appetite, accord well with recent reports demonstrating that depression is associated with both altered interoceptive activity in the dorsal mid-insula and abnormal functional connectivity between this region and other regions implicated in the pathophysiology of depression (e.g., the amygdala) (39). Because most visceral interoceptive signals reach the brain via the vagus nerve, these findings also appear consistent with evidence for altered vagal function in depression and the efficacy of vagal nerve stimulation for treating major depressive disorder (40). The accumulating evidence that interoception is compromised in some depressed patients has led to recent theoretical accounts pointing to its role as a central contributor in depression and anxiety (41, 42). Future research is needed to examine endocrine and peripheral vagal function in depression with appetite loss, as well as to assess these subjects for altered interoceptive processing of homeostatic signals. This interoceptive region is also sensitive to oral somatosensation (43) and supports overlapping gustatory-interoceptive representations (44). Additionally, a similar pattern of activity across the groups was observed in the caudal anterior insula, near a region implicated in both taste representation and multimodal olfactory-taste integration (45, 46).
Importantly, activity of the dorsal mid-insula was not implicated only in depression with appetite loss. Compared with the other two groups, the depressed subjects with increased appetite inferred that foods depicted in photographs would be more pleasant to eat, and the activity of both the left and right dorsal mid-insula in response to food images in the depressed increased-appetite subjects was negatively correlated with these food pleasantness ratings (Figure 4). This negative association suggests the interesting possibility that interoceptive signals about the state of the body represented by increased activity of the mid-insula can act as a brake on food anticipation in those with overactive food reward signals (i.e., the depressed increased-appetite group in the present study).
The findings here suggest that if, due to insula pathology, interoceptive representations are aberrant, a depressed individual may not make appropriate interoceptive predictions about the homeostatic consequences of encountered stimuli (e.g., sight or taste of food), resulting in the selection of behaviors that do not maintain homeostatic balance (i.e., either increased or decreased eating). These accounts would thus predict that depression-related appetite loss results from a failure to integrate afferent visceral interoceptive signals about the state of the body with external food cues. Conversely, depression-related appetite increases may result from a dysregulation of the balance between increased reward circuit activity (also observed in the present study) and interoceptive inferences in the insula about the homeostatic consequences of perceived foods.
An implicit assumption in this reward-interoception dysregulation hypothesis is the idea that one or more brain regions integrates both reward and interoceptive information. Based on the findings of both the present study and prior research, the ventral medial prefrontal cortex would seem to be a good candidate. Both the left and right dorsal mid-insula seed regions exhibited functional connectivity to the ventral medial prefrontal cortex that was positively correlated with inferred food pleasantness. Thus, individuals with the strongest functional connectivity between the ventral medial prefrontal cortex and the mid-insula tended to report that foods depicted in photographs would be more pleasant to eat, suggesting that the integrated activity of the two regions influences food judgments. Additionally, the ventral medial prefrontal cortex region observed herein has strong anatomical connectivity to the ventral striatum (47) (which also exhibited right mid-insula functional connectivity that was correlated with pleasantness ratings) and has been implicated in the integration of hedonic and nonhedonic information in the computation of food value (48).
Some strengths and limitations of the study design merit comment. Although the sample sizes were relatively low, thereby decreasing the likelihood of detecting less robust group differences, the depressed groups were composed of unmedicated participants, and the depressed subgroups of interest did not differ on BMI, depression severity ratings, or anxiety ratings. Moreover, they did not differ on the Snaith-Hamilton Pleasure Scale once food-related items were removed, indicating that the depressed appetite-increase group was similarly anhedonic to the depressed appetite-decrease group (see the data supplement for results after controlling for depression severity, anxiety severity, and anhedonia). One limitation, however, was that the groups were defined based on self-reported appetite changes, without corroborating evidence of associated weight change. An important next step is to examine whether and how these appetite changes translate into altered eating behavior per se. Relatedly, based on the decreased-appetite depressed group’s average BMI and exclusion of subjects with unhealthily low BMI, these subjects were not malnourished in the sense of excessively low caloric intake, and thus the observed functional changes are unlikely to be accounted for by malnourishment. Nevertheless, in future research it will be important to determine whether appetite changes in depression alter the specific macro- and micronutrient content of depressed individuals’ diets. It will also be important in future studies to attempt to recruit moderately/severely depressed subjects who do not exhibit appetite changes and examine their neural response to food cues, relative to the other three groups described in the present study. Finally, it may also be important in future studies to determine whether the activations observed in gustatory/interoceptive insula cortex reported here might result from autonomic changes or gustatory recall associated with seeing the food stimuli.
Here, we report not only the first neuroimaging study, to our knowledge, to examine the responses of currently depressed subjects to food stimuli, but also the first to examine differential brain activity in those who report depression-related appetite increases versus decreases. Our findings demonstrate that food cues elicit potentiated activity in reward circuitry of individuals whose depression is associated with increased appetite. In contrast, food cues elicit attenuated activity in the interoceptive circuitry of individuals whose depression is associated with decreased appetite. These differences in brain activity to food cues may thus serve as novel phenotypic biomarkers of depression subgroups with distinct pathophysiologies and potentially illuminate the path toward new interventions targeting the development of depression-related obesity and its concomitant illnesses.
Acknowledgments

The authors thank Joel Barcalow, Jennifer Dobson, and Casey Mullins for their assistance with subject assessment and recruitment.

Supplementary Material

File (appi.ajp.2015.15020162.ds001.pdf)

References

1.
Vos T, Flaxman AD, Naghavi M, et al: Years lived with disability (YLDs) for 1160 sequelae of 289 diseases and injuries 1990-2010: a systematic analysis for the Global Burden of Disease Study 2010. Lancet 2012; 380:2163–2196
2.
Mykletun A, Bjerkeset O, Overland S, et al: Levels of anxiety and depression as predictors of mortality: the HUNT Study. Br J Psychiatry 2009; 195:118–125
3.
Chien IC, Wu EL, Lin CH, et al: Prevalence of diabetes in patients with major depressive disorder: a population-based study. Compr Psychiatry 2012; 53:569–575
4.
Luppino FS, de Wit LM, Bouvy PF, et al: Overweight, obesity, and depression: a systematic review and meta-analysis of longitudinal studies. Arch Gen Psychiatry 2010; 67:220–229
5.
Maxwell MA, Cole DA: Weight change and appetite disturbance as symptoms of adolescent depression: toward an integrative biopsychosocial model. Clin Psychol Rev 2009; 29:260–273
6.
Li Y, Aggen S, Shi S, et al: Subtypes of major depression: latent class analysis in depressed Han Chinese women. Psychol Med 2014; 44:3275–3288
7.
Sullivan PF, Kessler RC, Kendler KS: Latent class analysis of lifetime depressive symptoms in the National Comorbidity Survey. Am J Psychiatry 1998; 155:1398–1406
8.
Sullivan PF, Prescott CA, Kendler KS: The subtypes of major depression in a twin registry. J Affect Disord 2002; 68:273–284
9.
Nierenberg AA, Pava JA, Clancy K, et al: Are neurovegetative symptoms stable in relapsing or recurrent atypical depressive episodes? Biol Psychiatry 1996; 40:691–696
10.
Stunkard AJ, Fernstrom MH, Price A, et al: Direction of weight change in recurrent depression: consistency across episodes. Arch Gen Psychiatry 1990; 47:857–860
11.
Berridge KC: “Liking” and “wanting” food rewards: brain substrates and roles in eating disorders. Physiol Behav 2009; 97:537–550
12.
Martin LE, Holsen LM, Chambers RJ, et al: Neural mechanisms associated with food motivation in obese and healthy weight adults. Obesity (Silver Spring) 2010; 18:254–260
13.
Siep N, Roefs A, Roebroeck A, et al: Hunger is the best spice: an fMRI study of the effects of attention, hunger and calorie content on food reward processing in the amygdala and orbitofrontal cortex. Behav Brain Res 2009; 198:149–158
14.
Simmons WK, Martin A, Barsalou LW: Pictures of appetizing foods activate gustatory cortices for taste and reward. Cereb Cortex 2005; 15:1602–1608
15.
Simmons WK, Rapuano KM, Ingeholm JE, et al: The ventral pallidum and orbitofrontal cortex support food pleasantness inferences. Brain Struct Funct 2014; 219:473–483
16.
Simmons WK, Rapuano KM, Kallman SJ, et al: Category-specific integration of homeostatic signals in caudal but not rostral human insula. Nat Neurosci 2013; 16:1551–1552
17.
Zald DH: Orbitofrontal cortex contributions to food selection and decision making. Ann Behav Med 2009; 38(suppl 1):S18–S24
18.
Drevets WC, Price JL, Furey ML: Brain structural and functional abnormalities in mood disorders: implications for neurocircuitry models of depression. Brain Struct Funct 2008; 213:93–118
19.
Price JL, Drevets WC: Neurocircuitry of mood disorders. Neuropsychopharmacology 2010; 35:192–216
20.
McGrath CL, Kelley ME, Dunlop BW, et al: Pretreatment brain states identify likely nonresponse to standard treatments for depression. Biol Psychiatry 2014; 76:527–535
21.
McGrath CL, Kelley ME, Holtzheimer PE, et al: Toward a neuroimaging treatment selection biomarker for major depressive disorder. JAMA Psychiatry 2013; 70:821–829
22.
van der Laan LN, de Ridder DT, Viergever MA, et al: The first taste is always with the eyes: a meta-analysis on the neural correlates of processing visual food cues. Neuroimage 2011; 55:296–303
23.
Ongür D, Ferry AT, Price JL: Architectonic subdivision of the human orbital and medial prefrontal cortex. J Comp Neurol 2003; 460:425–449
24.
Lamers F, de Jonge P, Nolen WA, et al: Identifying depressive subtypes in a large cohort study: results from the Netherlands Study of Depression and Anxiety (NESDA). J Clin Psychiatry 2010; 71:1582–1589
25.
Kringelbach ML: The human orbitofrontal cortex: linking reward to hedonic experience. Nat Rev Neurosci 2005; 6:691–702
26.
Rudebeck PH, Murray EA: The orbitofrontal oracle: cortical mechanisms for the prediction and evaluation of specific behavioral outcomes. Neuron 2014; 84:1143–1156
27.
Rolls ET: Brain mechanisms underlying flavour and appetite. Philos Trans R Soc Lond B Biol Sci 2006; 361:1123–1136
28.
Klein-Flügge MC, Barron HC, Brodersen KH, et al: Segregated encoding of reward-identity and stimulus-reward associations in human orbitofrontal cortex. J Neurosci 2013; 33:3202–3211
29.
Drevets WC: Orbitofrontal cortex function and structure in depression. Ann N Y Acad Sci 2007; 1121:499–527
30.
Murray EA, Wise SP, Drevets WC: Localization of dysfunction in major depressive disorder: prefrontal cortex and amygdala. Biol Psychiatry 2011; 69:e43–e54
31.
Rajkowska G, Stockmeier CA: Astrocyte pathology in major depressive disorder: insights from human postmortem brain tissue. Curr Drug Targets 2013; 14:1225–1236
32.
Rajkowska G, Miguel-Hidalgo JJ, Wei J, et al: Morphometric evidence for neuronal and glial prefrontal cell pathology in major depression. Biol Psychiatry 1999; 45:1085–1098
33.
Murrough JW, Henry S, Hu J, et al: Reduced ventral striatal/ventral pallidal serotonin1B receptor binding potential in major depressive disorder. Psychopharmacology (Berl) 2011; 213:547–553
34.
Simmons WK, Avery JA, Barcalow JC, et al: Keeping the body in mind: insula functional organization and functional connectivity integrate interoceptive, exteroceptive, and emotional awareness. Hum Brain Mapp 2013; 34:2944–2958
35.
McCabe C, Woffindale C, Harmer CJ, et al: Neural processing of reward and punishment in young people at increased familial risk of depression. Biol Psychiatry 2012; 72:588–594
36.
Simmons WK, Drevets WCA: A “taste” of what is to come: reward sensitivity as a potential endophenotype for major depressive disorder. Biol Psychiatry 2012; 72:526–527
37.
Small DM: Taste representation in the human insula. Brain Struct Funct 2010; 214:551–561
38.
Craig AD: How do you feel? Interoception: the sense of the physiological condition of the body. Nat Rev Neurosci 2002; 3:655–666
39.
Avery JA, Drevets WC, Moseman SE, et al: Major depressive disorder is associated with abnormal interoceptive activity and functional connectivity in the insula. Biol Psychiatry 2014; 76:258–266
40.
Nemeroff CB, Mayberg HS, Krahl SE, et al: VNS therapy in treatment-resistant depression: clinical evidence and putative neurobiological mechanisms. Neuropsychopharmacology 2006; 31:1345–1355
41.
Paulus MP, Stein MB: Interoception in anxiety and depression. Brain Struct Funct 2010; 214:451–463
42.
Barrett LF, Simmons WK. Interoceptive predictions in the brain. Nat Rev Neurosci 2015; 16:419–429
43.
De Araujo IE, Rolls ET: Representation in the human brain of food texture and oral fat. J Neurosci 2004; 24:3086–3093
44.
Avery JA, Kerr KL, Ingeholm JE, et al: A common gustatory and interoceptive representation in the human mid-insula. Hum Brain Mapp 2015; 36:2996–3006
45.
de Araujo IE, Kringelbach ML, Rolls ET, et al: Representation of umami taste in the human brain. J Neurophysiol 2003; 90:313–319
46.
de Araujo IE, Rolls ET, Kringelbach ML, et al: Taste-olfactory convergence, and the representation of the pleasantness of flavour, in the human brain. Eur J Neurosci 2003; 18:2059–2068
47.
Haber SN, Kim KS, Mailly P, et al: Reward-related cortical inputs define a large striatal region in primates that interface with associative cortical connections, providing a substrate for incentive-based learning. J Neurosci 2006; 26:8368–8376
48.
Hare TA, Camerer CF, Rangel A: Self-control in decision-making involves modulation of the vmPFC valuation system. Science 2009; 324:646–648

Information & Authors

Information

Published In

Go to American Journal of Psychiatry
American Journal of Psychiatry
Pages: 418 - 428
PubMed: 26806872

History

Received: 4 February 2015
Revision received: 21 July 2015
Accepted: 21 September 2015
Published online: 22 January 2016
Published in print: April 01, 2016

Authors

Details

W. Kyle Simmons, Ph.D.
From the Laureate Institute for Brain Research, Tulsa, Okla.; the Faculty of Community Medicine, The University of Tulsa, Tulsa, Okla.; the Department of Psychology, The University of Tulsa, Tulsa, Okla.; the College of Engineering, The University of Oklahoma, Tulsa, Okla.; the Center for Health Behavior Neuroscience, Kansas University Medical Center, Kansas City, Kans.; and Janssen Pharmaceuticals, LLC., of Johnson & Johnson, Inc., Titusville, N.J.
Kaiping Burrows, Ph.D.
From the Laureate Institute for Brain Research, Tulsa, Okla.; the Faculty of Community Medicine, The University of Tulsa, Tulsa, Okla.; the Department of Psychology, The University of Tulsa, Tulsa, Okla.; the College of Engineering, The University of Oklahoma, Tulsa, Okla.; the Center for Health Behavior Neuroscience, Kansas University Medical Center, Kansas City, Kans.; and Janssen Pharmaceuticals, LLC., of Johnson & Johnson, Inc., Titusville, N.J.
Jason A. Avery, Ph.D.
From the Laureate Institute for Brain Research, Tulsa, Okla.; the Faculty of Community Medicine, The University of Tulsa, Tulsa, Okla.; the Department of Psychology, The University of Tulsa, Tulsa, Okla.; the College of Engineering, The University of Oklahoma, Tulsa, Okla.; the Center for Health Behavior Neuroscience, Kansas University Medical Center, Kansas City, Kans.; and Janssen Pharmaceuticals, LLC., of Johnson & Johnson, Inc., Titusville, N.J.
Kara L. Kerr, M.A.
From the Laureate Institute for Brain Research, Tulsa, Okla.; the Faculty of Community Medicine, The University of Tulsa, Tulsa, Okla.; the Department of Psychology, The University of Tulsa, Tulsa, Okla.; the College of Engineering, The University of Oklahoma, Tulsa, Okla.; the Center for Health Behavior Neuroscience, Kansas University Medical Center, Kansas City, Kans.; and Janssen Pharmaceuticals, LLC., of Johnson & Johnson, Inc., Titusville, N.J.
Jerzy Bodurka, Ph.D.
From the Laureate Institute for Brain Research, Tulsa, Okla.; the Faculty of Community Medicine, The University of Tulsa, Tulsa, Okla.; the Department of Psychology, The University of Tulsa, Tulsa, Okla.; the College of Engineering, The University of Oklahoma, Tulsa, Okla.; the Center for Health Behavior Neuroscience, Kansas University Medical Center, Kansas City, Kans.; and Janssen Pharmaceuticals, LLC., of Johnson & Johnson, Inc., Titusville, N.J.
Cary R. Savage, Ph.D.
From the Laureate Institute for Brain Research, Tulsa, Okla.; the Faculty of Community Medicine, The University of Tulsa, Tulsa, Okla.; the Department of Psychology, The University of Tulsa, Tulsa, Okla.; the College of Engineering, The University of Oklahoma, Tulsa, Okla.; the Center for Health Behavior Neuroscience, Kansas University Medical Center, Kansas City, Kans.; and Janssen Pharmaceuticals, LLC., of Johnson & Johnson, Inc., Titusville, N.J.
Wayne C. Drevets, M.D.
From the Laureate Institute for Brain Research, Tulsa, Okla.; the Faculty of Community Medicine, The University of Tulsa, Tulsa, Okla.; the Department of Psychology, The University of Tulsa, Tulsa, Okla.; the College of Engineering, The University of Oklahoma, Tulsa, Okla.; the Center for Health Behavior Neuroscience, Kansas University Medical Center, Kansas City, Kans.; and Janssen Pharmaceuticals, LLC., of Johnson & Johnson, Inc., Titusville, N.J.

Notes

Previously presented in part at the 2014 Meeting of the American College of Neuropsychopharmacology, Dec. 8, 2014, Phoenix.
Address correspondence to Dr. Simmons ([email protected]).

Competing Interests

Dr. Simmons has served as a consultant to Zafgen on a pharmaco-imaging study unrelated to this study. Dr. Drevets is employed by Janssen Research & Development, of Johnson & Johnson, and is a shareholder with Johnson & Johnson. All other authors report no financial relationships with commercial interests.

Funding Information

Health Research Board10.13039/501100001590: HPF/2010/17, TRA/2007/5, TRA/2007/5/R
Supported by the National Institute of Mental Health (grant K01MH096175-01; to Dr. Simmons), two NARSAD Young Investigator Awards (to Dr. Simmons), and two grants from the Oklahoma Tobacco Research Center (to Dr. Simmons).

Metrics & Citations

Metrics

Citations

Export Citations

If you have the appropriate software installed, you can download article citation data to the citation manager of your choice. Simply select your manager software from the list below and click Download.

For more information or tips please see 'Downloading to a citation manager' in the Help menu.

Format
Citation style
Style
Copy to clipboard

View Options

View options

PDF/EPUB

View PDF/EPUB

Login options

Already a subscriber? Access your subscription through your login credentials or your institution for full access to this article.

Personal login Institutional Login Open Athens login
Purchase Options

Purchase this article to access the full text.

PPV Articles - American Journal of Psychiatry

PPV Articles - American Journal of Psychiatry

Not a subscriber?

Subscribe Now / Learn More

PsychiatryOnline subscription options offer access to the DSM-5-TR® library, books, journals, CME, and patient resources. This all-in-one virtual library provides psychiatrists and mental health professionals with key resources for diagnosis, treatment, research, and professional development.

Need more help? PsychiatryOnline Customer Service may be reached by emailing [email protected] or by calling 800-368-5777 (in the U.S.) or 703-907-7322 (outside the U.S.).

Media

Figures

Other

Tables

Share

Share

Share article link

Share