Major depressive disorder is characterized by affective, cognitive, and vegetative symptoms. These interfere with a person’s ability to work, sleep, eat, and enjoy once pleasurable activities. Major depressive disorder thus critically impairs tasks in every-day life. Given its high prevalence, it also represents one of the biggest health challenges and will probably be one of the worldwide leading causes of disability and burden by 2020 (
1).
It has frequently been proposed that the human frontal pole, coinciding with Brodmann’s area (BA) 10 (
2), may subserve an integratory role for higher-order social, emotional, and cognitive processes (
3,
4). The frontal pole seems to contribute to behavioral disturbances in depression related to introspective evaluation (
5), self-relevant reflection (
6), and rumination occurrence (
7). Corroborating the functional considerations, which implicate a close relationship to depression-related behavioral disturbances, there are reports about structural alterations of the human frontal pole in major depressive disorder. Consistently, variations in the neurophysiological metabolism of receptors with significance to depression, particularly pronounced in the serotoninergic system, have already been described for the human frontal pole (
8–
10). There is moreover evidence for morphological alterations in depression, such as reduced gray matter volume, within the prefrontal cortex, putatively including BA 10 (
11–
13). A recent deep brain stimulation study with patients with treatment-resistant depression showed a response to the treatment only in those patients in which the activation volumes affected the uncinate fasciculus (
14). Since it is the frontal pole that represents the termination of this fiber bundle, possible structural changes within that part of the cortex may represent an important pathophysiological aspect of major depressive disorder.
To date, however, depression research has dedicated much attention to the anterior cingulate and orbitofrontal cortices (i.e., regions neighboring the frontal pole). Given broad consensus within the field that the pathology of depression relates to a larger dysfunctional network, this calls for extension to other potentially affected nodes (i.e., regions with evidence for affection, such as the frontal pole).
Importantly, the functional organization of the frontal pole and surrounding regions still remains under-researched. The nomenclature in this part of the brain is inconsistent, and vague labels such as “anterior prefrontal cortex” are frequently applied in a nonquantitative fashion. Recent histological examination demonstrated the presence of two distinct cytoarchitectonic areas in the human frontal pole: area frontopolaris 1 (Fp1, lateral) and area frontopolaris 2 (Fp2, medial) (
15). These are clearly distinct in function and connectivity (
3,
4,
15). The medial frontal pole (area Fp2) plays a central role in limbic processes such as emotional and social cognition (
16–
19). The lateral frontal pole (area Fp1), in turn, is related to cognitive functions such as working memory and perception (
3,
4,
15). This raises the questions whether the frontal pole is altered in major depressive disorder as well as whether any of these two structurally and functionally distinct regions are differentially affected by this disorder.
To test this, we combined volumetric analysis of structural MRI data with cytoarchitectonic maps of the human frontal pole and statistical learning algorithms. In a multicenter setting, we included 73 depressed patients and 73 well-matched healthy comparison subjects. In a univariate approach, region-based volumetric analysis was based on the microstructural maps of Fp1 and Fp2 in standard space (
15) as a reliable neuroanatomical prior. In a multivariate statistical approach, we then tested whether, and where, a searchlight analysis covering the combined extent of areas Fp1 and Fp2 can locate morphological patterns that allow for classification of a previously unseen subject as patient or control. The combination of these approaches thus provides a comprehensive assessment of the involvement of the cytoarchitectonically defined areas Fp1 and Fp2 in major depressive disorder.
Method
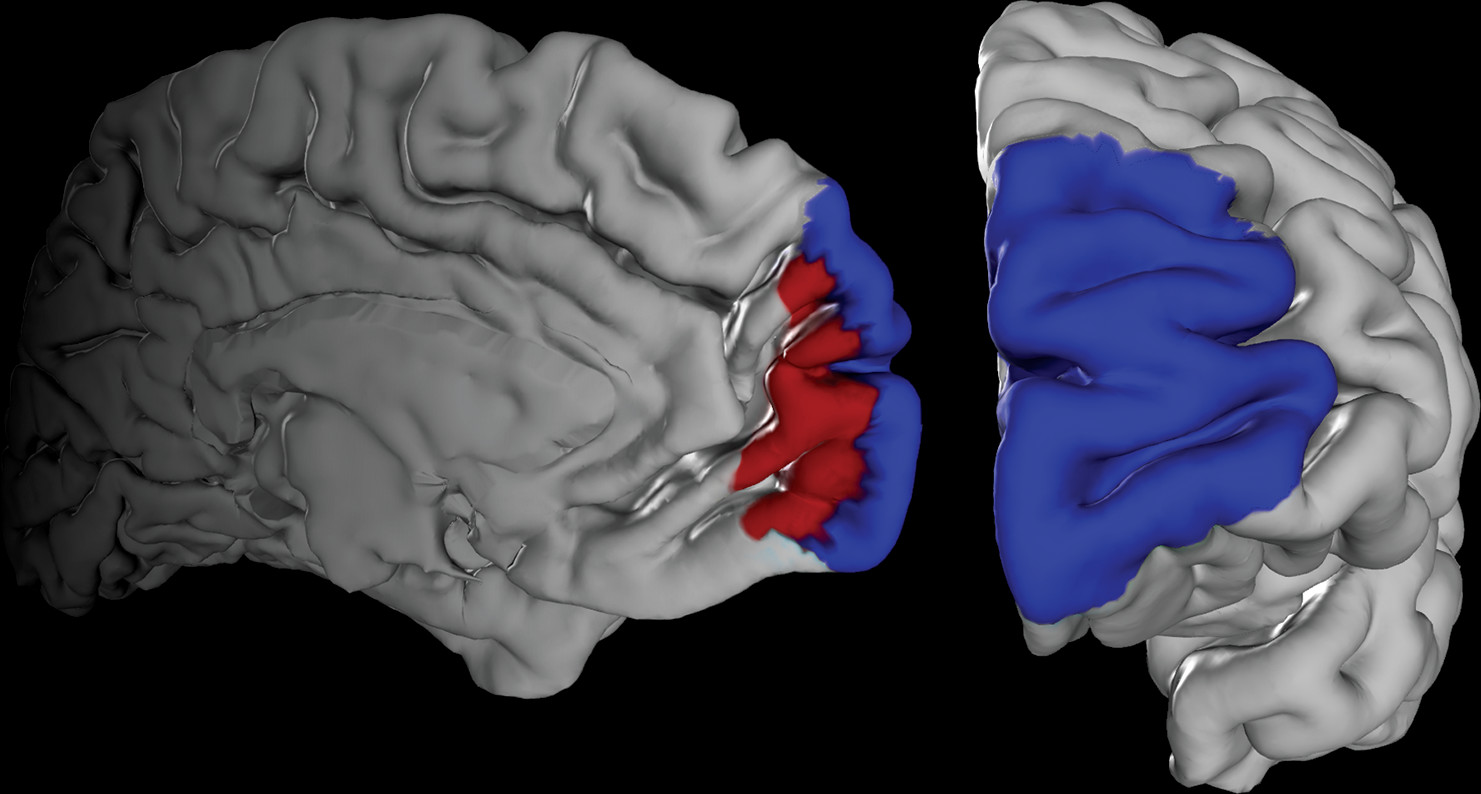
Our volume of interest was derived from a recent cytoarchitectonic mapping of the human frontal pole in 10 human postmortem brains (
15), which yielded the areas Fp1 and Fp2 (
Figure 1) as new parts of the JuBrain atlas (
20,
21).
Participants
Patients with major depression were recruited from the university clinics in Aachen, Göttingen and Munich, Germany. For all patients, diagnosis was based on clinical examination by the attending psychiatrist in accordance with the ICD-10 supplemented by the Beck Depression Inventory (BDI) as a self-reported measure of symptom severity. Comparison participants were recruited in the respective local communities. All subjects gave written consent to participate in the study as approved by the local ethics committees. Data pooling and joint analysis were approved by the ethics committee of the Heinrich-Heine University of Düsseldorf. In total, 73 patients in a current depressive episode and 73 healthy comparison subjects were included in the present study (
Table 1). In the patient group, current substance abuse was not an exclusion criterion but was specifically recorded. Sixteen patients were classified as suffering from substance abuse disorders (3 patients F10.1, 2 patients F12.1, 11 patients F17.1 according to the ICD-10). Importantly, patients and comparison subjects were not only matched at the (overall) group level but also on a site level. That is, each site not only investigated an equal number of patients and comparison subjects, but also within each site patients and comparison subjects were matched with respect to age and gender to avoid potential confounding influences (
Table 1). Among the patients, 44 had previous episodes and were hence classified as suffering from “recurrent depressive disorder” (F33 according to the ICD-10). For four patients, there was no information available about their current medication. Two patients received no medication at all, and one received lithium. The remaining patients received their regular medication as prescribed by the attending psychiatrist. While most were prescribed selective serotonin reuptake inhibitors or selective serotonin norepinephrine reuptake inhibitors, there was a considerable variability in the administered drugs, and combination therapies were frequently used. We thus did not perform subanalyses between patients with different medication regimens but rather regarded differences in medication and their potential effects on brain structure as a nonsystematic source of variance in the patient group. We note that variability introduced by heterogeneous medication should make it harder for the statistical analysis to identify consistent differences between patients and comparison subjects (due to increased variance in the patient group). Therefore, our analysis represents a more conservative approach to identifying structural aberrations in depression than a setting of homogeneous medication. In addition, this more natural setting in combination with the multisite approach should better reflect the overall population of patients with major depressive disorder.
All healthy comparison subjects were free of any current or past neurological or psychiatric disorder or substance abuse disorder and psychotropic medication.
Preprocessing: Voxel-Based Morphometry
Whole-brain T
1-weighted structural MRI scans were acquired for all participants on 3.0-T scanners at the respective sites. Similar acquisition protocols and a common voxel resolution of 1×1×1 mm
3 were used at all sites (
Table 2). Subsequently, all scans were jointly processed with the same pipeline using the VBM 8.0 toolbox (
http://dbm.neuro.uni-jena.de/vbm.html). Here we used the standard setting for all steps, including bias-field correction, segmentation into gray and white matter and cerebrospinal fluid, adjustment for partial volume effects, spatial normalization into Montreal Neurological Institute space, and nonlinear modulation (
22). Because we used nonlinearly modulated gray matter maps for further analysis, the voxel values of the ensuing gray matter volume maps reflect the local volume of gray matter (i.e., the absolute amount of tissue corrected for individual brain sizes). Consequently, we did not include total brain volume as an additional covariate in any of the subsequent analyses, since interindividual differences in brain volume were directly accounted for in the preprocessing.
Univariate Morphometric Comparison
For this analysis, the four cytoarchitectonically defined volumes of interest in standard space were used as individual regions of interest. First, for each subject, voxel-wise gray matter volume values were summed up across all voxels of each of the four histological masks (representing Fp1 and Fp2, separately for each hemisphere). This yielded the volume for each of these areas in every subject (corrected for total brain size, as we used nonlinearly modulated images). No additional smoothing was performed because we aimed at integrating over histologically defined areas rather than to replace each voxel with a weighted mean of its surrounding voxels. Prior to statistical comparison, we removed variance in the data attributable to between-site differences. This was done by first regressing out the variance from the confounding factor “site” and using the ensuing residuals for all subsequent analyses. That is, in addition to a close matching between patients and comparison subjects within each site, effects that could be explained by the measurement site were removed from the data. Volume differences between the two groups were then assessed for each of the four volumes of interest by a nonparametric label-exchange procedure using Monte-Carlo simulations (p<0.05, false discovery rate corrected for multiple comparisons). In a subsequent step, we tested for an association between the volumes of the areas and the severity of symptoms in the patient group as reflected in the BDI summary score, the number of previous episodes, and disease duration using rank correlations.
Multivariate Morphometric Comparison
Besides the “classical” univariate analysis, the gray matter volume maps of the entire frontal pole (i.e., Fp1 and Fp2) were fed into a multivariate pattern classification analysis (
23) using linear support vector machines (
24). Prior to this classification, we preprocessed the gray matter volume map by scaling and mean-centering (across the entire sample) for each voxel. We then used support vector machines in a fourfold cross-validation framework. In particular, a linear statistical function was first learned on the training data and subsequently applied to previously unseen test data. Note that structural data from each participant has thus been in the test data only once. This framework is the gold standard to obtain an unbiased estimate of a trained classifier to generalize beyond the subject sample at hand (
25).
To apply this procedure in regional neighborhoods, we performed a searchlight analysis (
26). For each voxel in the frontal pole mask provided by the combined maps of Fp1 and Fp2, we first collected the (preprocessed) gray matter volume values of the immediate neighborhood (radius: 2 to 7 voxels). In each such searchlight, we shrunk the voxel pool to the most varying 33% using an F test (
27). We then trained a linear support vector machine per voxel in one part of the voxel-based morphometry images (training set) and subsequently determined the prediction accuracy in the remaining images (test set). Finally, the mean classification accuracy across all permutation folds was mapped to the center of the sphere. We moved the searchlight through the volumes of interest until each seed voxel had once been the center of voxel of the searchlight. This yielded a voxel-wise classification accuracy map for the entire frontal pole. Regarding its software implementation, the multivariate searchlight analysis was performed using nilearn, a scientific computing Python package for machine learning in neuroimaging data sets. (It is freely accessible online [
http://github.com/nilearn/nilearn]).
This type of map of the frontal pole (defined by the combined maps for Fp1 and Fp2) thus identifies the locations where the morphological patterns are most discriminative between depressed patients and comparison subjects. The resulting accuracy maps were transformed into p value maps using the binomial test and corrected for multiple comparisons using Bonferroni's method. As a post hoc analysis, we then tested the hypothesis that the significantly discriminative voxels correspond to the distinct cytoarchitectonic areas Fp1 and Fp2 by anatomical assignment using the SPM Anatomy toolbox (
28).
Results
Univariate Morphometric Comparison
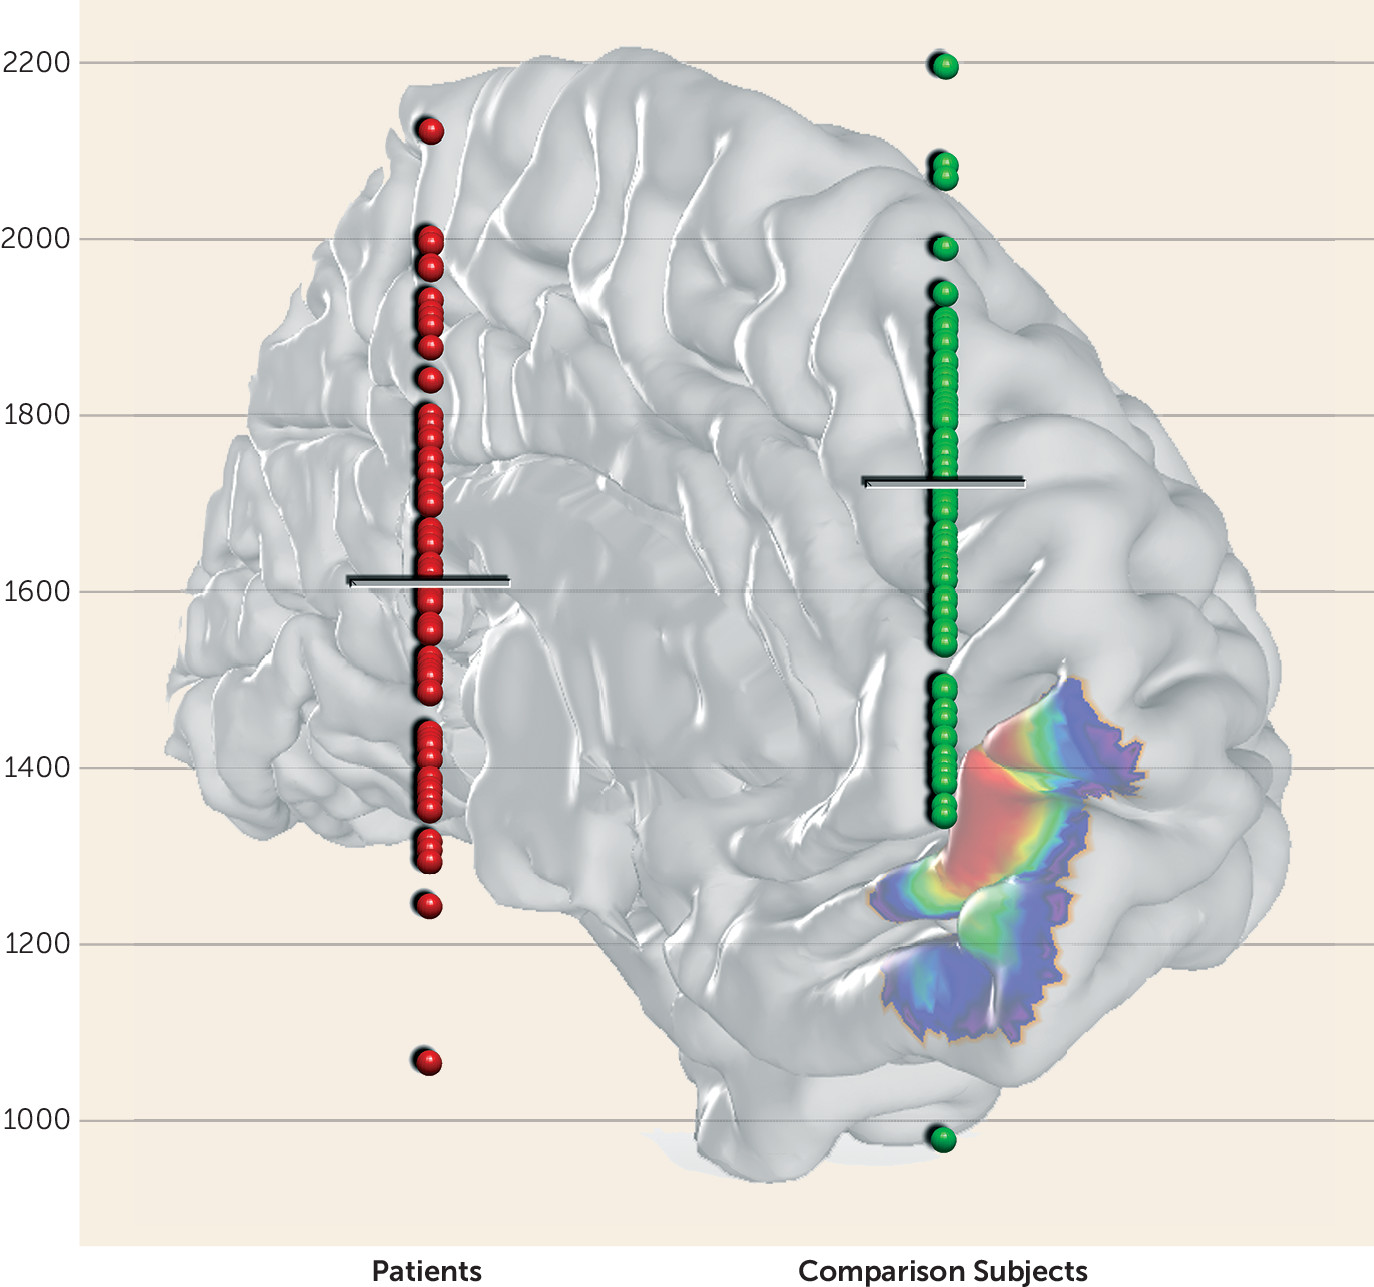
We first tested for gray matter volume differences between patients and comparison subjects within individual left and right Fp1 and Fp2 areas (i.e., four regions). These analyses revealed a significant decrease of volume only for left area Fp2 in depressed patients (p<0.05; false-discovery-rate corrected) (
Figure 2). The other three regions did not show any significant gray matter volume difference between the two groups.
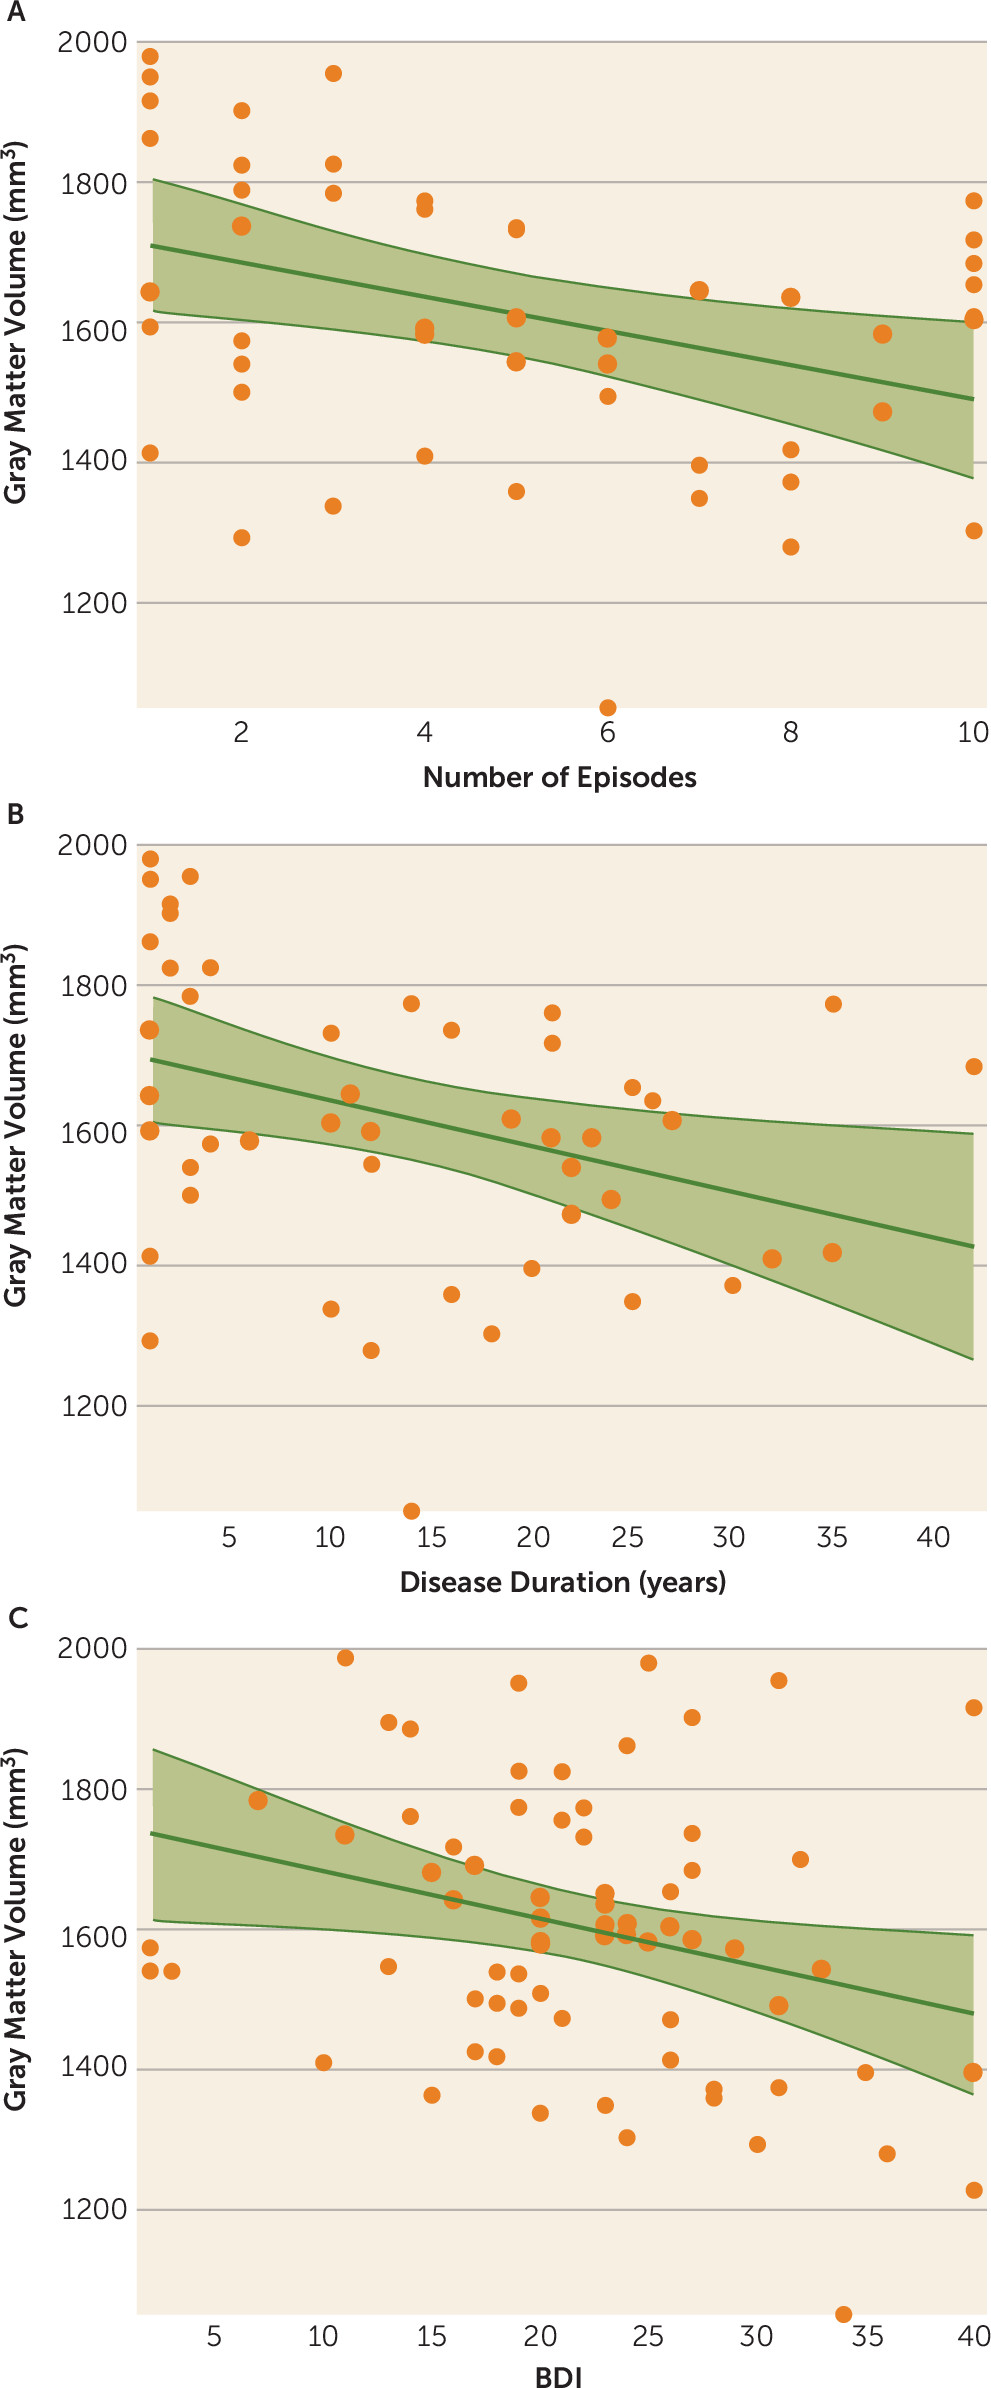
In the next step, we correlated the individual gray matter volume of left Fp2 with disease severity and chronicity in the patient group. This analysis revealed a significant negative correlation between left Fp2 gray matter volume and BDI scores (r=−0.26, p<0.05). Furthermore, the number of previous episodes (r=−0.34, p<0.05), as well as disease duration (r=−0.35, p<0.05), correlated negatively with gray matter volume of left Fp2 in the patient group (
Figure 3). In an exploratory analysis, we additionally assessed potential correlations between the volumes of right Fp2 and bilateral Fp1 (i.e., those areas that did not show a significant main effect of diagnosis) with the respective clinical information. None of these regions revealed any significant correlation, not even at an uncorrected level. In summary, we found that left Fp2 was not only significantly smaller in patients with major depressive disorder but that this atrophy was also more pronounced in more severely or chronically affected patients.
Multivariate Morphometric Comparison
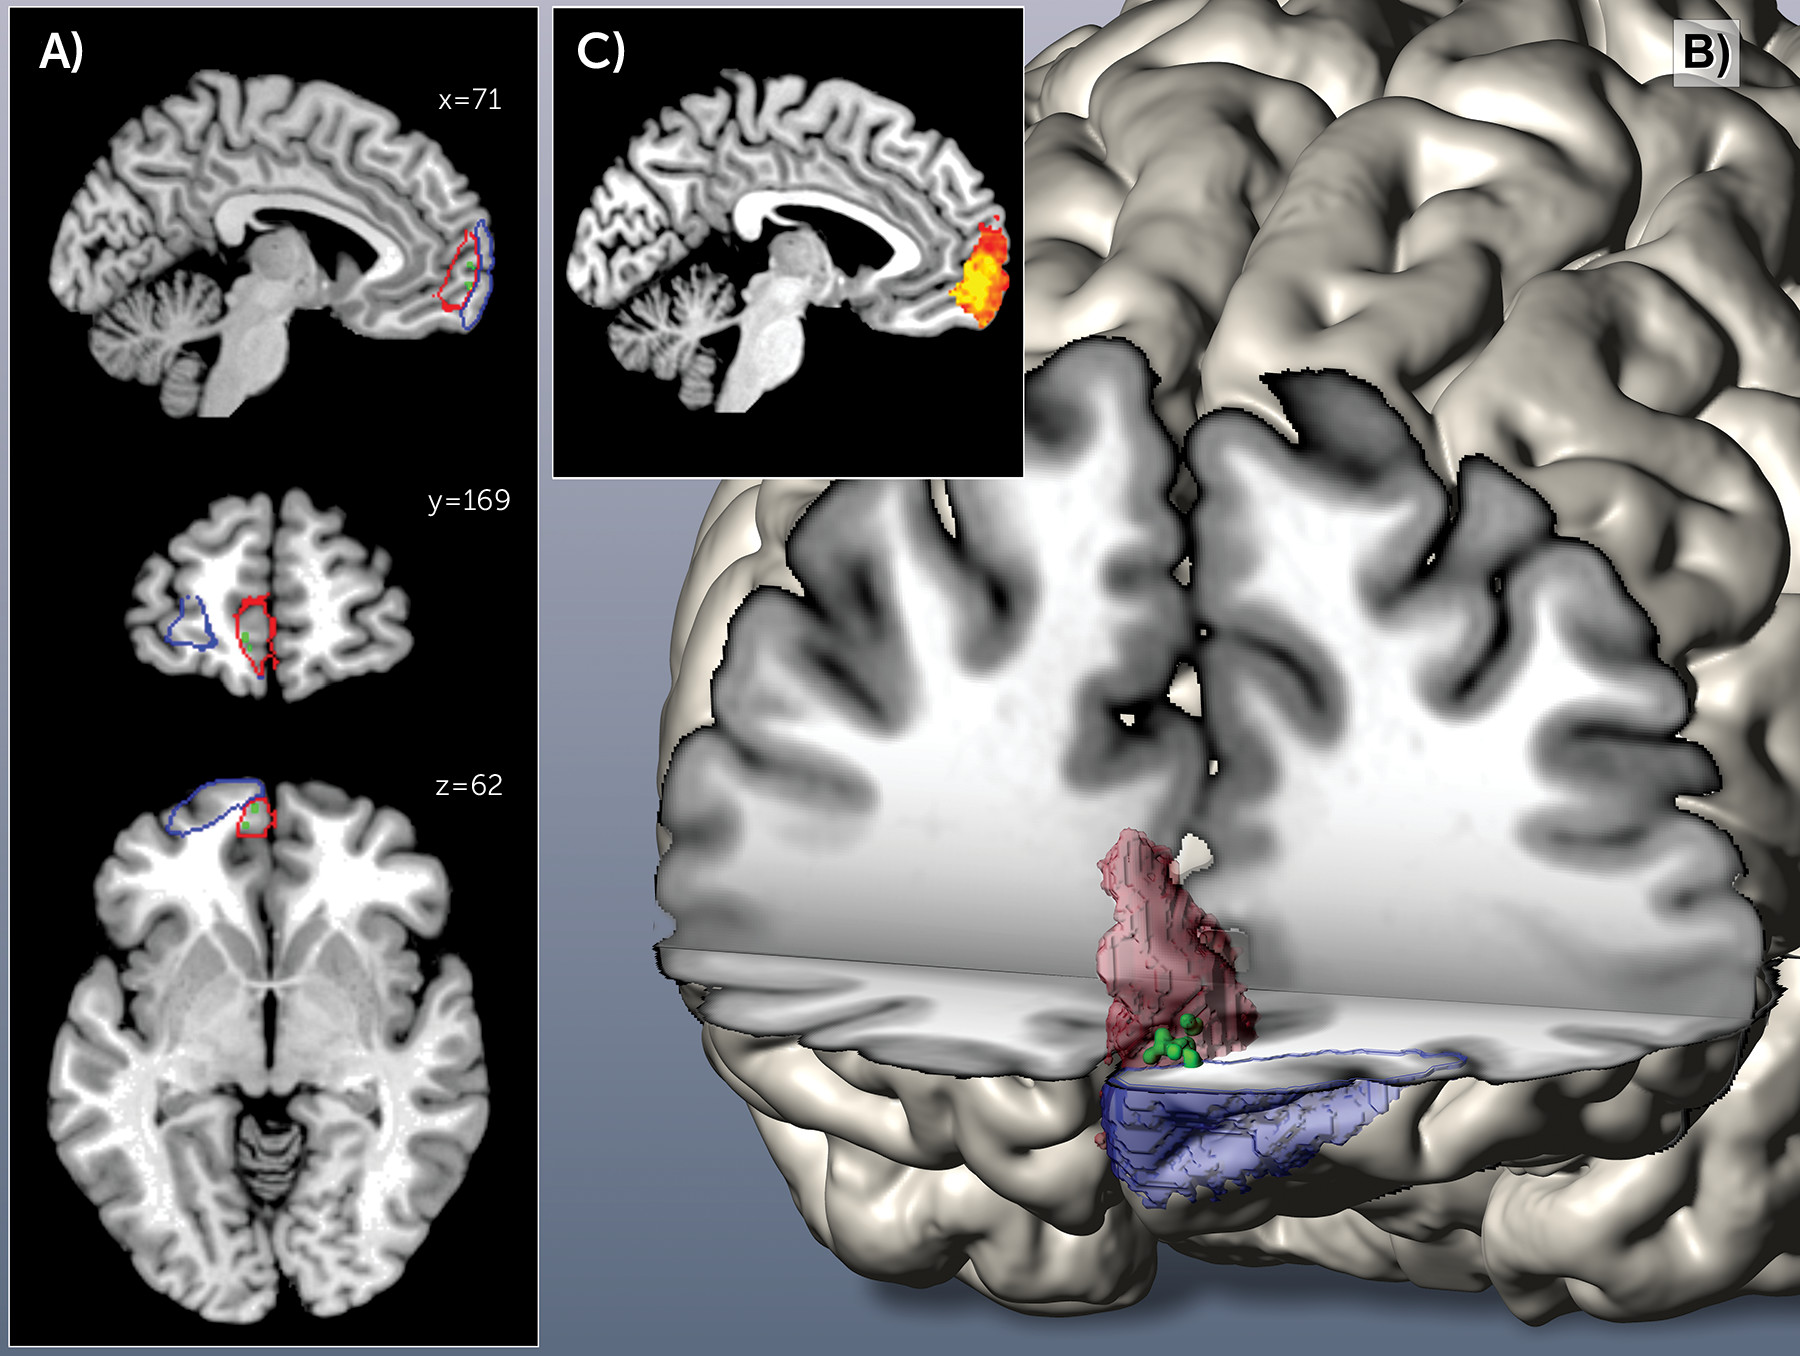
After (individual) univariate analysis of gray matter volume differences between patients and comparison subjects for each of the histologically defined frontal pole areas, we performed multivariate searchlight analysis for each voxel of the entire frontal pole (that is, naive to either Fp1 or Fp2). This structural pattern recognition using support vector machine-based searchlight analysis congruently revealed the left medial aspects of the human frontal pole to carry the most discriminative morphological features. This was indicated by an extended discriminative cluster with disease prediction success between 65% and 73%, depending on the chosen radius. This accuracy clearly exceeded chance level even when correcting for multiple testing across all voxels in the frontal pole (
Figure 4). It is noteworthy that the location of the cluster conveying the most diagnostic morphological properties was identical throughout the searchlight analyses with a radius of 2 to 7 voxels, attesting to the robustness of these findings. Across analyses, the medial portion of the left prefrontal cortex demonstrated regional clustering of high prediction accuracies. No other part of the search region exhibited similar prediction success in accuracy score or regional extent. In a post hoc cytoarchitectonic assessment, the SPM Anatomy toolbox assigned this cluster to the left Fp2. This demonstrates that local volumes in the left medial frontal pole allow a classification of previously unseen subjects as patients and comparison subjects.
Discussion
Recent cytoarchitectonic work has shown that the human frontal pole consists of two distinct areas (
15). These feature different functional connectivity and functions, with area Fp2 associated with emotional and social cognition, while Fp1 is associated with working memory and perception (
3,
4,
15). In the present study, we investigated structural differences of the frontal pole between 73 patients and a matched healthy comparison group. We used two different approaches to assess whether, and where, the frontal pole is structurally altered in depressed patients. We found converging evidence pointing to a specific morphological alteration of only left medial region Fp2 in patients with major depressive disorder. Notably, decreased gray matter volume in this area was not only related to clinical depression severity and chronicity but also allowed classification of individual subjects as depressed or healthy at a statistically significant level.
Structural Alterations of the Human Frontal Pole in Major Depressive Disorder
Our results relate well to previously described neurobiological alterations in the human frontal pole observed in depressed patients, including differences in serotonin receptor densities (
9,
10). Other histological studies demonstrated a marked decrease in the density of glial cells, an enlargement of glial cell sizes, as well as reductions in the neuronal density, predominantly in layer III, of the prefrontal cortex in depressed patients (
29).
Additionally, significant gray matter volume reductions in depressed patients were described for the human prefrontal cortex, including the frontal pole (
12,
13). Those former results match well with our results; nevertheless, reports about bilateral volume reductions might be caused by the usage of different respectively nonprobabilistic atlases. This might lead to a slightly different assignment of region-specific volume alterations. Encapsulating areas Fp1 and Fp2 in such broader region (
12,
30,
31), however, has raised the question whether and where the frontal pole is affected in major depressive disorder. Since the anterior cingulate cortex is described as a key region in the pathophysiologic network of major depressive disorder (
32), most of those results were interpreted in the context of being mainly associated with the cingulate cortex (
12). Including cytoarchitectonically specific maps of areas Fp1 and Fp2 in the current analytic framework, however, provided a unique opportunity for assessing the spatial arrangement and the degree of volume loss in the frontal pole and thus a much more specific assessment of regional atrophy than possible by macroanatomical definitions.
Region-Specific Contribution of Areas Fp1 and Fp2 to the Pathophysiology of Major Depressive Disorder
We found a depression-related volumetric atrophy specifically associated with medial frontopolar area Fp2. Interestingly, this area is predominantly associated with social-affective processes, whereas the lateral frontal pole (i.e., area Fp1) is predominantly associated with more cognitive functions, including working memory and perception (
4,
15).
Previous pathophysiological considerations drew attention to the medial part of BA 10, comparable to area Fp2, as being part of the limbic-cortical dysregulation network of major depression (
16–
18). One important anatomical structure of this dysregulation network is the uncinate fasciculus, which connects the frontal pole with other key regions in the pathophysiology of depression (e.g., with the amygdala) (
33,
34). Furthermore, the uncinate fasciculus contributes to frontal-subcortical neuronal circuits, which are involved in emotional and cognitive processing (
35,
36), making them particularly relevant to depression. A recent deep brain stimulation study with depressed patients showed that alterations of the uncinate fasciculus provide a good measurement to discriminate between responders and nonresponders, and the study also postulated that targeting subcallosal cingulate and medial BA 10 cortex might be sufficient for antidepressant treatment (
14). This likewise pointed to a potentially heterogeneous contribution of areas Fp1 and Fp2 to depression, which we confirmed in the present study. Additionally, and in line with its association to social-affective processes (
4,
15), it should be noted that it is the medial part of the human frontal pole that maintains the strongest functional association with the anterior cingulate cortex (
37) and the amygdala (
15).
Interestingly, the present study also revealed a correlation with disease severity exclusively in left area Fp2. This is in line with previous studies reporting structural connectivity deficits between limbic structures and frontal areas connected through the uncinate fasciculus in depressed patients specifically for the left uncinate fasciculus (
38). Taken together, this indicates a possible correlation between an altered structural composition, either of the cortex or the white matter of the left medial frontal pole, and the pathophysiology of major depressive disorder.
Limitations
The multisite setting of the present study is challenging, since it required an age and gender matching per site (which was realized in this study in addition to the removal of any variance related to the different measurement sites) and might involve possible different standard medication approaches within patient groups. On the other hand, it provides a more realistic representation of patients with major depressive disorder in Germany. Those factors could only be minimized by strict matching and statistical confound adjustment but could not systematically be eliminated.
Secondly, since all but two patients within our study received standard antidepressive medication, we cannot exclude medication-induced effects. Moreover, medication-specific subgroup analyses were not possible due to highly variable medication regimens as prescribed by the attending psychiatrists. While the rating of depression severity using (only) a self-rated measure may be considered a drawback of our study, we would argue that it actually does provide a benefit in the employed multisite setting. In particular, we would like to note that noise variance in BDI scores should be more or less randomly distributed, since it depends on interindividual differences in introspective abilities, repression, honesty, etc. In turn, assessment by an observer-rated inventory should be more susceptible to site- or rater-dependent systematic biases. Because both the uni- and multivariate morphometric analyses congruently detected the morphological properties of only medial area Fp2 as most informative for the disease status, our results can be regarded as being robust. Could they be medication related? We would argue that the specific location to only one region in one hemisphere provides evidence to the contrary, as drug-induced gray matter alterations would be expected to affect both hemispheres in a comparable way. To our knowledge, there are no reported volumetric effects caused by medication specifically for one hemisphere of one region.
Finally, we note that various structural brain atlases based on different features of regional brain organization, from gyral anatomy to gene-expression and diffusion-weighted imaging, coexist in the field of systems neuroscience (for review see reference
21). The JuBrain histological atlas, however, is currently the only atlas based on microstructural criteria obtained from a group of subjects, yielding a reliable definition of cortical microstructure, which in turn should represent a main constraint to functional organization (
20).
Conclusions
In the presented analyses of multisite voxel-based morphometric data, we found converging evidence for structural alterations of the left medial frontal pole area Fp2 in major depressive disorder across both uni- and multivariate statistical approaches. These complementary analyses confirmed that the volume of left Fp2 was smaller in depressed patients than in healthy comparison subjects. Additionally this regional atrophy also correlated negatively with disease severity and duration, and it allowed the discrimination between patients and comparison subjects. In line with earlier functional decoding of areas Fp1 and Fp2 (
15), this highlights social-affective processes as associated with atrophy in the left medial frontal pole in depressed patients. This potential implication of socio-emotional processing in the pathophysiology of major depressive disorder is closely related to its clinical hallmarks, including mood disturbances and rumination.
