Randomized Clinical Trial of Computerized and Clinician-Delivered CBT in Comparison With Standard Outpatient Treatment for Substance Use Disorders: Primary Within-Treatment and Follow-Up Outcomes
Abstract
Objective:
Method:
Results:
Conclusions:
Method
Participants

Treatments
Standard treatment as usual.
Clinician-delivered CBT.
CBT4CBT plus monitoring.
Assessments
Data Analysis
Results
| Characteristic | Clinician-Delivered CBT Group (N=49) | Treatment as Usual Group (N=50) | CBT4CBT With Monitoring Group (N=38) | Total (N=137) | ||||
|---|---|---|---|---|---|---|---|---|
| N | % | N | % | N | % | N | % | |
| Female | 12 | 24.5 | 13 | 26.0 | 10 | 26.3 | 35 | 25.5 |
| Hispanic ethnicity | 7 | 14.3 | 10 | 20.0 | 5 | 13.2 | 22 | 16.1 |
| Race | ||||||||
| Caucasian | 19 | 38.8 | 18 | 36.0 | 10 | 26.3 | 47 | 34.3 |
| African-American | 24 | 49.0 | 22 | 44.0 | 21 | 55.3 | 67 | 48.9 |
| Indicated Hispanic only | 3 | 6.1 | 6 | 12.0 | 2 | 5.3 | 11 | 8.0 |
| Multiracial or other | 3 | 6.1 | 4 | 8.0 | 5 | 13.2 | 12 | 8.7 |
| Completed high school | 33 | 67.3 | 39 | 78.0 | 31 | 81.6 | 103 | 75.2 |
| Unemployed | 35 | 71.4 | 36 | 72.0 | 23 | 60.5 | 94 | 68.6 |
| Referred by criminal justice system | 17 | 34.7 | 22 | 44.0 | 9 | 23.7 | 48 | 35.0 |
| On public assistance | 24 | 49.0 | 23 | 46.0 | 22 | 59.5 | 69 | 50.7 |
| Lifetime anxiety disorder | 4 | 8.2 | 4 | 8.0 | 0 | 0.0 | 8 | 5.9 |
| Lifetime major depressive disorder | 8 | 16.3 | 20 | 40.0 | 9 | 23.7 | 37 | 27.0 |
| Current major depressive disorder | 4 | 8.2 | 8 | 16.0 | 2 | 5.3 | 14 | 10.2 |
| Antisocial personality disorder | 12 | 25.0 | 13 | 27.1 | 7 | 19.4 | 32 | 24.0 |
| Principal substance used (self-report) | ||||||||
| Marijuana | 26 | 53.1 | 22 | 44.0 | 19 | 50.0 | 67 | 48.9 |
| Cocaine | 12 | 24.5 | 17 | 34.0 | 11 | 28.9 | 40 | 29.2 |
| Alcohol | 9 | 18.4 | 10 | 20.0 | 7 | 18.4 | 26 | 19.0 |
| Opioids | 0 | 0.0 | 1 | 2.0 | 1 | 2.6 | 2 | 1.5 |
| Hallucinogens | 2 | 4.1 | 0 | 0.0 | 0 | 0.0 | 2 | 1.5 |
| Concurrent alcohol and drug disorders | 16 | 32.7 | 24 | 48.0 | 10 | 26.3 | 50 | 36.5 |
| More than one drug use disorder | 8 | 16.3 | 10 | 20.0 | 2 | 5.3 | 20 | 14.6 |
| Using both alcohol and drugs at baseline | 37 | 75.5 | 42 | 84.0 | 33 | 86.8 | 112 | 81.8 |
| Mean | SD | Mean | SD | Mean | SD | Mean | SD | |
| Age (years) | 34.3 | 12.6 | 36.9 | 12.1 | 36.6 | 11.1 | 35.9 | 12.0 |
| Days of primary substance use, past 28 | 15.0 | 10.1 | 12.3 | 9.6 | 14.3 | 10.1 | 13.8 | 9.9 |
| Age at first use of primary substance (years) | 15.9 | 4.9 | 17.2 | 6.5 | 16.7 | 5.1 | 16.6 | 5.6 |
| Years of primary substance use | 8.7 | 9.7 | 10.4 | 9.1 | 10.5 | 11.0 | 9.8 | 9.8 |
| Number of previous drug treatments | 1.6 | 2.6 | 2.2 | 3.8 | 1.7 | 2.6 | 1.8 | 3.1 |
| Number of previous alcohol treatments | 1.2 | 3.3 | 1.6 | 3.8 | 0.8 | 2.1 | 1.2 | 3.2 |
| Times arrested, lifetime | 9.2 | 17.5 | 7.5 | 9.4 | 6.4 | 6.8 | 7.8 | 12.4 |
| Months incarcerated, lifetime | 26.5 | 43.2 | 20.2 | 42.0 | 19.6 | 37.2 | 22.3 | 41.0 |
| Shipley IQ estimate, age- and education-corrected | 82.8 | 15.0 | 83.2 | 14.2 | 86.8 | 14.6 | 84.1 | 14.6 |
Treatment Adherence, Retention, and Data Availability by Condition
| Variable | Clinician-Delivered CBT Group (N=49) | Treatment as Usual Group (N=50) | CBT4CBT With Monitoring Group (N=38) | Contrast 1: CBT Versus Treatment as Usual | Contrast 2: CBT4CBT Versus Treatment as Usual | |||||||
|---|---|---|---|---|---|---|---|---|---|---|---|---|
| Mean | SD | Mean | SD | Mean | SD | F | p | Partial eta2 | f | p | Partial eta2 | |
| General protocol adherence | ||||||||||||
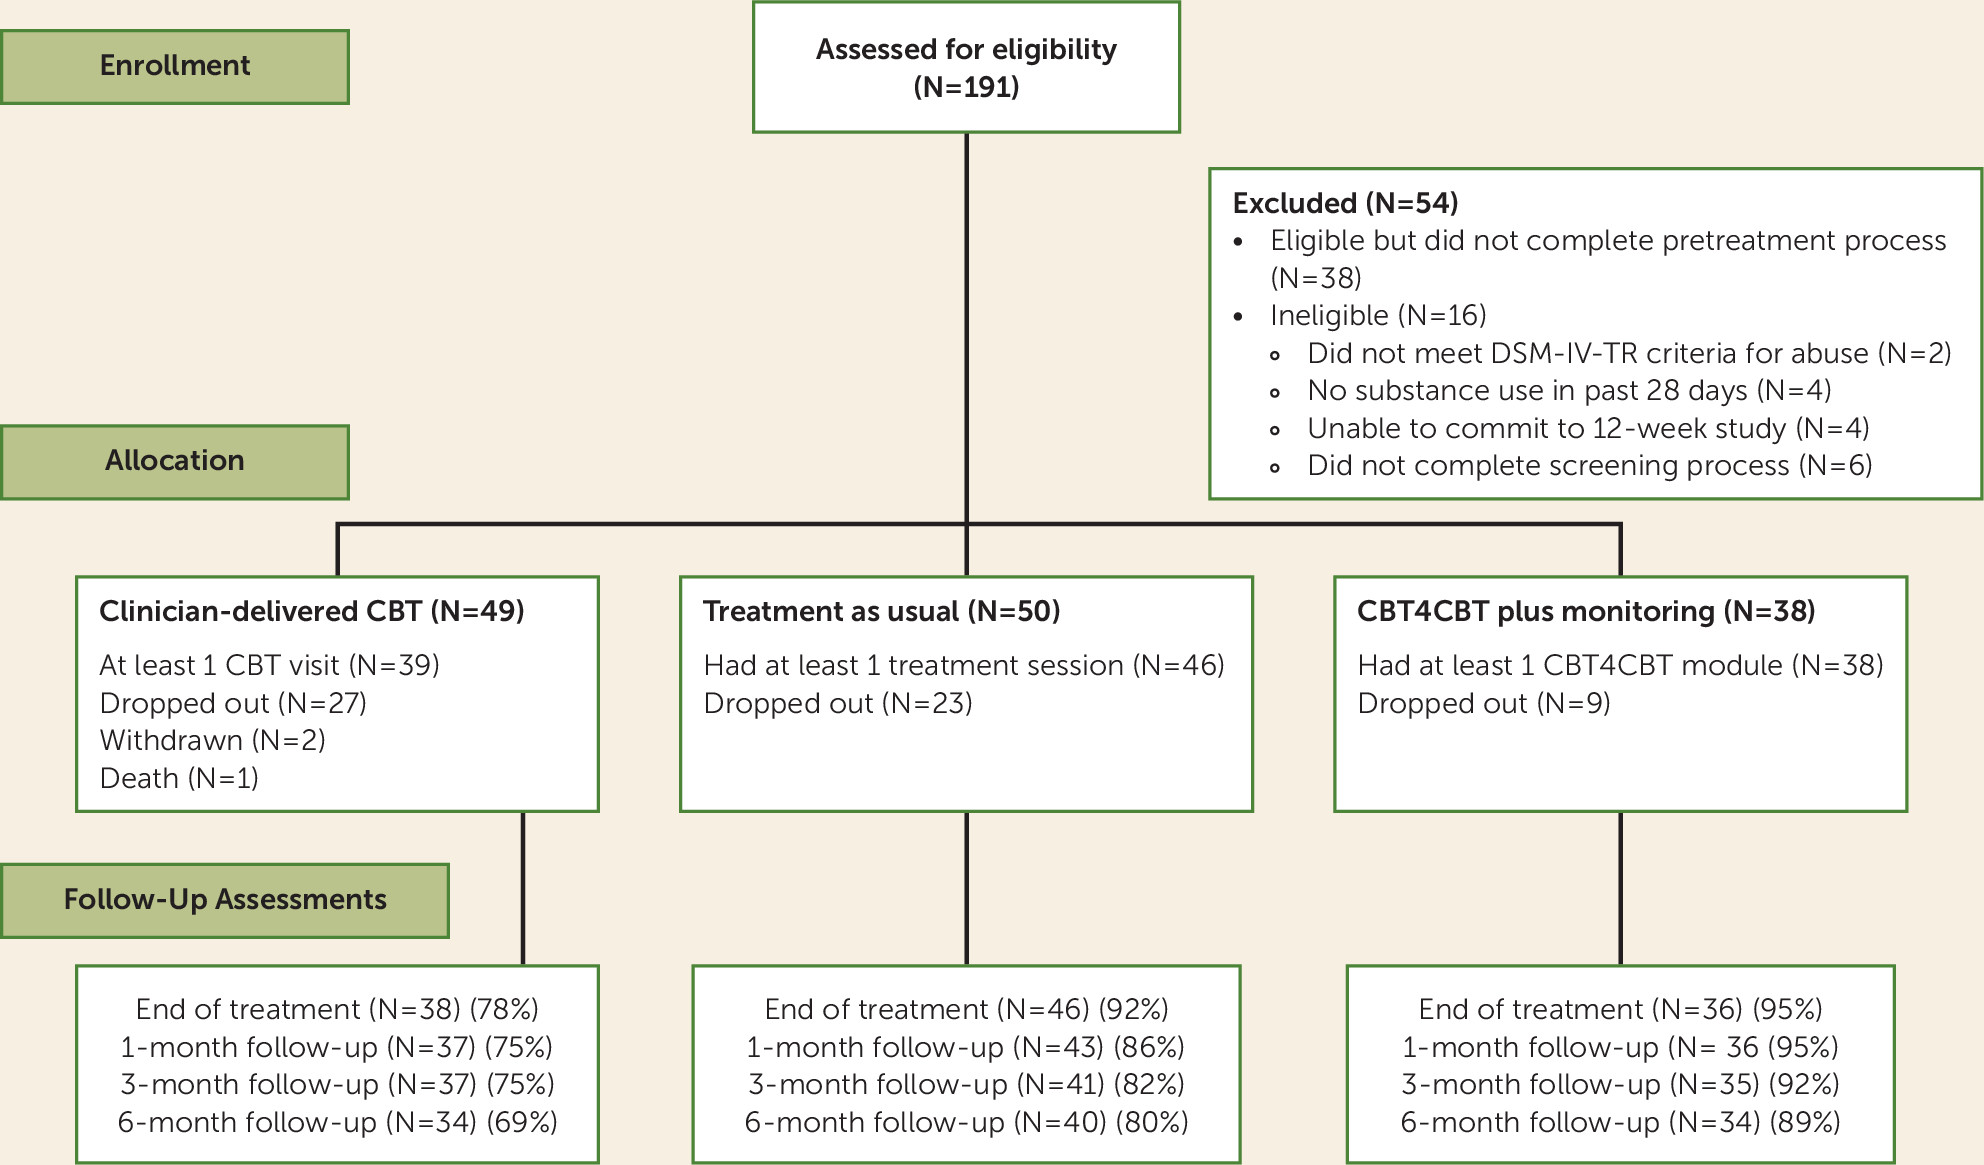
| Days in treatment (maximum=84) | 42.8 | 30.7 | 55.5 | 27.3 | 61.7 | 26.8 | 4.85 | 0.03 | 0.04 | 1.09 | 0.30 | 0.01 |
| Number of urine specimens collected | 8.0 | 6.6 | 10.5 | 5.9 | 12.0 | 6.6 | 2.30 | 0.13 | 0.02 | 1.10 | 0.30 | 0.01 |
| Total number of treatment sessionsa | 4.1 | 3.4 | 5.6 | 3.1 | 6.9 | 3.6 | 4.99 | 0.03 | 0.04 | 3.59 | 0.06 | 0.03 |
| Treatment-specific adherence | ||||||||||||
| Total individual sessions | 4.1 | 3.4 | 3.0 | 3.4 | NA | 2.53 | 0.12 | 0.03 | ||||
| Total group sessions | NA | 2.6 | 3.2 | NA | ||||||||
| Total monitoring sessions | NA | NA | 6.8 | 3.6 | ||||||||
| Total CBT4CBT modules | NA | NA | 5.5 | 2.3 | ||||||||
| Number of homework assignments completed | 2.8 | 2.5 | NA | 2.2 | 2.4 | 0.23 | 0.63 | 1.57 | 0.12 | 0.73 | 0.65 | |
| N | % | N | % | N | % | Wald χ2 | p | Exp(b) | Wald χ2 | p | Exp(b) | |
| Participants with one or more serious adverse eventsb | ||||||||||||
| Substance use or psychiatric events during treatment | 3 | 6.1 | 2 | 4.0 | 1 | 2.6 | 0.23 | 0.63 | 1.57 | 0.12 | 0.73 | 0.65 |
| Medical events during treatment | 2 | 4.1 | 1 | 2.0 | 3 | 7.9 | 0.35 | 0.55 | 2.09 | 1.49 | 0.22 | 4.20 |
| Substance use or psychiatric events during follow-up (Ns are 37, 43, 35) | 1 | 2.7 | 1 | 2.3 | 3 | 8.6 | 0.01 | 0.91 | 1.17 | 1.35 | 0.25 | 3.94 |
| Medical events during follow-up (Ns are 37, 43, 35) | 4 | 10.8 | 3 | 7.0 | 3 | 8.9 | 0.36 | 0.55 | 1.62 | 0.07 | 0.79 | 1.25 |
| Mean | SD | Mean | SD | Mean | SD | F | p | Partial eta2 | f | p | Partial eta2 | |
| Secondary substance use outcomes | ||||||||||||
| Percent urine specimens negative for all drugs | 33.1 | 43.3 | 34.3 | 39.7 | 37 | 41.1 | 0.02 | 0.89 | 0.000 | 0.33 | 0.57 | 0.003 |
| Percent cocaine-negative urine toxicology screens, all participants | 86.3 | 30.2 | 74.9 | 36.8 | 90.7 | 21.9 | 2.98 | 0.09 | 0.024 | 5.45 | 0.02 | 0.043 |
| Percent cocaine-negative urine toxicology screens, cocaine users only (Ns are 9, 17, 11) | 63.6 | 46.2 | 39.4 | 37.3 | 75.3 | 34.4 | 2.29 | 0.14 | 0.060 | 5.73 | 0.02 | 0.140 |
| Percent marijuana-negative urine toxicology screens, all participants | 44.5 | 47.1 | 43.6 | 44.2 | 48.8 | 43.3 | 0.01 | 0.93 | 0.000 | 0.27 | 0.60 | 0.002 |
| Percent marijuana-negative urine toxicology screens, marijuana users only (Ns are 23, 19, 18) | 14.7 | 32.0 | 22.3 | 34.5 | 17.7 | 29.4 | 0.57 | 0.45 | 0.010 | 0.19 | 0.66 | 0.003 |
| N | % | N | % | N | % | Wald χ2 | p | Exp(b) | Wald χ2 | p | Exp(b) | |
| Categorical outcomes, indicators of clinical significance | ||||||||||||
| No drug-positive urine specimens during last 2 weeks of treatment | 9 | 18.4 | 9 | 18 | 13 | 34.2 | 0.00 | 0.96 | 1.030 | 3.00 | 0.09 | 2.370 |
| Did not meet DSM criteria for primary substance use diagnosis at 12 weeks (Ns are 41, 47, 37) | 16 | 51.6 | 15 | 42.9 | 20 | 66.7 | 0.51 | 0.48 | 0.710 | 3.61 | 0.06 | 0.380 |
| Follow-up outcomes | ||||||||||||
| Urine specimen negative for all drugs (N negative/N collected) | ||||||||||||
| One-month follow-up (N=73) | 6/18 | 33.3 | 16/29 | 55.2 | 12/26 | 46.2 | 2.10 | 0.15 | 2.460 | 0.40 | 0.51 | 1.440 |
| Three-month follow-up (N=79) | 7/23 | 30.4 | 11/33 | 33.3 | 14/23 | 60.9 | 0.10 | 0.82 | 1.140 | 4.00 | 0.04 | 3.210 |
| Six-month follow-up (N=102) | 8/33 | 24.2 | 12/39 | 30.9 | 15/30 | 50.0 | 0.40 | 0.54 | 1.390 | 2.60 | 0.11 | 0.440 |
| Mean | SD | Mean | SD | Mean | SD | F | p | Partial eta2 | f | p | Partial eta2 | |
| Percent days abstinent from drugs and alcohol (self-report) | 61.4 | 35.7 | 67.3 | 34.3 | 75.2 | 30.9 | 0.55 | 0.46 | 0.005 | 1.00 | 0.32 | 0.009 |
Effects of Study Treatment on Substance Use Outcomes During Treatment and Follow-Up
| Parameter | Estimate | SE | df | t | p | 95% CI |
|---|---|---|---|---|---|---|
| Treatment phase | ||||||
| Intent-to-treat sample (N=137; 1,098 observations; weeks 1–12) | ||||||
| Intercept | 3.39 | 0.33 | 179.99 | 10.32 | 0.00 | 2.74, 4.04 |
| Contrast 1 main effect | 0.40 | 0.47 | 188.10 | 0.85 | 0.40 | –0.53, 1.33 |
| Contrast 2 main effect | 0.20 | 0.50 | 179.96 | 0.40 | 0.69 | –0.79, 1.19 |
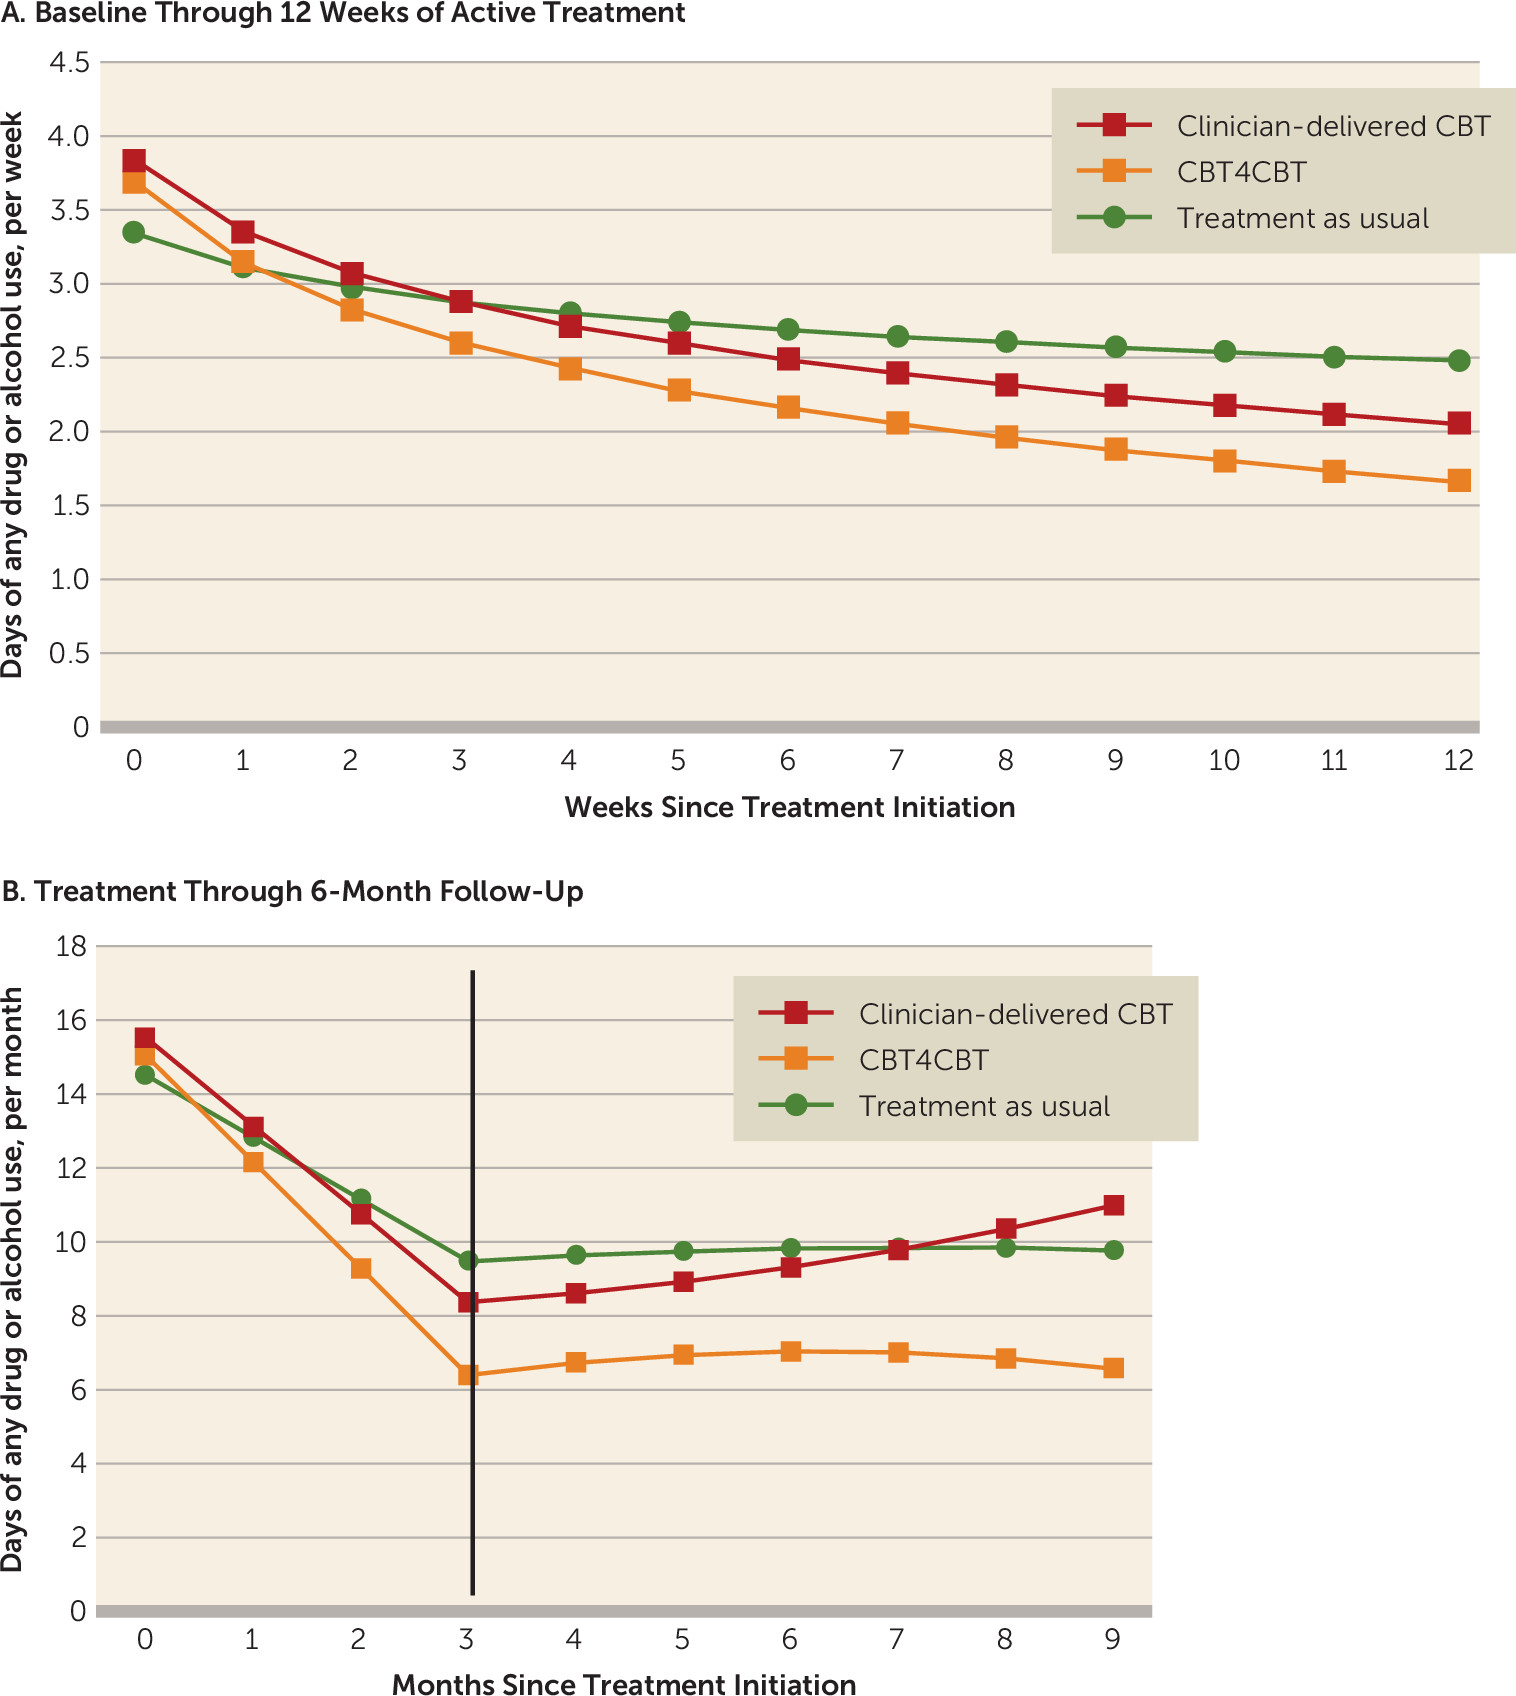
| Time (week) | –0.45 | 0.10 | 999.74 | –4.61 | 0.00 | –0.65, –0.26 |
| Contrast 1 by week | –0.51 | 0.15 | 1019.23 | –3.41 | 0.00 | –0.81, –0.22 |
| Contrast 2 by week | –0.33 | 0.14 | 996.71 | –2.26 | 0.02 | –0.61, –0.04 |
| Subset of participants who initiated treatment (N=123; 1,084 observations; weeks 1–12) | ||||||
| Intercept | 3.38 | 0.34 | 161.77 | 9.81 | 0.00 | 2.70, 4.06 |
| Contrast 1 main effect | 0.54 | 0.51 | 168.00 | 1.06 | 0.29 | –0.47, 1.55 |
| Contrast 2 main effect | 0.22 | 0.51 | 164.18 | 0.43 | 0.67 | –0.79, 1.23 |
| Time (week) | –0.45 | 0.10 | 981.46 | –4.55 | 0.00 | –0.64, –0.26 |
| Contrast 1 by week | –0.53 | 0.15 | 987.60 | –3.48 | 0.00 | –0.83, –0.23 |
| Contrast 2 by week | –0.33 | 0.14 | 986.19 | –2.27 | 0.02 | –0.61, –0.04 |
| Subset of individuals with adequate exposure to treatment (N=81; 881 observations; weeks 1–12) | ||||||
| Intercept | 3.46 | 0.42 | 107.99 | 8.15 | 0.00 | 2.62, 4.30 |
| Contrast 1 main effect | 0.73 | 0.67 | 108.18 | 1.09 | 0.28 | –0.60, 2.05 |
| Contrast 2 main effect | 0.10 | 0.61 | 107.84 | 0.17 | 0.87 | –1.11, 1.31 |
| Time (week) | –0.52 | 0.11 | 799.27 | –4.94 | 0.00 | –0.73, –0.31 |
| Contrast 1 by week | –0.61 | 0.17 | 798.97 | –3.65 | 0.00 | –0.94, –0.28 |
| Contrast 2 by week | –0.30 | 0.15 | 799.32 | –1.99 | 0.05 | –0.60, 0.00 |
| Follow-up phase | ||||||
| Intent-to-treat sample, all data points (N=137; 1,172 observations), results of piecewise regression with phase (treatment phase compared with follow-up months 1–6) | ||||||
| Intercept | 14.51 | 1.35 | 231.36 | 10.74 | 0.00 | 11.85, 17.17 |
| Contrast 1 main effect | 1.00 | 1.93 | 233.67 | 0.52 | 0.60 | –2.79, 4.80 |
| Contrast 2 main effect | 0.53 | 2.05 | 230.82 | 0.26 | 0.80 | –3.52, 4.58 |
| Time (month) | –1.68 | 0.39 | 1044.99 | –4.26 | 0.00 | –2.45, –0.91 |
| Contrast 1 by month | –0.70 | 0.58 | 1059.44 | –1.21 | 0.23 | –1.84, 0.43 |
| Contrast 2 by month | –1.20 | 0.59 | 1040.02 | –2.02 | 0.04 | –2.37, –0.04 |
| Phase (treatment versus follow-up) | 1.93 | 1.17 | 1033.60 | 1.65 | 0.10 | –0.37, 4.22 |
| Contrast 1 by phase | 0.52 | 1.72 | 1036.08 | 0.31 | 0.76 | –2.84, 3.89 |
| Contrast 2 by phase | 1.54 | 1.74 | 1031.67 | 0.88 | 0.38 | –1.88, 4.96 |
| Time (month) by phase | –0.02 | 0.10 | 1030.85 | –0.21 | 0.83 | –0.22, 0.18 |
| Contrast 1 by month by phase | 0.06 | 0.15 | 1030.39 | 0.42 | 0.68 | –0.23, 0.36 |
| Contrast 2 by month by phase | –0.04 | 0.15 | 1029.81 | –0.26 | 0.79 | –0.34, 0.26 |

Secondary Substance Use Outcomes Within Treatment and Follow-Up
Knowledge of CBT Concepts and Treatment Satisfaction
Discussion
Acknowledgments
Footnote
Supplementary Material
- View/Download
- 41.38 KB
References
Information & Authors
Information
Published In
History
Keywords
Authors
Competing Interests
Funding Information
Metrics & Citations
Metrics
Citations
Export Citations
If you have the appropriate software installed, you can download article citation data to the citation manager of your choice. Simply select your manager software from the list below and click Download.
For more information or tips please see 'Downloading to a citation manager' in the Help menu.
View Options
View options
PDF/EPUB
View PDF/EPUBLogin options
Already a subscriber? Access your subscription through your login credentials or your institution for full access to this article.
Personal login Institutional Login Open Athens loginNot a subscriber?
PsychiatryOnline subscription options offer access to the DSM-5-TR® library, books, journals, CME, and patient resources. This all-in-one virtual library provides psychiatrists and mental health professionals with key resources for diagnosis, treatment, research, and professional development.
Need more help? PsychiatryOnline Customer Service may be reached by emailing [email protected] or by calling 800-368-5777 (in the U.S.) or 703-907-7322 (outside the U.S.).

