Abstract

Objective:

Pharmacogenomic studies of antipsychotics have typically examined effects of individual polymorphisms. By contrast, polygenic risk scores (PRSs) derived from genome-wide association studies (GWAS) can quantify the influence of thousands of common alleles of small effect in a single measure. The authors examined whether PRSs for schizophrenia were predictive of antipsychotic efficacy in four independent cohorts of patients with first-episode psychosis (total N=510).

Method:

All study subjects received initial treatment with antipsychotic medication for first-episode psychosis, and all were genotyped on standard single-nucleotide polymorphism (SNP) arrays imputed to the 1000 Genomes Project reference panel. PRS was computed based on the results of the large-scale schizophrenia GWAS reported by the Psychiatric Genomics Consortium. Symptoms were measured by using total symptom rating scales at baseline and at week 12 or at the last follow-up visit before dropout.

Results:

In the discovery cohort, higher PRS significantly predicted higher symptom scores at the 12-week follow-up (controlling for baseline symptoms, sex, age, and ethnicity). The PRS threshold set at a p value <0.01 gave the strongest result in the discovery cohort and was used to replicate the findings in the other three cohorts. Higher PRS significantly predicted greater posttreatment symptoms in the combined replication analysis and was individually significant in two of the three replication cohorts. Across the four cohorts, PRS was significantly predictive of adjusted 12-week symptom scores (pooled partial r=0.18; 3.24% of variance explained). Patients with low PRS were more likely to be treatment responders than patients with high PRS (odds ratio=1.91 in the two Caucasian samples).

Conclusions:

Patients with higher PRS for schizophrenia tended to have less improvement with antipsychotic drug treatment. PRS burden may have potential utility as a prognostic biomarker.
Genetic susceptibility to schizophrenia is highly polygenic, including many associated loci of small effect (1, 2). Although individual risk alleles may convey an odds ratio of 1.1 or lower, the combination of all such effects across the genome holds substantial explanatory power. For example, any individual can be characterized by a polygenic risk score (PRS), representing the total number of risk alleles he or she carries, weighted by the odds ratio associated with each allele as derived from previous genome-wide association study (GWAS) findings (3, 4). Although a high PRS for schizophrenia is not deterministic, PRSs derived from the Psychiatric Genomics Consortium (1) account for approximately 7% of variation in the risk for schizophrenia (as measured on the liability scale [5]), with about half of that variance accounted for by the top (genome-wide significant) loci. Additionally, individuals scoring in the top decile are approximately 15 times more likely to manifest the illness compared with those in the bottom decile (1).
Given the explanatory power of PRS for susceptibility to schizophrenia, it is reasonable to ask whether these scores can be informative regarding clinical heterogeneity within the disorder (2). For example, while antipsychotic drugs are the mainstay therapy for schizophrenia (6, 7), up to 30%−40% of patients do not respond to antipsychotic treatment (8), and many patients discontinue their medications due to lack of efficacy (9). There is currently a paucity of clinically informative biomarkers, and pharmacogenomics is one approach to identifying predictors of treatment response (10). To date, candidate-gene studies and a small number of GWAS have had limited success in identifying genetic variants replicably associated with antipsychotic treatment response. Thus far, only two variants (at the DRD2 gene and the COMT gene) have demonstrated consistent effects across multiple cohorts as demonstrated by meta-analysis (11, 12). Although promising, their effect sizes are relatively small (odds ratios, 1.54 and 1.37, respectively), and predictive power is limited (13).
Given previous findings suggesting that a family history of schizophrenia may be associated with poor clinical response (14, 15), patients with higher genetic burden of schizophrenia may have poorer clinical outcomes. Compared with candidate gene approaches, PRS methods may better capture the full genomic underpinnings of illness and improve clinical prediction, as has been recently demonstrated with prostate cancer, in which higher PRS was associated with more aggressive illness (16). One recent schizophrenia study utilized clinically assigned clozapine therapy as a proxy for treatment resistance (by comparing patients treated with clozapine with those who had never been prescribed clozapine) and found that the PRS was significantly higher among patients in the clozapine group compared with patients in the nonclozapine group (17), although another study failed to replicate the finding (18). However, both were cross-sectional studies that can be affected by ascertainment bias and inaccuracies of classification. For example, a similar cross-sectional study providing evidence for a pharmacogenetic role for the BDNF Val66Met variant (19) was not supported by subsequent longitudinal studies conducted in the context of clinical trials (20). Furthermore, PRS may have additional advantages in clinical prediction because it is a continuous variable that can have different cutoffs that maximize predictive power, whereas the candidate gene approach can compare only carriers with noncarriers. Moreover, its predictive power will increase as the discovery sample becomes larger.
In the present study, we aimed to investigate whether PRS based on the large-scale GWAS conducted by the Psychiatric Genomics Consortium (1) was predictive of antipsychotic efficacy in patients with first-episode nonaffective psychosis. There are several advantages of studying first-episode psychosis, such as minimal or no previous drug exposure, increased effect size of genotype-phenotype association (21), and representation of the whole patient population compared with chronic patient samples that may be subject to ascertainment biases (22). Although one previous study examined PRS in relation to clinical response to lurasidone in patients with chronic schizophrenia (23), the present study is the first study, to our knowledge, to longitudinally examine treatment response in patients with first-episode psychosis undergoing initial treatment with antipsychotics.

Method

Participants

Seventy-seven patients from the Zucker Hillside Hospital First-Episode schizophrenia trial (ZHH-FE) (24) comprised the discovery cohort. The patients were treated with either risperidone or olanzapine for 16 weeks, and psychotic symptoms were assessed with the Schedule for Affective Disorders and Schizophrenia, change version, with psychosis and disorganization items. Psychotic symptoms were assessed at baseline and at weeks 1, 2, 3, 4, 6, 8, 10, 12, 14, and 16. To compute a total symptom score, selected items from the Schedule for Affective Disorders and Schizophrenia were converted to corresponding items on the Brief Psychiatric Rating Scale (BPRS) (25), and a total score for the imputed BPRS was calculated (26). The last observation carried forward method was used for missing data, and the change score from baseline to week 12 was computed as the main phenotype of total symptom reduction after treatment. Week-12 data were chosen to be consistent with three replication cohorts. The patients were of several different continental ancestries, including European, African, and Asian, as well as mixed ancestry.
Three additional cohorts (the European First Episode Schizophrenia Trial [EUFEST] cohort, the Programa Asistencial Fases Iniciales de Psicosisde Cantabria, Spain [PAFIP] cohort, and the Center for Intervention Development and Applied Research [CIDAR] cohort) were used for replication of the findings from the discovery sample. In the EUFEST cohort, patients were randomly assigned to one of five antipsychotics (olanzapine, quetiapine, ziprasidone, amisulpride, and haloperidol) and treated for up to 12 months (27). Symptoms were assessed with the Positive and Negative Syndrome Scale (PANSS) (28). Genomic data were available for 150 patients. All 141 patients of European ancestry were included in the present study, and nine patients from other racial groups were excluded to make the sample more homogeneous. The last observation carried forward method was used for missing data at 3 months. In the PAFIP cohort, patients were treated with aripiprazole, olanzapine, quetiapine, risperidone, or ziprasidone for 12 weeks (29, 30). Data were available for 192 patients with genome-wide genotype data and BPRS ratings at baseline and at week 12. All study subjects were of European ancestry. The third cohort comprised 100 patients from the clinical trial as part of CIDAR at Zucker Hillside Hospital. Patients in this cohort were treated with either risperidone or aripiprazole for 12 weeks, and symptoms were assessed with the BPRS (31). Again, the last observation carried forward method was used for missing data. The patients in this cohort were of various ancestral origins, similar to the patients in the ZHH-FE sample. Demographic data for the four cohorts studied are presented in Table 1.
TABLE 1. Demographic and Descriptive Data for the Four Cohorts Included in the Studya
a
PT=p value threshold.
b
Discovery cohort.
c
Replication cohort.
Open in viewer

Genotyping

DNA was extracted from peripheral lymphocytes, and genotyping was performed using the Illumina Omni-1 Quad (for the ZHH-FE and EUFEST cohorts) or the Illumina Infinium HumanOmniExpressExome platform (for the CIDAR and PAFIP cohorts). Standard quality-control procedures were performed to exclude single-nucleotide polymorphisms (SNPs) with a minor allele frequency <2%, genotyping failure >5%, a Hardy-Weinberg equilibrium p value <10−6, mismatch between recorded and genotyped sex, and related individuals (the relative with the lower call rate was dropped). SNP imputation was conducted with IMPUTE2 (32) against the full 1000 Genomes Project phase 3 reference panel (33). The imputed SNPs underwent another round of quality control, and SNPs with missing data >5% and an imputation information score <0.8 were excluded, resulting in a discovery cohort of 6,143,400 high-quality SNPs. After quality control was completed, the EUFEST, PAFIP, and CIDAR cohorts had 6,863,830, 7,302,869, and 7,302,858 SNPs, respectively. Principle component analysis was conducted for each cohort, and the top three principal component scores were saved for further analysis. All genomic data analysis was performed using SVS software, version 8.7.0 (Golden Helix, Bozeman, Mont.).

PRSs

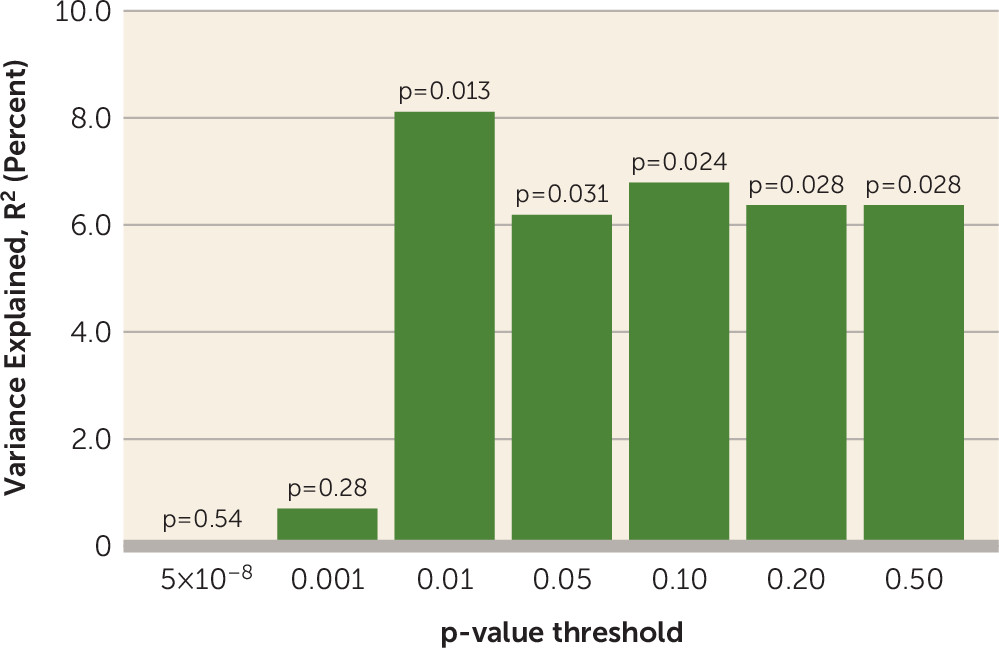
PRSs based on the Psychiatric Genomics Consortium schizophrenia GWAS (1) represent a measure of genetic liability to schizophrenia. The higher an individual’s PRS, the higher his or her risk for developing schizophrenia. The PRS was calculated for each participant in the sample as the weighted sum of the risk allele he or she carried, based on the summary statistics (effect alleles and odds ratios) derived from the clumped Psychiatric Genomics Consortium GWAS results, which consist of 102,636 SNPs. The clumped Psychiatric Genomics Consortium GWAS summary statistics file was downloaded from the LD Hub at the Broad Institute (Cambridge, Mass. [http://ldsc.broadinstitute.org/ldhub]). The clumping parameters are as follows: a SNP will be clumped to a more significant SNP with linkage disequilibrium (r2 ≥0.10) within a 500-kb window, with the major histocompatibility complex region represented by a single SNP. The calculation was conducted for the four cohorts separately by using PRSice software (4). SNPs were selected to be included in the PRS calculation based on their p values in the original Psychiatric Genomics Consortium GWAS. For the discovery cohort (the ZHH-FE cohort), the PRS was calculated at several p value thresholds (PT) based on the original Psychiatric Genomics Consortium GWAS in order to explore which one would maximize the signal of PRS-phenotype association. Specifically, a PT value ≤5×10⁻⁸ and PT values of 0.001, 0.01, 0.05, 0.10, 0.20, and 0.50 were applied to compute seven sets of PRSs for the discovery cohort. The PT with maximum prediction power for the outcome variable in the discovery cohort was then used for computing the PRS for the three replication cohorts. PRS data were approximately normally distributed and converted into z scores for easy interpretation.

Statistical Analysis

The primary phenotype was antipsychotic drug efficacy, defined as symptom reduction from baseline to week 12 or at 3 months. Symptoms were measured using the total score from the BPRS items (derived from the Schedule for Affective Disorders and Schizophrenia, change version, with psychosis and disorganization items) for the ZHH-FE cohort, the total BPRS scores for the PAFIP and CIDAR cohorts, and the total PANSS score for the EUFEST cohort. The 12-week (or 3-month) scores (adjusted for baseline scores, age, and sex) served as the primary dependent variable in a hierarchical linear regression; PRS was the predictor variable. The endpoint score adjusted for the baseline value in a regression analysis is functionally equivalent to the simple change score from baseline to endpoint but is statistically more powerful. Genomic principal component scores were also covaried to control for population stratification in the ZHH-FE and CIDAR cohorts because they consisted of study subjects of various ancestries, whereas the study subjects in the EUFEST and PAFIP cohorts were entirely of European descent. Meta-analysis was performed to combine the effect sizes (partial correlation coefficients) from the three replication cohorts as well as from all four cohorts combined, because each cohort had a relatively small sample size. Although it is not uncommon for replication tests to be reported with one-tailed p values, we report results from two-tailed tests for all analyses for purposes of clarity and to remain conservative in our reporting of significant results. All statistical analyses were performed using SPSS, version 24 (IBM, Armonk, N.Y.).

Results

Discovery Cohort

Among the 77 patients in the ZHH-FE cohort, higher PRSs at a PT value <0.01 and at PT values of 0.05, 0.10, 0.20, and 0.50 significantly predicted poorer response to treatment (i.e., higher symptom scores at the 12-week follow-up), explaining between 6.4% and 8.1% of the total variance in outcome (all p values <0.05) (Figure 1). PRSs at PT values <5×10⁻⁸ and <0.001 were not significant in predicting the symptom change scores (p=0.54 and p=0.28, respectively). PRSs at a PT value <0.01 gave the strongest result in the discovery sample and therefore was used to replicate the findings in the other three cohorts.
FIGURE 1. Polygenic Risk Scores at Different Levels of p-Value Thresholds Explained Percentages of Total Variance in 12-Week Symptom Scores Controlling for Baseline Symptoms and Other Covariates in the Discovery Samplea
a The discovery cohort consisted of 77 patients from the Zucker Hillside Hospital First-Episode schizophrenia trial (ZHH-FE).
Open in viewer

Replication Cohorts and Meta-Analysis

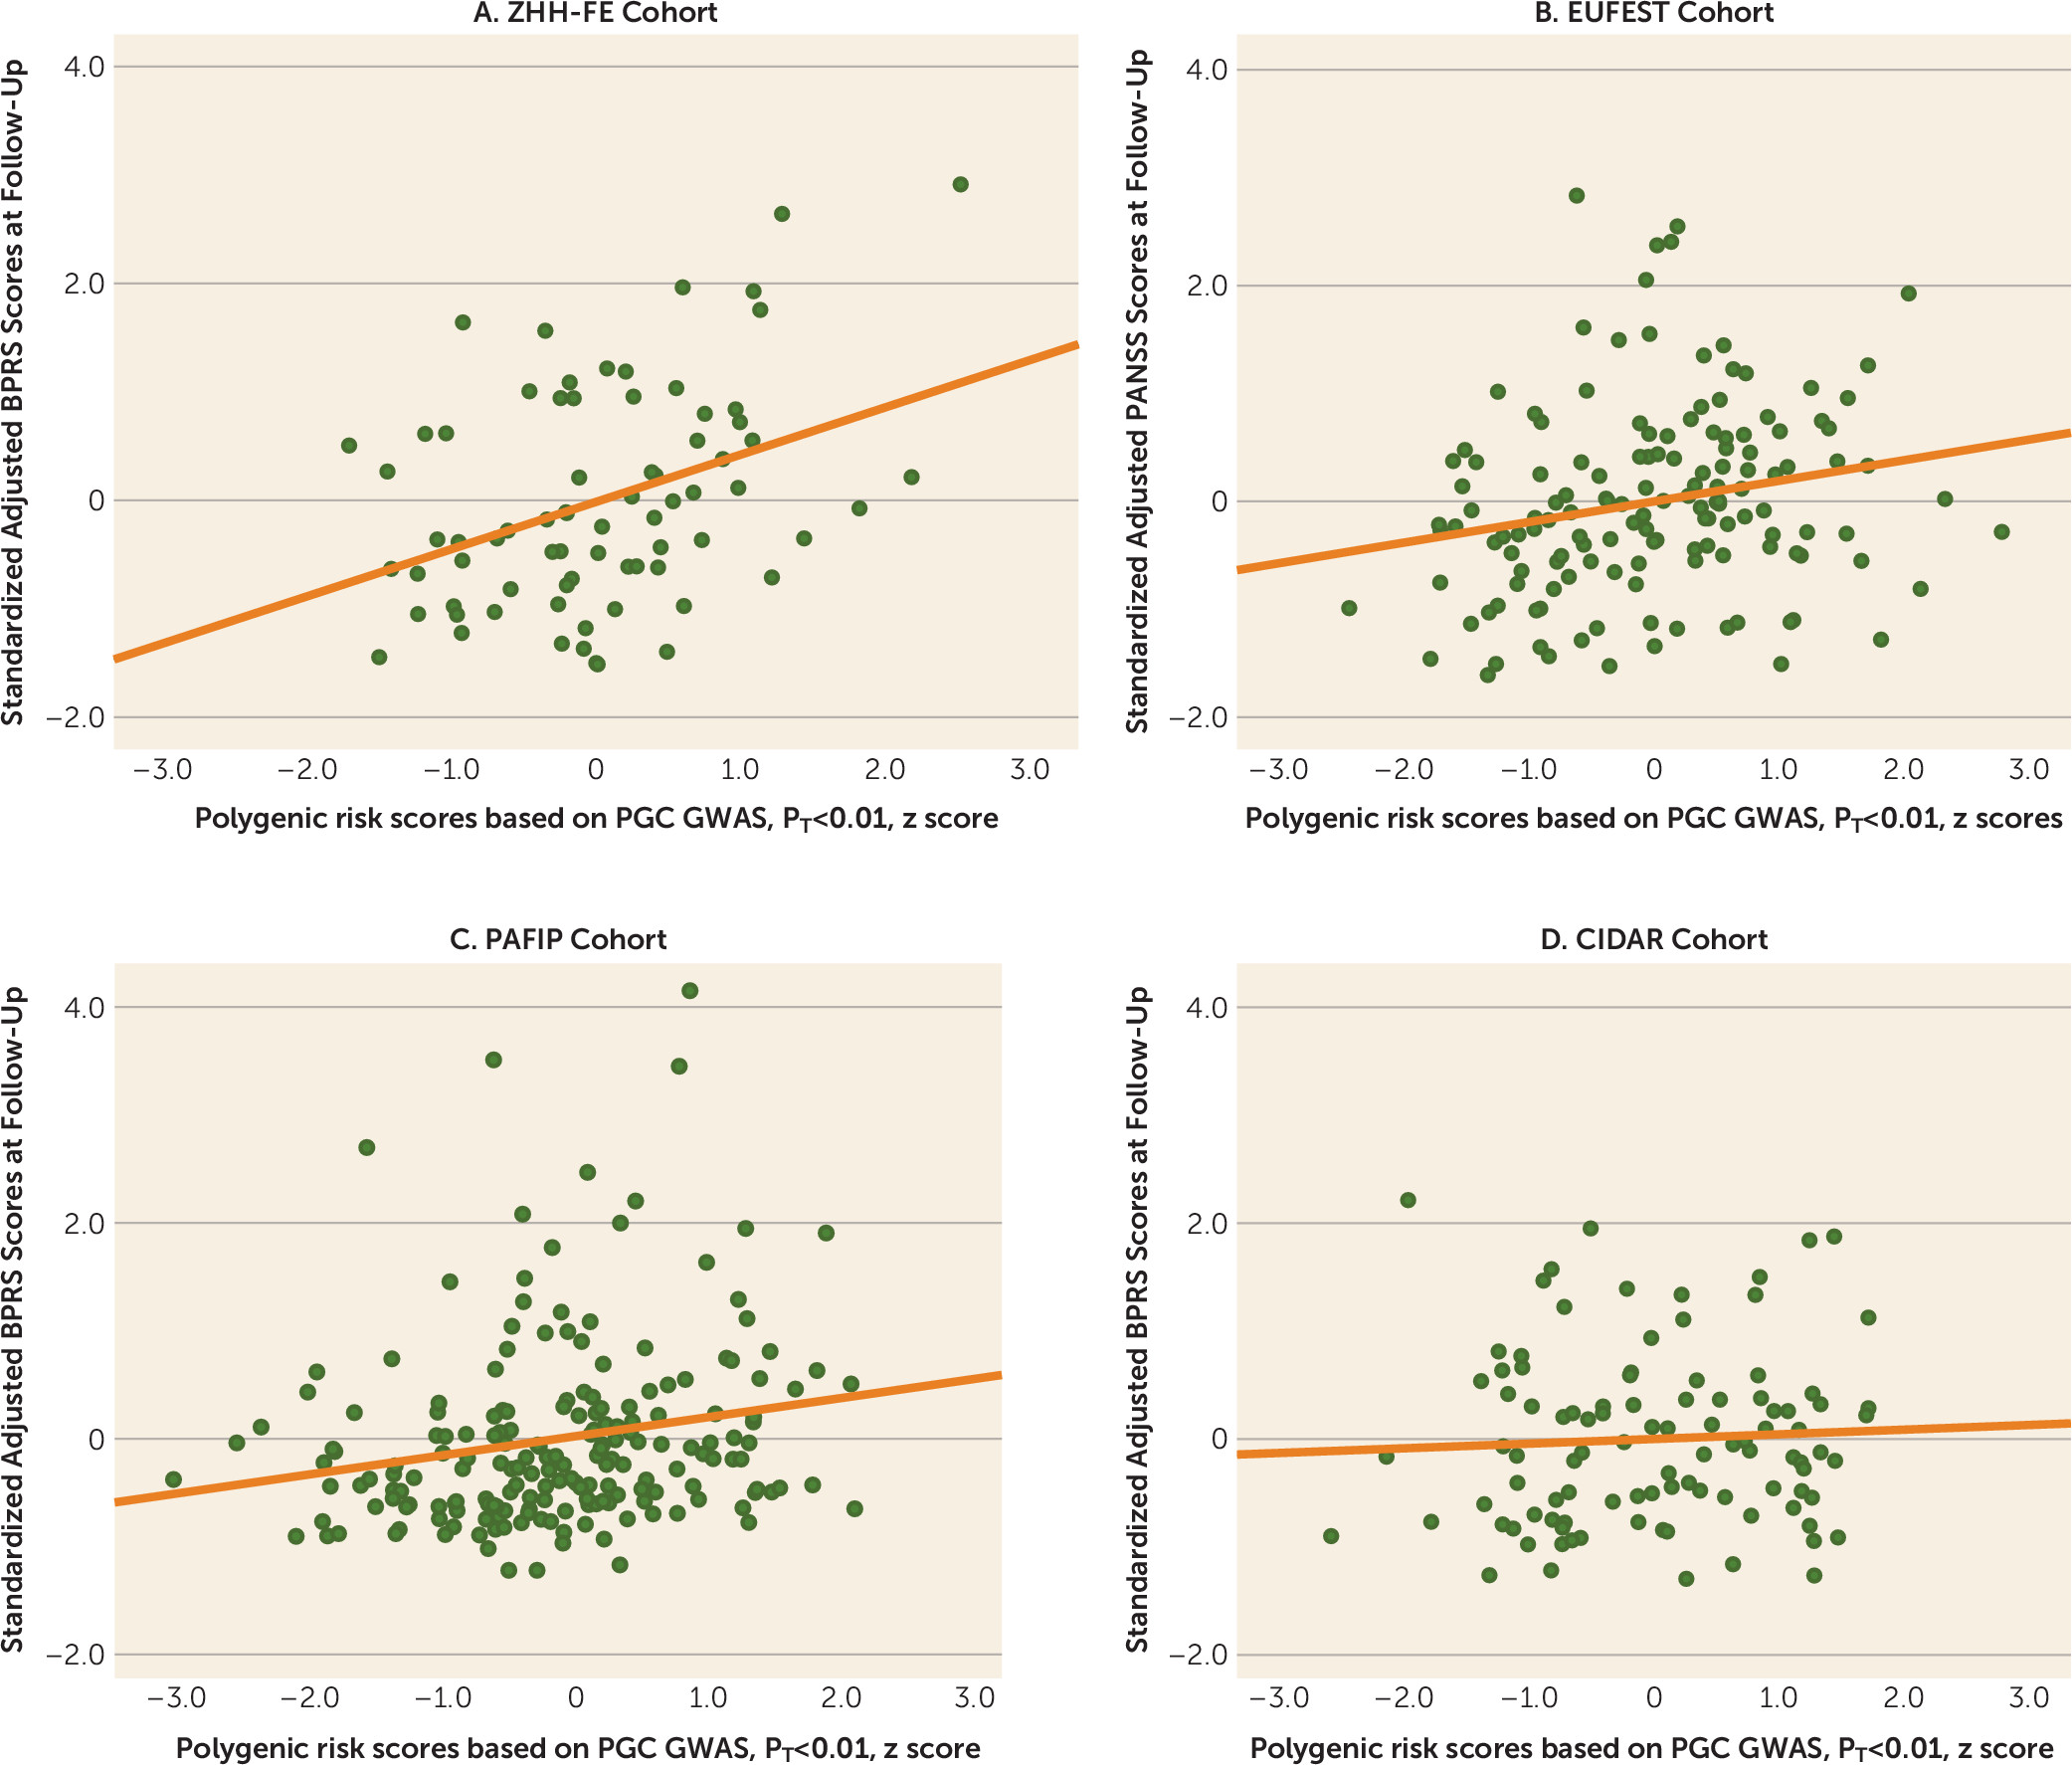
Higher PRSs (at PT values <0.01) significantly predicted worse outcome (i.e., higher symptoms at the 12-week or 3-month follow-up) across the three replication cohorts (pooled partial r=0.15, p=0.019). Moreover, this relationship was statistically significant in the EUFEST and PAFIP cohorts individually, explaining 3.5% and 3.7% of variance, respectively (Table 2). The scatterplots and fitted regression lines of PRSs at a PT value <0.01 on adjusted symptom scores at the 12-week follow-up are presented in Figure 2. Importantly, these results were not simply a function of PRS-related differences in baseline symptoms; PRS was not significantly correlated with baseline total symptoms in any of the four cohorts (p=0.23, p=0.52, p=0.15, and p=0.43, respectively). As an exploratory analysis, PRSs at other p value thresholds were also used to predict antipsychotic efficacy in the same regression model (for further details, see Table S1 in the online supplement).
TABLE 2. Results of Hierarchical Linear Regression Using Polygenic Risk Scores at a p-Value Threshold Set at <0.01 to Predict Symptom Scores at the 12-Week or 3-Month Follow-Upa
CohortNBetaPartial rp (Two-Tailed)R2 Change (%)
Zucker Hillside Hospital First-Episode Schizophrenia trial (ZHH-FE)b770.6800.2930.0138.1
European First Episode Schizophrenia Trial (EUFEST)c1410.1900.2120.0123.5
Programa Asistencial Fases Iniciales de Psicosis de Cantabria, Spain (PAFIP)c1920.1950.1990.0063.7
Center for Intervention Development and Applied Research at Zucker Hillside Hospital clinical trial (CIDAR)c100–0.013–0.005NS0
a
The analysis controlled for age, sex, baseline symptom score, and genomic principal components.
b
Discovery cohort.
c
Replication cohort.
Open in viewer
FIGURE 2. Scatterplots With Linear Regression Lines of Polygenic Risk Scores Predicting Standardized Adjusted Symptom Scores at the 12-Week or 3-Month Follow-Upa
a The analysis controlled for age, sex, baseline symptom score, and genomic principal components. The p value threshold (PT) was set at <0.01. Panel A shows results for the Zucker Hillside Hospital First-Episode (ZHH-FE) schizophrenia trial cohort, which was the discovery cohort. Panel B shows results for the European First Episode Schizophrenia Trial (EUFEST) cohort. Panel C shows results for the Programa Asistencial Fases Iniciales de Psicosis de Cantabria, Spain (PAFIP) cohort. Panel D shows results for the Center for Intervention Development and Applied Research (CIDAR) at Zucker Hillside Hospital cohort. GWAS=genome-wide association study, PGC=Psychiatric Genomics Consortium. The x-axis shows the standardized polygenic risk scores.
Open in viewer
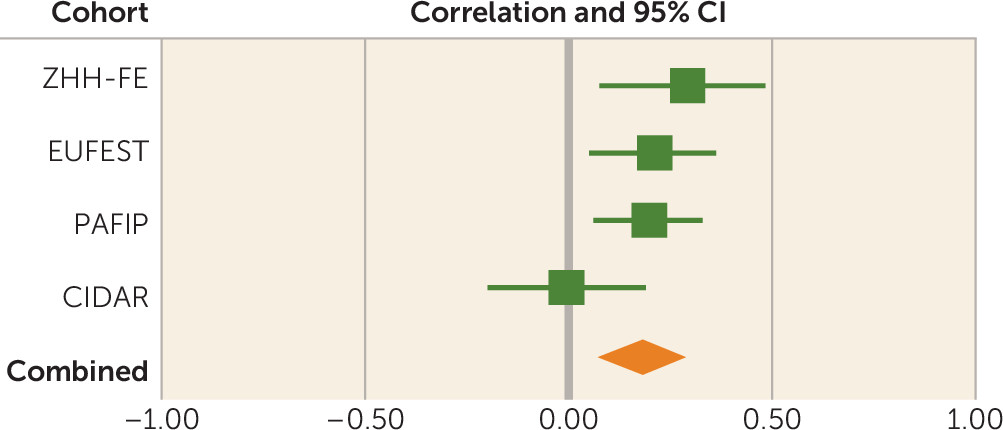
Combining the four cohorts in a meta-analysis with a random-effects model, PRS (at a PT value <0.01) was significantly predictive of 12-week symptom scores (pooled partial correlation coefficient=0.18, p=0.002; total N=510) (Figure 3). Heterogeneity measures for the meta-analysis were conducted (Q=4.68, df=3, p=0.20; I2=36%), indicating relatively homogeneous findings. The overall results remained significant when only individuals of European ancestry were included in the meta-analysis (pooled partial r=0.19, p<0.001; total N=387).
FIGURE 3. Meta-Analysis of the Association Between Polygenic Risk Scores at a p-Value Threshold (PT) set at <0.01 and Symptom Scores at the 12-Week Follow-Up in a Discovery Cohort and Three Replication Cohortsa
a The effect size indicates partial correlation coefficient after controlling for age, sex, baseline symptom score, and genomic principal components. CIDAR=Center for Intervention Development and Applied Research at Zucker Hillside Hospital, EUFEST=European First Episode Schizophrenia Trial, PAFIP=Programa Asistencial Fases Iniciales de Psicosis de Cantabria, Spain, ZHH-FE=Zucker Hillside Hospital First-Episode Schizophrenia trial.
Open in viewer
To test the specificity of schizophrenia PRSs predicting antipsychotic drug response, we repeated the same analysis using PRSs for type 2 diabetes based on the GWAS findings from the DIAGRAM (DIAbetes Genetics Replication And Meta-analysis) consortium (34) and PRSs for human height based on the GWAS findings from the GIANT (Genetic Investigation of Anthropometric Traits) consortium (35). Neither of these polygenic risk scores, at any PT threshold, significantly predicted symptom change in any of the four cohorts (all p values >0.05; mean p=0.69, median p=0.74).
To rule out the potential confounding effects of early dropout, we ran the analysis for completers only in the ZHH-FE cohort, the EUFEST cohort, and the CIDAR cohort excluding study subjects who dropped out before the end of the study. (The PAFIP analysis was already a completers-only analysis based on the original design of the trial.) The results were essentially unchanged.

Clinical Implications

To explore the clinical significance of the above finding, response rate was calculated for each cohort, with the definition of treatment response as ≥50% reduction in total symptoms scores (on either the BPRS or the PANSS) from baseline to the 12-week follow-up. Each cohort was divided into a high PRS group compared with a low PRS group, with a median split. Combining the four cohorts, the response rate was 60.9% (N=154/253) in the low PRS group, compared with 52.1% (N=134/257) in the high PRS group (χ2=3.95, df=1, p=0.047; odds ratio=1.43). Because it was not possible to control for genomic principal components in this categorical analysis, we repeated the analysis for the two cohorts of European ancestry only (i.e., the EUFEST and PAFIP cohorts). Combining these two cohorts, the response rate in the low PRS group was 61.8% (N=102/165), whereas it was 45.8% (N=77/168) in the high PRS group (χ2=8.56, df=1, p=0.0034; odds ratio=1.91). The response rate for each cohort, separated by Caucasians and non-Caucasians, is summarized in Table S2 in the online supplement.

Discussion

In multiple cohorts of first-episode patients with nonaffective psychosis, we found that schizophrenia PRSs were significantly predictive of antipsychotic drug efficacy, with higher PRSs associated with poorer treatment response. These results suggest that polygenic burden may affect severity of illness, in addition to reflecting risk for developing psychosis. To the best of our knowledge, this is the first study to identify replicable effects of PRS in predicting antipsychotic efficacy in patients undergoing initial treatment for a first episode of illness.
Few previous studies have examined the relationship of PRS to treatment response. Consistent with our findings, a cross-sectional study reported significantly higher PRSs among patients with treatment-resistant schizophrenia (as indexed by clozapine treatment and early, insidious onset and poor premorbid social function) compared with patients who had never been prescribed clozapine (17). However, in this same study, clozapine responders had higher schizophrenia polygene scores than nonresponders, suggesting that treatment with clozapine may be an important (and perhaps underutilized) treatment option for patients with high PRSs. A second cross-sectional study reported similar results, with clozapine initiation associated with elevated PRS (18). However, it is noteworthy that results fell short of statistical significance (adjusted hazard ratio=1.23; 95% CI=0.97–1.56), albeit with a smaller sample size (clozapine group, N=105) compared with the previous study (clozapine group, N=434) (17). It is also noteworthy that the association between PRS and clinical outcome was weaker (and nonsignificant) for more broadly defined treatment resistance based on chart history, indicating the importance of prospective studies (18). The only longitudinal study to examine the relationship of PRS to treatment response demonstrated a paradoxical inverse relationship, such that higher scores were associated with greater reduction in symptoms after 6 weeks of treatment with lurasidone (23). It is possible that the ascertainment criteria of this lurasidone clinical trial may have affected results, as patients with treatment-resistant symptoms were explicitly excluded, and patients with good clinical outcomes with standard treatments would not have enrolled in a phase 3 clinical trial of a novel antipsychotic.
Studies of patients in the first episode have the advantage of examining the full range of clinical trajectories of schizophrenia, before patients become lost to research due to either very good or very poor outcomes (22). Only two reports have examined PRS in the context of first-episode psychosis (36, 37). In contrast to the present study, both of these studies included patients with affective as well as nonaffective psychosis, but the results were largely consistent with the present findings. The first study revealed higher schizophrenia PRSs among patients ultimately diagnosed with schizophrenia compared with those with affective psychoses (31). The second study, although longitudinal, did not directly report on treatment-related changes; nevertheless, higher PRS was significantly and positively correlated with PANSS total score after 1 month of treatment (37).
Pharmacogenetic studies of antipsychotic drug response have typically focused on individual genes and SNPs in the candidate gene approach. Although a few genes have been reported to predict antipsychotic efficacy, such as DRD2 (11, 38), HTR2A (39, 40), and genes in the glutamate system (41), most SNPs have had small effect sizes, few have been convincingly replicated (10, 11), and their clinical significance is questionable. Although dopamine D2 receptor antagonism is the common, and probably necessary, mechanism of action for antipsychotic drugs, these agents bind to many different receptors of various neurotransmitters (42), and it is very likely that some of these may be involved in antipsychotic drug response (43). Perhaps more importantly, many of the drug effects may be from downstream reactions within the dopamine signaling pathway. Therefore, the examination of multiple genes is important because this may help capture the potential downstream effects from antipsychotic drugs. In addition, PRS represents the total genetic burden of liability to schizophrenia. Conceivably, higher genetic burden may implicate a broader range of etiopathophysiologic mechanisms, thereby rendering patients less responsive to drug treatment based primarily on a single mechanism of action (dopaminergic blockade). As such, the PRS approach may be useful in both a practical and a theoretical sense in predicting clinical treatment response.
There are several limitations of the present study. PRS is a weighted sum of risk alleles that an individual carries. Many of the SNPs included in PRS may not be relevant to antipsychotic drug response, and inclusion of these could dilute the signal. We observed that statistical association was generally significant by using PRS PT values ≥0.01, suggesting that thousands of SNPs are required in order to saturate the relevant signal, whereas use of only SNPs attaining genome-wide significance in the Psychiatric Genomics Consortium schizophrenia GWAS was insufficient to capture this variance. However, we currently do not have sufficient biological knowledge or statistical techniques to ascertain which SNPs are relevant and which are contributing noise. In addition, the four cohorts of patients examined in the present study were treated with various antipsychotic drugs that could increase the heterogeneity in outcomes, thereby decreasing our ability to detect significant signals. In the future, a very large sample of patients with first-episode psychosis undergoing a single drug treatment would be required to discover which genetic variants are involved in antipsychotic drug response. Finally, PRS was not predictive of antipsychotic treatment response in the CIDAR cohort. If the true effect size is most accurately reflected in the meta-analytic result (r=0.18), then a sample with 100 study subjects (such as the CIDAR cohort) would only have a power of 0.42 to detect a significant effect. Therefore, the failure to replicate in the CIDAR cohort was most likely due to chance variation, possibly exacerbated by the multiethnic nature of the sample. It is noteworthy that the overall pooled effect size was within the 95% confidence interval of the effect size in the CIDAR cohort, and thus this sample is not truly an outlier. At the same time, the effect size observed in the initial discovery cohort (the ZHH-FE sample) was substantially larger than the effect sizes in the remaining cohorts, perhaps reflective of the “winner’s curse.” Given these variable results, it is noteworthy that the meta-analytic effect size (3.24%) was comparable to the effect sizes of the two largest, and most homogeneous, studies (3.5%−3.7%).
Future studies with larger samples may also result in the ability to identify a PRS cutoff with sufficient explanatory power to attain clinical utility. In the present study, we observed an odds ratio of nearly 2 for dichotomized treatment response among patients with low PRSs compared with patients with high PRSs. Although this effect size is insufficient to guide clinical decision making, a recent large-scale study of PRS in bipolar disorder demonstrated how modest effect sizes may still allow clinical utility at the extremes (44). With a sample size of 2,586 patients, the International Consortium on Lithium Genetics was able to divide a cohort into deciles on the basis of PRS, whereas the present study was limited to a median split due to relatively smaller sample size. In the International Consortium on Lithium Genetics study, patients with bipolar disorder in the lowest decile of schizophrenia PRS had a nearly 3.5-fold better response rate to lithium compared with patients in the highest decile of PRS. Median split of the International Consortium on Lithium Genetics data would have provided an odds ratio of only 1.68, which is weaker than that observed in the present study. Given the linear relationships observed in the present study (Figure 2), it is reasonable to hypothesize that a larger sample size could provide an upper cutoff with strong prognostic ability. In this regard, PRS may ultimately be a more flexible and powerful biomarker than individual SNPs, which only permit three genotypic classifications. However, if greater schizophrenia polygenic burden is associated with poorer response to all conventional treatments, enhanced use of clozapine or novel therapeutic approaches (45) will be even more urgently needed for this subpopulation.
Footnote

Dr. Zhang has received grant support from the Brain and Behavioral Research Foundation, Genomind, and NIMH. Dr. Robinson has served as a consultant to Asubio, Costello Medical Consulting, Innovative Science Solutions, Janssen, Neurocrine, Otsuka, and Shire; and he has received research support from Otsuka. Dr. Fleischhacker has received grant support from AstraZeneca, Boehringer-Ingelheim, Janssen, Lundbeck, Otsuka, Pfizer, and Sanofi; he has served on advisory panels for Boehringer-Ingelheim, Dainippon Sumitomo Pharma, Janssen, Lundbeck, Otsuka, Richter Gedeon, and Teva; and he has received speaker’s honoraria from Janssen, Lundbeck, Otsuka, and Recordati. Dr. Kahn has received honoraria from Alkermes, Gedeon Richter, Janssen-Cilag, Lundbeck, and Minerva Neuroscience. Dr. Crespo-Facorro has received research support from the Ministerio de Ciencia e Innovación, Madrid; he has received speaker’s honoraria from Johnson and Johnson, Lundbeck, and Otsuka; and he has served as an advisor or consultant to and received honoraria from Alkermes, Casen Recordati, Lundbeck, Otsuka, and Teva. Dr. Kane has served as a consultant to or received honoraria from Alkermes, Eli Lilly, EnVivo Pharmaceuticals (Forum), Forest (Allergan), Genentech, H. Lundbeck, Intracellular Therapies, Janssen Pharmaceutica, Johnson and Johnson, Neurocrine, Otsuka, Pierre Fabre, Reviva, Roche, Sunovion, Takeda, and Teva; he has received grant support from Janssen and Otsuka; he has served on advisory boards for Alkermes, Intracellular Therapies, Lundbeck, Neurocrine, Otsuka, Pierre Fabre, Takeda, and Teva; and he is a shareholder with LB Pharmaceuticals, MedAvante, and Vanguard Research Group. Dr. Malhotra has received grant support from NIMH and has served as a consultant to Concert Pharma and Genomind and on the advisory board for InformedDNA. Dr. Lencz has served as a consultant to Genomind and has received grant support from the Brain and Behavioral Research Foundation, NIMH, and the U.S.-Israel Binational Science Foundation. The other authors report no financial relationships with commercial interests.

Supplementary Material

File (appi.ajp.2018.17121363.ds001.pdf)

References

2.
Sullivan PF, Agrawal A, Bulik CM, et al:. Psychiatric genomics: an update and an agenda. Am J Psychiatry 2018; 175:15–27
3.
Purcell SM, Wray NR, Stone JL, et al: Common polygenic variation contributes to risk of schizophrenia and bipolar disorder. Nature 2009; 460:748–752
4.
Euesden J, Lewis CM, O’Reilly PF: PRSice: Polygenic Risk Score software. Bioinformatics 2015; 31:1466–1468
5.
Lee SH, Goddard ME, Wray NR, et al: A better coefficient of determination for genetic profile analysis. Genet Epidemiol 2012; 36:214–224
6.
Kahn RS, Sommer IE, Murray RM, et al: Schizophrenia. Nat Rev Dis Primers 2015; 1:15067
7.
Zhang JP: The benefits of antipsychotic drugs: symptom control and improved quality of life, in Life Threatening Effects of Antipsychotic Drugs. Edited by Manu P, Flanagan RJ, Ronaldson KJ. London, Elsevier, 2016, pp 295–309
8.
Conley RR, Kelly DL: Management of treatment resistance in schizophrenia. Biol Psychiatry 2001; 50:898–911
9.
Lieberman JA, Stroup TS, McEvoy JP, et al: Effectiveness of antipsychotic drugs in patients with chronic schizophrenia. N Engl J Med 2005; 353:1209–1223
10.
Zhang J-P, Malhotra AK: Pharmacogenetics and antipsychotics: therapeutic efficacy and side effects prediction. Expert Opin Drug Metab Toxicol 2011; 7:9–37
11.
Zhang JP, Lencz T, Malhotra AK: D2 receptor genetic variation and clinical response to antipsychotic drug treatment: a meta-analysis. Am J Psychiatry 2010; 167:763–772
12.
Huang E, Zai CC, Lisoway A, et al: Catechol-O-methyltransferase Val158Met polymorphism and clinical response to antipsychotic treatment in schizophrenia and schizo-affective disorder patients: a meta-analysis. Int J Neuropsychopharmacol 2016; 19:pyv132. Available at doi:
13.
Zhang J-P, Malhotra AK: Pharmacogenomics of antipsychotic drugs. Curr Treat Options Psychiatry 2017; 4:127–138
14.
Crespo-Facorro B, de la Foz VO, Ayesa-Arriola R, et al: Prediction of acute clinical response following a first episode of non affective psychosis: results of a cohort of 375 patients from the Spanish PAFIP study. Prog Neuropsychopharmacol Biol Psychiatry 2013; 44:162–167
15.
Hassan AN, De Luca V: The effect of lifetime adversities on resistance to antipsychotic treatment in schizophrenia patients. Schizophr Res 2015; 161:496–500
16.
Seibert TM, Fan CC, Wang Y, et al: Polygenic hazard score to guide screening for aggressive prostate cancer: development and validation in large scale cohorts. BMJ 2018; 360:j5757
17.
Frank J, Lang M, Witt SH, et al: Identification of increased genetic risk scores for schizophrenia in treatment-resistant patients. Mol Psychiatry 2015; 20:150–151
18.
Wimberley T, Gasse C, Meier SM, et al: Polygenic risk score for schizophrenia and treatment-resistant schizophrenia. Schizophr Bull 2017; 43:1064–1069
19.
Zhang JP, Lencz T, Geisler S, et al: Genetic variation in BDNF is associated with antipsychotic treatment resistance in patients with schizophrenia. Schizophr Res 2013; 146:285–288
20.
Cargnin S, Massarotti A, Terrazzino S: BDNF Val66Met and clinical response to antipsychotic drugs: a systematic review and meta-analysis. Eur Psychiatry 2016; 33:45–53
21.
Zhang JP, Lencz T, Zhang RX, et al: Pharmacogenetic associations of antipsychotic drug-related weight gain: a systematic review and meta-analysis. Schizophr Bull 2016; 42:1418–1437
22.
Malhotra AK, Zhang JP, Lencz T: Pharmacogenetics in psychiatry: translating research into clinical practice. Mol Psychiatry 2012; 17:760–769
23.
Li J, Yoshikawa A, Brennan MD, et al: Genetic predictors of antipsychotic response to lurasidone identified in a genome wide association study and by schizophrenia risk genes. Schizophr Res 2018; 192:194–204
24.
Robinson DG, Woerner MG, Napolitano B, et al: Randomized comparison of olanzapine versus risperidone for the treatment of first-episode schizophrenia: 4-month outcomes. Am J Psychiatry 2006; 163:2096–2102
25.
Overall JE, Gorham DR: The Brief Psychiatric Rating Scale. Psychol Rep 1962; 10:799–812
26.
Gallego JA, Robinson DG, Sevy SM, et al: Time to treatment response in first-episode schizophrenia: should acute treatment trials last several months? J Clin Psychiatry 2011; 72:1691–1696
27.
Kahn RS, Fleischhacker WW, Boter H, et al: Effectiveness of antipsychotic drugs in first-episode schizophrenia and schizophreniform disorder: an open randomised clinical trial. Lancet 2008; 371:1085–1097
28.
Guy W: ECDEU Assessment Manual for Psychopharmacology (US Department of Health, Education, and Welfare Publication ADM 76–338). Washington, DC, National Institute of Mental Health, 1976, pp 217–222
29.
Crespo-Facorro B, Pérez-Iglesias R, Ramirez-Bonilla M, et al: A practical clinical trial comparing haloperidol, risperidone, and olanzapine for the acute treatment of first-episode nonaffective psychosis. J Clin Psychiatry 2006; 67:1511–1521
30.
Crespo-Facorro B, Ortiz-García de la Foz V, Mata I, et al: Aripiprazole, ziprasidone and quetiapine in the treatment of first-episode nonaffective psychosis: a 12-week randomized, flexible-dose, open-label trial. Schizophr Res 2013; 147:375–382
31.
Robinson DG, Gallego JA, John M, et al: A randomized comparison of aripiprazole and risperidone for the acute treatment of first-episode schizophrenia and related disorders: 3-month outcomes. Schizophr Bull 2015; 41:1227–1236
32.
Howie BN, Donnelly P, Marchini J: A flexible and accurate genotype imputation method for the next generation of genome-wide association studies. PLoS Genet 2009; 5:e1000529
33.
Abecasis GR, Auton A, Brooks LD, et al: An integrated map of genetic variation from 1,092 human genomes. Nature 2012; 491:56–65
34.
Morris AP, Voight BF, Teslovich TM, et al: Large-scale association analysis provides insights into the genetic architecture and pathophysiology of type 2 diabetes. Nat Genet 2012; 44:981–990
35.
Lango Allen H, Estrada K, Lettre G, et al: Hundreds of variants clustered in genomic loci and biological pathways affect human height. Nature 2010; 467:832–838
36.
Vassos E, Di Forti M, Coleman J, et al: An examination of polygenic score risk prediction in individuals with first-episode psychosis. Biol Psychiatry 2017; 81:470–477
37.
Sengupta SM, MacDonald K, Fathalli F, et al: Polygenic risk score associated with specific symptom dimensions in first-episode psychosis. Schizophr Res 2017; 184:116–121
38.
Zhang JP, Robinson DG, Gallego JA, et al: Association of a schizophrenia risk variant at the DRD2 locus with antipsychotic treatment response in first-episode psychosis. Schizophr Bull 2015; 41:1248–1255
39.
Arranz MJ, Munro J, Sham P, et al: Meta-analysis of studies on genetic variation in 5-HT2A receptors and clozapine response. Schizophr Res 1998; 32:93–99
40.
Chen SF, Shen YC, Chen CH: HTR2A A-1438G/T102C polymorphisms predict negative symptoms performance upon aripiprazole treatment in schizophrenic patients. Psychopharmacology (Berl) 2009; 205:285–292
41.
Stevenson JM, Reilly JL, Harris MS, et al: Antipsychotic pharmacogenomics in first episode psychosis: a role for glutamate genes. Transl Psychiatry 2016; 6:e739
42.
Miyamoto S, Duncan GE, Marx CE, et al: Treatments for schizophrenia: a critical review of pharmacology and mechanisms of action of antipsychotic drugs. Mol Psychiatry 2005; 10:79–104
43.
Ruderfer DM, Charney AW, Readhead B, et al: Polygenic overlap between schizophrenia risk and antipsychotic response: a genomic medicine approach. Lancet Psychiatry 2016; 3:350–357
44.
International Consortium on Lithium Genetics (ConLi+Gen), Amare AT, Schubert KO, Hou L, et al: Association of polygenic score for schizophrenia and HLA antigen and inflammation genes with response to lithium in bipolar affective disorder: a genome-wide association study. JAMA Psychiatry 2017
45.
Petrides G, Malur C, Braga RJ, et al: Electroconvulsive therapy augmentation in clozapine-resistant schizophrenia: a prospective, randomized study. Am J Psychiatry 2015; 172:52–58

Information & Authors

Information

Published In

Go to American Journal of Psychiatry
American Journal of Psychiatry
Pages: 21 - 28
PubMed: 30392411

History

Received: 15 December 2017
Revision received: 7 May 2018
Revision received: 2 July 2018
Revision received: 18 July 2018
Accepted: 27 July 2018
Published online: 5 November 2018
Published in print: January 01, 2019

Keywords

  1. Polygenic Risk Score
  2. Schizophrenia
  3. Antipsychotics
  4. First Episode Psychosis

Authors

Details

Notes

Address correspondence to Dr. Zhang (jzhang1@northwell.edu).

Funding Information

National Institute of Mental Health10.13039/100000025: K23MH097108, P30MH090590, P50MH080173, R21MH099868
Brain and Behavior Research Foundation10.13039/100000874
Supported in part by NIH (grant K23MH097108 to Dr. Zhang, grant R21MH099868 to Dr. Lencz, grant P30MH090590 to Dr. Kane, and grant P50MH080173 to Dr. Malhotra) and by NARSAD Young Investigator grants from the Brain and Behavior Research Foundation (to Dr. Zhang).

Metrics & Citations

Metrics

Citations

Export Citations

If you have the appropriate software installed, you can download article citation data to the citation manager of your choice. Simply select your manager software from the list below and click Download.

For more information or tips please see 'Downloading to a citation manager' in the Help menu.

Format
Citation style
Style
Copy to clipboard

View Options

View options

PDF/EPUB

View PDF/EPUB

Media

Figures

FIGURE 1. Polygenic Risk Scores at Different Levels of p-Value Thresholds Explained Percentages of Total Variance in 12-Week Symptom Scores Controlling for Baseline Symptoms and Other Covariates in the Discovery Samplea
a The discovery cohort consisted of 77 patients from the Zucker Hillside Hospital First-Episode schizophrenia trial (ZHH-FE).
FIGURE 2. Scatterplots With Linear Regression Lines of Polygenic Risk Scores Predicting Standardized Adjusted Symptom Scores at the 12-Week or 3-Month Follow-Upa
a The analysis controlled for age, sex, baseline symptom score, and genomic principal components. The p value threshold (PT) was set at <0.01. Panel A shows results for the Zucker Hillside Hospital First-Episode (ZHH-FE) schizophrenia trial cohort, which was the discovery cohort. Panel B shows results for the European First Episode Schizophrenia Trial (EUFEST) cohort. Panel C shows results for the Programa Asistencial Fases Iniciales de Psicosis de Cantabria, Spain (PAFIP) cohort. Panel D shows results for the Center for Intervention Development and Applied Research (CIDAR) at Zucker Hillside Hospital cohort. GWAS=genome-wide association study, PGC=Psychiatric Genomics Consortium. The x-axis shows the standardized polygenic risk scores.
FIGURE 3. Meta-Analysis of the Association Between Polygenic Risk Scores at a p-Value Threshold (PT) set at <0.01 and Symptom Scores at the 12-Week Follow-Up in a Discovery Cohort and Three Replication Cohortsa
a The effect size indicates partial correlation coefficient after controlling for age, sex, baseline symptom score, and genomic principal components. CIDAR=Center for Intervention Development and Applied Research at Zucker Hillside Hospital, EUFEST=European First Episode Schizophrenia Trial, PAFIP=Programa Asistencial Fases Iniciales de Psicosis de Cantabria, Spain, ZHH-FE=Zucker Hillside Hospital First-Episode Schizophrenia trial.

Other

Tables

TABLE 1. Demographic and Descriptive Data for the Four Cohorts Included in the Studya
TABLE 2. Results of Hierarchical Linear Regression Using Polygenic Risk Scores at a p-Value Threshold Set at <0.01 to Predict Symptom Scores at the 12-Week or 3-Month Follow-Upa

Share

Share

Share article link

Share

References

References

2.
Sullivan PF, Agrawal A, Bulik CM, et al:. Psychiatric genomics: an update and an agenda. Am J Psychiatry 2018; 175:15–27
3.
Purcell SM, Wray NR, Stone JL, et al: Common polygenic variation contributes to risk of schizophrenia and bipolar disorder. Nature 2009; 460:748–752
4.
Euesden J, Lewis CM, O’Reilly PF: PRSice: Polygenic Risk Score software. Bioinformatics 2015; 31:1466–1468
5.
Lee SH, Goddard ME, Wray NR, et al: A better coefficient of determination for genetic profile analysis. Genet Epidemiol 2012; 36:214–224
6.
Kahn RS, Sommer IE, Murray RM, et al: Schizophrenia. Nat Rev Dis Primers 2015; 1:15067
7.
Zhang JP: The benefits of antipsychotic drugs: symptom control and improved quality of life, in Life Threatening Effects of Antipsychotic Drugs. Edited by Manu P, Flanagan RJ, Ronaldson KJ. London, Elsevier, 2016, pp 295–309
8.
Conley RR, Kelly DL: Management of treatment resistance in schizophrenia. Biol Psychiatry 2001; 50:898–911
9.
Lieberman JA, Stroup TS, McEvoy JP, et al: Effectiveness of antipsychotic drugs in patients with chronic schizophrenia. N Engl J Med 2005; 353:1209–1223
10.
Zhang J-P, Malhotra AK: Pharmacogenetics and antipsychotics: therapeutic efficacy and side effects prediction. Expert Opin Drug Metab Toxicol 2011; 7:9–37
11.
Zhang JP, Lencz T, Malhotra AK: D2 receptor genetic variation and clinical response to antipsychotic drug treatment: a meta-analysis. Am J Psychiatry 2010; 167:763–772
12.
Huang E, Zai CC, Lisoway A, et al: Catechol-O-methyltransferase Val158Met polymorphism and clinical response to antipsychotic treatment in schizophrenia and schizo-affective disorder patients: a meta-analysis. Int J Neuropsychopharmacol 2016; 19:pyv132. Available at doi:
13.
Zhang J-P, Malhotra AK: Pharmacogenomics of antipsychotic drugs. Curr Treat Options Psychiatry 2017; 4:127–138
14.
Crespo-Facorro B, de la Foz VO, Ayesa-Arriola R, et al: Prediction of acute clinical response following a first episode of non affective psychosis: results of a cohort of 375 patients from the Spanish PAFIP study. Prog Neuropsychopharmacol Biol Psychiatry 2013; 44:162–167
15.
Hassan AN, De Luca V: The effect of lifetime adversities on resistance to antipsychotic treatment in schizophrenia patients. Schizophr Res 2015; 161:496–500
16.
Seibert TM, Fan CC, Wang Y, et al: Polygenic hazard score to guide screening for aggressive prostate cancer: development and validation in large scale cohorts. BMJ 2018; 360:j5757
17.
Frank J, Lang M, Witt SH, et al: Identification of increased genetic risk scores for schizophrenia in treatment-resistant patients. Mol Psychiatry 2015; 20:150–151
18.
Wimberley T, Gasse C, Meier SM, et al: Polygenic risk score for schizophrenia and treatment-resistant schizophrenia. Schizophr Bull 2017; 43:1064–1069
19.
Zhang JP, Lencz T, Geisler S, et al: Genetic variation in BDNF is associated with antipsychotic treatment resistance in patients with schizophrenia. Schizophr Res 2013; 146:285–288
20.
Cargnin S, Massarotti A, Terrazzino S: BDNF Val66Met and clinical response to antipsychotic drugs: a systematic review and meta-analysis. Eur Psychiatry 2016; 33:45–53
21.
Zhang JP, Lencz T, Zhang RX, et al: Pharmacogenetic associations of antipsychotic drug-related weight gain: a systematic review and meta-analysis. Schizophr Bull 2016; 42:1418–1437
22.
Malhotra AK, Zhang JP, Lencz T: Pharmacogenetics in psychiatry: translating research into clinical practice. Mol Psychiatry 2012; 17:760–769
23.
Li J, Yoshikawa A, Brennan MD, et al: Genetic predictors of antipsychotic response to lurasidone identified in a genome wide association study and by schizophrenia risk genes. Schizophr Res 2018; 192:194–204
24.
Robinson DG, Woerner MG, Napolitano B, et al: Randomized comparison of olanzapine versus risperidone for the treatment of first-episode schizophrenia: 4-month outcomes. Am J Psychiatry 2006; 163:2096–2102
25.
Overall JE, Gorham DR: The Brief Psychiatric Rating Scale. Psychol Rep 1962; 10:799–812
26.
Gallego JA, Robinson DG, Sevy SM, et al: Time to treatment response in first-episode schizophrenia: should acute treatment trials last several months? J Clin Psychiatry 2011; 72:1691–1696
27.
Kahn RS, Fleischhacker WW, Boter H, et al: Effectiveness of antipsychotic drugs in first-episode schizophrenia and schizophreniform disorder: an open randomised clinical trial. Lancet 2008; 371:1085–1097
28.
Guy W: ECDEU Assessment Manual for Psychopharmacology (US Department of Health, Education, and Welfare Publication ADM 76–338). Washington, DC, National Institute of Mental Health, 1976, pp 217–222
29.
Crespo-Facorro B, Pérez-Iglesias R, Ramirez-Bonilla M, et al: A practical clinical trial comparing haloperidol, risperidone, and olanzapine for the acute treatment of first-episode nonaffective psychosis. J Clin Psychiatry 2006; 67:1511–1521
30.
Crespo-Facorro B, Ortiz-García de la Foz V, Mata I, et al: Aripiprazole, ziprasidone and quetiapine in the treatment of first-episode nonaffective psychosis: a 12-week randomized, flexible-dose, open-label trial. Schizophr Res 2013; 147:375–382
31.
Robinson DG, Gallego JA, John M, et al: A randomized comparison of aripiprazole and risperidone for the acute treatment of first-episode schizophrenia and related disorders: 3-month outcomes. Schizophr Bull 2015; 41:1227–1236
32.
Howie BN, Donnelly P, Marchini J: A flexible and accurate genotype imputation method for the next generation of genome-wide association studies. PLoS Genet 2009; 5:e1000529
33.
Abecasis GR, Auton A, Brooks LD, et al: An integrated map of genetic variation from 1,092 human genomes. Nature 2012; 491:56–65
34.
Morris AP, Voight BF, Teslovich TM, et al: Large-scale association analysis provides insights into the genetic architecture and pathophysiology of type 2 diabetes. Nat Genet 2012; 44:981–990
35.
Lango Allen H, Estrada K, Lettre G, et al: Hundreds of variants clustered in genomic loci and biological pathways affect human height. Nature 2010; 467:832–838
36.
Vassos E, Di Forti M, Coleman J, et al: An examination of polygenic score risk prediction in individuals with first-episode psychosis. Biol Psychiatry 2017; 81:470–477
37.
Sengupta SM, MacDonald K, Fathalli F, et al: Polygenic risk score associated with specific symptom dimensions in first-episode psychosis. Schizophr Res 2017; 184:116–121
38.
Zhang JP, Robinson DG, Gallego JA, et al: Association of a schizophrenia risk variant at the DRD2 locus with antipsychotic treatment response in first-episode psychosis. Schizophr Bull 2015; 41:1248–1255
39.
Arranz MJ, Munro J, Sham P, et al: Meta-analysis of studies on genetic variation in 5-HT2A receptors and clozapine response. Schizophr Res 1998; 32:93–99
40.
Chen SF, Shen YC, Chen CH: HTR2A A-1438G/T102C polymorphisms predict negative symptoms performance upon aripiprazole treatment in schizophrenic patients. Psychopharmacology (Berl) 2009; 205:285–292
41.
Stevenson JM, Reilly JL, Harris MS, et al: Antipsychotic pharmacogenomics in first episode psychosis: a role for glutamate genes. Transl Psychiatry 2016; 6:e739
42.
Miyamoto S, Duncan GE, Marx CE, et al: Treatments for schizophrenia: a critical review of pharmacology and mechanisms of action of antipsychotic drugs. Mol Psychiatry 2005; 10:79–104
43.
Ruderfer DM, Charney AW, Readhead B, et al: Polygenic overlap between schizophrenia risk and antipsychotic response: a genomic medicine approach. Lancet Psychiatry 2016; 3:350–357
44.
International Consortium on Lithium Genetics (ConLi+Gen), Amare AT, Schubert KO, Hou L, et al: Association of polygenic score for schizophrenia and HLA antigen and inflammation genes with response to lithium in bipolar affective disorder: a genome-wide association study. JAMA Psychiatry 2017
45.
Petrides G, Malur C, Braga RJ, et al: Electroconvulsive therapy augmentation in clozapine-resistant schizophrenia: a prospective, randomized study. Am J Psychiatry 2015; 172:52–58
View figure
FIGURE 1
FIGURE 1. Polygenic Risk Scores at Different Levels of p-Value Thresholds Explained Percentages of Total Variance in 12-Week Symptom Scores Controlling for Baseline Symptoms and Other Covariates in the Discovery Samplea
a The discovery cohort consisted of 77 patients from the Zucker Hillside Hospital First-Episode schizophrenia trial (ZHH-FE).
View figure
FIGURE 2
FIGURE 2. Scatterplots With Linear Regression Lines of Polygenic Risk Scores Predicting Standardized Adjusted Symptom Scores at the 12-Week or 3-Month Follow-Upa
a The analysis controlled for age, sex, baseline symptom score, and genomic principal components. The p value threshold (PT) was set at <0.01. Panel A shows results for the Zucker Hillside Hospital First-Episode (ZHH-FE) schizophrenia trial cohort, which was the discovery cohort. Panel B shows results for the European First Episode Schizophrenia Trial (EUFEST) cohort. Panel C shows results for the Programa Asistencial Fases Iniciales de Psicosis de Cantabria, Spain (PAFIP) cohort. Panel D shows results for the Center for Intervention Development and Applied Research (CIDAR) at Zucker Hillside Hospital cohort. GWAS=genome-wide association study, PGC=Psychiatric Genomics Consortium. The x-axis shows the standardized polygenic risk scores.
View figure
FIGURE 3
FIGURE 3. Meta-Analysis of the Association Between Polygenic Risk Scores at a p-Value Threshold (PT) set at <0.01 and Symptom Scores at the 12-Week Follow-Up in a Discovery Cohort and Three Replication Cohortsa
a The effect size indicates partial correlation coefficient after controlling for age, sex, baseline symptom score, and genomic principal components. CIDAR=Center for Intervention Development and Applied Research at Zucker Hillside Hospital, EUFEST=European First Episode Schizophrenia Trial, PAFIP=Programa Asistencial Fases Iniciales de Psicosis de Cantabria, Spain, ZHH-FE=Zucker Hillside Hospital First-Episode Schizophrenia trial.
TABLE 1
TABLE 1. Demographic and Descriptive Data for the Four Cohorts Included in the Studya
TABLE 2
TABLE 2. Results of Hierarchical Linear Regression Using Polygenic Risk Scores at a p-Value Threshold Set at <0.01 to Predict Symptom Scores at the 12-Week or 3-Month Follow-Upa