Full access
Articles
Published Online: 30 August 2023

Genetic Contribution to the Heterogeneity of Major Depressive Disorder: Evidence From a Sibling-Based Design Using Swedish National Registers

Publication: American Journal of Psychiatry

Abstract

Objective:

Major depressive disorder (MDD) is highly heterogeneous. Standard typology partly captures the disorder’s symptomatic heterogeneity, although whether it adequately captures etiological heterogeneity remains elusive. The aim of this study was to investigate the genetic characterization of MDD heterogeneity.

Methods:

Using Swedish patient register data on 1.5 million individuals, the authors identified 46,255 individuals with specialist-diagnosed MDD. Eighteen subgroups were identified based on nine comparison groups defined by clinical and psychosocial features, including severity, recurrence, comorbidities, suicidality, impairment, disability, care unit, and age at diagnosis. A sibling-based design and classic quantitative genetic models were applied to estimate heritability of MDD subgroups and genetic correlations between subgroups.

Results:

Estimates of heritability ranged from 30.5% to 58.3% across subgroups. The disabled and youth-onset subgroups showed significantly higher heritability (55.1%–58.3%) than the overall MDD sample (45.3%, 95% CI=43.0–47.5), and the subgroups with single-episode MDD and without psychiatric comorbidity showed significantly lower estimates (30.5%–34.4%). Estimates of genetic correlations between the subgroups within comparison groups ranged from 0.33 to 0.90. Seven of nine genetic correlations were significantly smaller than 1, suggesting differences in underlying genetic architecture. These results were largely consistent with previous work using genomic data.

Conclusions:

The findings of differential heritability and partially distinct genetic components in subgroups provide important insights into the genetic heterogeneity of MDD and a deeper etiological understanding of MDD clinical subgroups.
Major depressive disorder (MDD) is a common psychiatric syndrome with considerable disease burden. It is a leading contributor to disability, suicidality, and productivity loss in the global economy (1, 2). Individuals with MDD exhibit varying symptom profiles (3), which are sometimes opposing—for example, some show symptoms of insomnia and weight loss while others experience hypersomnia or weight gain. Standard typology partly captures this heterogeneity; however, it remains elusive whether it adequately captures etiological heterogeneity. Given the relatively low heritability of 30%–40% (4), it is imperative to investigate the genetic characterization of MDD heterogeneity and to identify more homogeneous patient subgroups.
Recent studies using large-scale samples with standardized phenotyping and genotyping have contributed to a better understanding of genetic heterogeneity in MDD (5, 6). For example, in our previous work, we used UK Biobank data to systematically compare the genetic architecture of 16 MDD subtypes (6). We showed that clinical subtypes were genetically more homogeneous than all MDD together. However, that study relied mostly on self-report data and retrospective recall of depressive symptoms. Also, given the known “healthy volunteer” bias in the UK Biobank (7), a key limitation was that individuals with more severe illness were underrepresented. Earlier family-based studies on genetic contributions to MDD subtypes were limited by small sample size, few subgroups, and inconsistent phenotype definition mainly based on self-report data. Findings on genetic heterogeneity in MDD remain inconclusive and debatable (4, 8, 9). Therefore, to untangle the genetic heterogeneity of MDD, more evidence is needed, particularly for the patient subgroups with the greatest clinical severity and the highest disease burden.
Using register data from the entire Swedish population, we sought to strengthen the evidence on the genetic heterogeneity of MDD. Among individuals with specialist-diagnosed MDD, we studied 18 subgroups based on nine comparison groups defined by clinical and psychosocial features. Using the genealogical information available in the Swedish registers, we applied a sibling-based design and used classic quantitative genetic models to investigate the genetic components of these subgroups. To clearly demonstrate the synthesized evidence, we compared the resultant pedigree-based estimates with the estimates based on single-nucleotide polymorphisms (SNPs) from our previous UK Biobank study.

Methods

Data

We used data from several population-based registers in Sweden. The data were updated until December 31, 2013. The registers were linked via a personal identity number assigned to all individuals in Sweden at birth or immigration. Individuals with MDD were identified using the National Patient Registers, which recorded psychiatric inpatient care in Sweden from 1973 and outpatient care in both private and public caregiving facilities from 2001 (10). Siblings were identified using the Multi-Generation Register (11). Other registers used included the Cause of Death Register to identify people who died by suicide (12); the Longitudinal Integrated Database for Health Insurance and Labor Market Studies (13) to extract information about employment, sick leave, and disability pension; and the Total Population Register (14) for data on birth, death, and migration (see the Supplementary Methods section in the online supplement).

Study Cohort and Siblingship

We extracted register data for individuals who were born in Sweden between 1977 and 1993 with identifiable biological parents (see Figure S1 in the online supplement), and followed them for diagnoses of MDD between ages 4 and 36 during the study follow-up period between 1997 and 2013, using ICD-10 codes that were introduced in Sweden in 1997 (see the Supplementary Methods section in the online supplement). We excluded individuals born with congenital malformations registered in the Medical Birth Register (15). We also excluded people who died or had any migration record (i.e., emigration or immigration) before age 10 (i.e., before 2004). Included individuals were thus followed for over 7 years from the start of ICD-10.
We compared full sibling pairs and maternal half sibling pairs in this study. These two types of sibling pairs were chosen because the difference in their expected proportion of shared additive genetic variance allows us to estimate heritability (assuming the same environment), and they account for the most sibling pairs in our data, hence maximizing statistical power for the analyses. Using the personal identification numbers of parents, we identified full siblings who were born in different months (to exclude twins), and maternal half siblings with the same mother and different fathers. To minimize the effect of changing diagnostic practice over time, we included only sibling pairs who were born ≤10 years apart. When a family had more than one sibling pair, we randomly selected one pair in each family to ensure independence between sibling pairs.

MDD Phenotype and Subgroups

From the study cohort described above, we identified individuals with MDD as those who had any ICD-10 code of F32 or F33 (detailed codes are provided in Table S1 in the online supplement). Among those with MDD, we defined 18 subgroups based on nine clinical characteristics: 1) severity, based on ICD codes; 2) recurrence, based on ICD codes and number of episodes; comorbidities, specifically with 3) anxiety disorder or 4) other psychiatric disorders; 5) suicidality, including both suicide attempt and suicide death; 6) impairment and 7) disability based on information about sickness compensation and early retirement, respectively, in connection with MDD diagnoses; 8) care unit (i.e., inpatient- or outpatient-treated MDD); and 9) age at first diagnosis, as a proxy for age at onset (divided into youth-onset and adult-onset MDD). The subgroups were chosen based on previous analyses of MDD subtypes (16) and the feasibility of data extraction using Swedish registers (17) (Table 1; see also Table S2 in the online supplement). These 18 subgroups formed nine comparison groups. Subgroups within a comparison group were mutually exclusive, while subgroups across comparison groups were interdependent (e.g., one individual could have both youth-onset and severe MDD; see Figure S2 in the online supplement). The numbers of concordant and discordant sibling pairs for each subgroup are provided in Table S3 in the online supplement.
TABLE 1. Major depressive disorder subgroup comparisonsa
Comparison (Subgroup)DefinitionN% (Among 46,255 MDD Cases)
Severity
 SevereReceived at least one severe MDD diagnosis (F32.2, F32.3, F33.2, F33.3)7,59616.4
 Mild/moderateDid not receive any severe MDD diagnosis38,65983.6
Recurrence
 RecurrentHad more than one MDD episode or at least one recurrent MDD diagnostic code (F33)21,54546.6
 Single-episodeHad only one episode and without any recurrent MDD diagnostic code (F33)24,71053.4
Comorbid anxiety disorder
 AnxietyHad both MDD and anxiety disorder (F40, F41) during time of follow-up, disregarding which condition came first21,26446.0
 NonanxietyMDD without any anxiety diagnosis24,99154.0
Comorbid psychiatric disorders
 PsychiatricHad at least one diagnosis of other psychiatric disorders: eating disorder (F50); disorders due to psychoactive substance use (F10–F19); ADHD (F90); autism spectrum disorder (F84); bipolar disorder (F30, F31); OCD (F42); PTSD (F43); schizophrenia and schizoaffective (F20, F21, F25)25,76655.7
 NonpsychiatricMDD without any of the above psychiatric disorders20,48944.3
Suicidality
 SuicidalMDD with suicide attempt or suicide death (X60–X84, Y10–Y34, Y87.0, Y87.2)9,45120.4
 NonsuicidalMDD without any registered suicide attempt or suicide death36,80479.6
Impairment
 ImpairedReceived sickness, occupational, or injury compensation within the same year of MDD diagnosis (17)14,87023.1
 NonimpairedIndividuals with MDD who are not in the impaired subgroup31,38567.9
Disability (using early retirement as proxy)
 DisabledReceived early retirement pension within 4 years after any MDD diagnosis (17)6,85714.8
 NondisabledNo early retirement within 4 years after any MDD diagnosis39,39885.2
Care unitb
 InpatientAt least one hospitalization with MDD as the primary diagnosis9,24620.0
 OutpatientMDD treated in outpatient settings, with no hospitalization for MDD35,27876.3
Age at onset (using age at first diagnosis as proxy)c
 Youth onsetFirst three octiles of the age at first diagnosis (≥7.8 to ≤21.3 years)17,74038.4
 Adult onsetLast three octiles of the age at first diagnosis (<24.8 to ≤36.9 years)15,88734.3
a
ADHD=attention deficit hyperactivity disorder; MDD=major depressive disorder; OCD=obsessive-compulsive disorder; PTSD=posttraumatic stress disorder.
b
The two subgroups do not add up to 100% because secondary diagnoses of MDD in inpatient care were excluded. (For further explanation, see the footnote to Table S2 in the online supplement).
c
The two subgroups do not add up to 100% because the two middle octiles were excluded.

Statistical Analysis

To investigate and compare genetic components of MDD subgroups, we estimated their heritabilities (h2) and the genetic correlations (rg) between subgroups using structural equation modeling (using the OpenMx package in R [18]). The total phenotypic variance and covariance were partitioned into additive genetic (A), shared environment (C), and unique environment (E). We did not estimate dominance deviation (D), and the model relied on the assumption of no interaction between genetic and environmental effects. We contrasted full siblings and maternal half siblings assuming that, on average, 1) full siblings shared 50% of A and maternal half siblings shared 25%, and 2) both sibling types share 100% C because they are likely to be raised together in the same household (19). Outcomes were analyzed as binary variables, and we applied the liability-threshold model (20) to estimate h2 on the liability scale. For each analysis, the trait lifetime prevalence, which was used to derive the threshold, was allowed to be different between sibling types because in our data, subgroup prevalence was higher among maternal half siblings than among full siblings (see Table S4 in the online supplement). We fitted both ACE and AE models and compared the fit of the two models using the Akaike information criterion, the Bayesian information criterion, and −2 log likelihood. We performed likelihood ratio tests to assess whether the model fit of ACE was significantly better than that of AE. All the results were based on the simpler AE models because the difference in the −2 log likelihood was not statistically significant (see Tables S6 and S8 in the online supplement).
Univariate models were used to estimate h2 for each subgroup (details are provided in the Supplementary Methods section in the online supplement), and bivariate models were used to estimate rg between subgroups, both within and across comparison groups. Typically, in an unadjusted standard bivariate model, rg is estimated from a 4×4 variance-covariance matrix including within-sibling-within-trait, within-sibling-cross-trait, cross-sibling-within-trait, and cross-sibling-cross-trait. However, because each individual is allocated to only one MDD subgroup within each comparison group, the within-sibling-cross-trait co-occurrence is defined to always be 0 and does not carry any information; we therefore excluded the contribution of this correlation to the likelihood (21) (details on model setup are provided in the Supplementary Methods section in the online supplement). By this setup of the data, we assumed that data for the subgroups within each comparison group come from two separate (but correlated) liability dimensions (see the Supplementary Results section in the online supplement for comparison with a model under a one-dimensional severity scale).
All the models were adjusted for sex, as well as linear and quadratic effects of birth year, except for the subgroups of youth- and adult-onset MDD (adjusted only for sex, because age at diagnosis was highly correlated with birth year). By adjusting for the linear and quadratic effects of birth year, we attempted to account for biases due to changing diagnostic practice between sibling pairs over time and for its possible nonlinear effect. Since we could not adjust for birth year in the analyses that involved age at diagnosis, the results for this comparison group should be interpreted with caution. All models were fitted using maximum likelihood. We present estimates with standard errors and 95% Wald-type confidence intervals (22).
To test whether two subgroups differed in heritability (H0: h12=h22), we constructed nine models where we estimated h2 for the two subgroups simultaneously and used Wald tests to evaluate whether the difference was statistically significant. To test whether two subgroups shared the same genetic components, we performed hypothesis testing in each model built to estimate rg (H0: rg=1). We used Bonferroni correction (23) to account for multiple testing, with nine tests for h2 and nine tests for rg separately, which yielded a p threshold of 5.56×10⁻³ (p=0.05/9) (see Tables S7 and S8 in the online supplement).

Comparing the Findings With Previous Findings From Genotype Data

Finally, we attempted to determine whether this study’s findings converged with our previous work using genomic data in the UK population (6). The previous study included 126,506 (27.5% of the included population) individuals with self-reported or diagnosed major depression, where we defined 16 subgroups within eight comparison groups (vegetative symptoms, symptom severity, comorbid anxiety disorder, age at onset, recurrence, suicidality, impairment, and postpartum depression; N∼3,000–47,000). Six comparison groups were in common with the ones investigated in this study. We present the estimates of h2 and rg from the present study alongside the SNP-based heritability (SNP h2) and genetic correlation (SNP rg) from the previous study.

Results

From 1,500,713 individuals born in Sweden between 1977 and 1993, we randomly selected one pair of full or maternal half siblings from each family, with the siblings born ≤10 years apart. The final sample included 838,990 individuals who formed 419,495 unique sibling pairs (395,531 full sibling pairs; 23,964 maternal half sibling pairs) (see Figure S1 in the online supplement). Among these, we identified 46,255 individuals with MDD (5.5%). Age at first MDD diagnosis ranged between 7.8 and 36.9 years (mean=23.2 years). Compared with those without MDD, the MDD group had a higher proportion of females (MDD group: 63.0%; non-MDD group: 47.8%). The two groups did not differ in mean age at end of follow-up (MDD group: mean=27.7 years, SE=4.3; non-MDD group: mean=28.0 years, SE=4.2). The characteristics of each subgroup are summarized in Table S5 in the online supplement. The heritability estimated for MDD was 45.3% (95% CI=43.0–47.5), similar to previous estimates based on the same population (17).
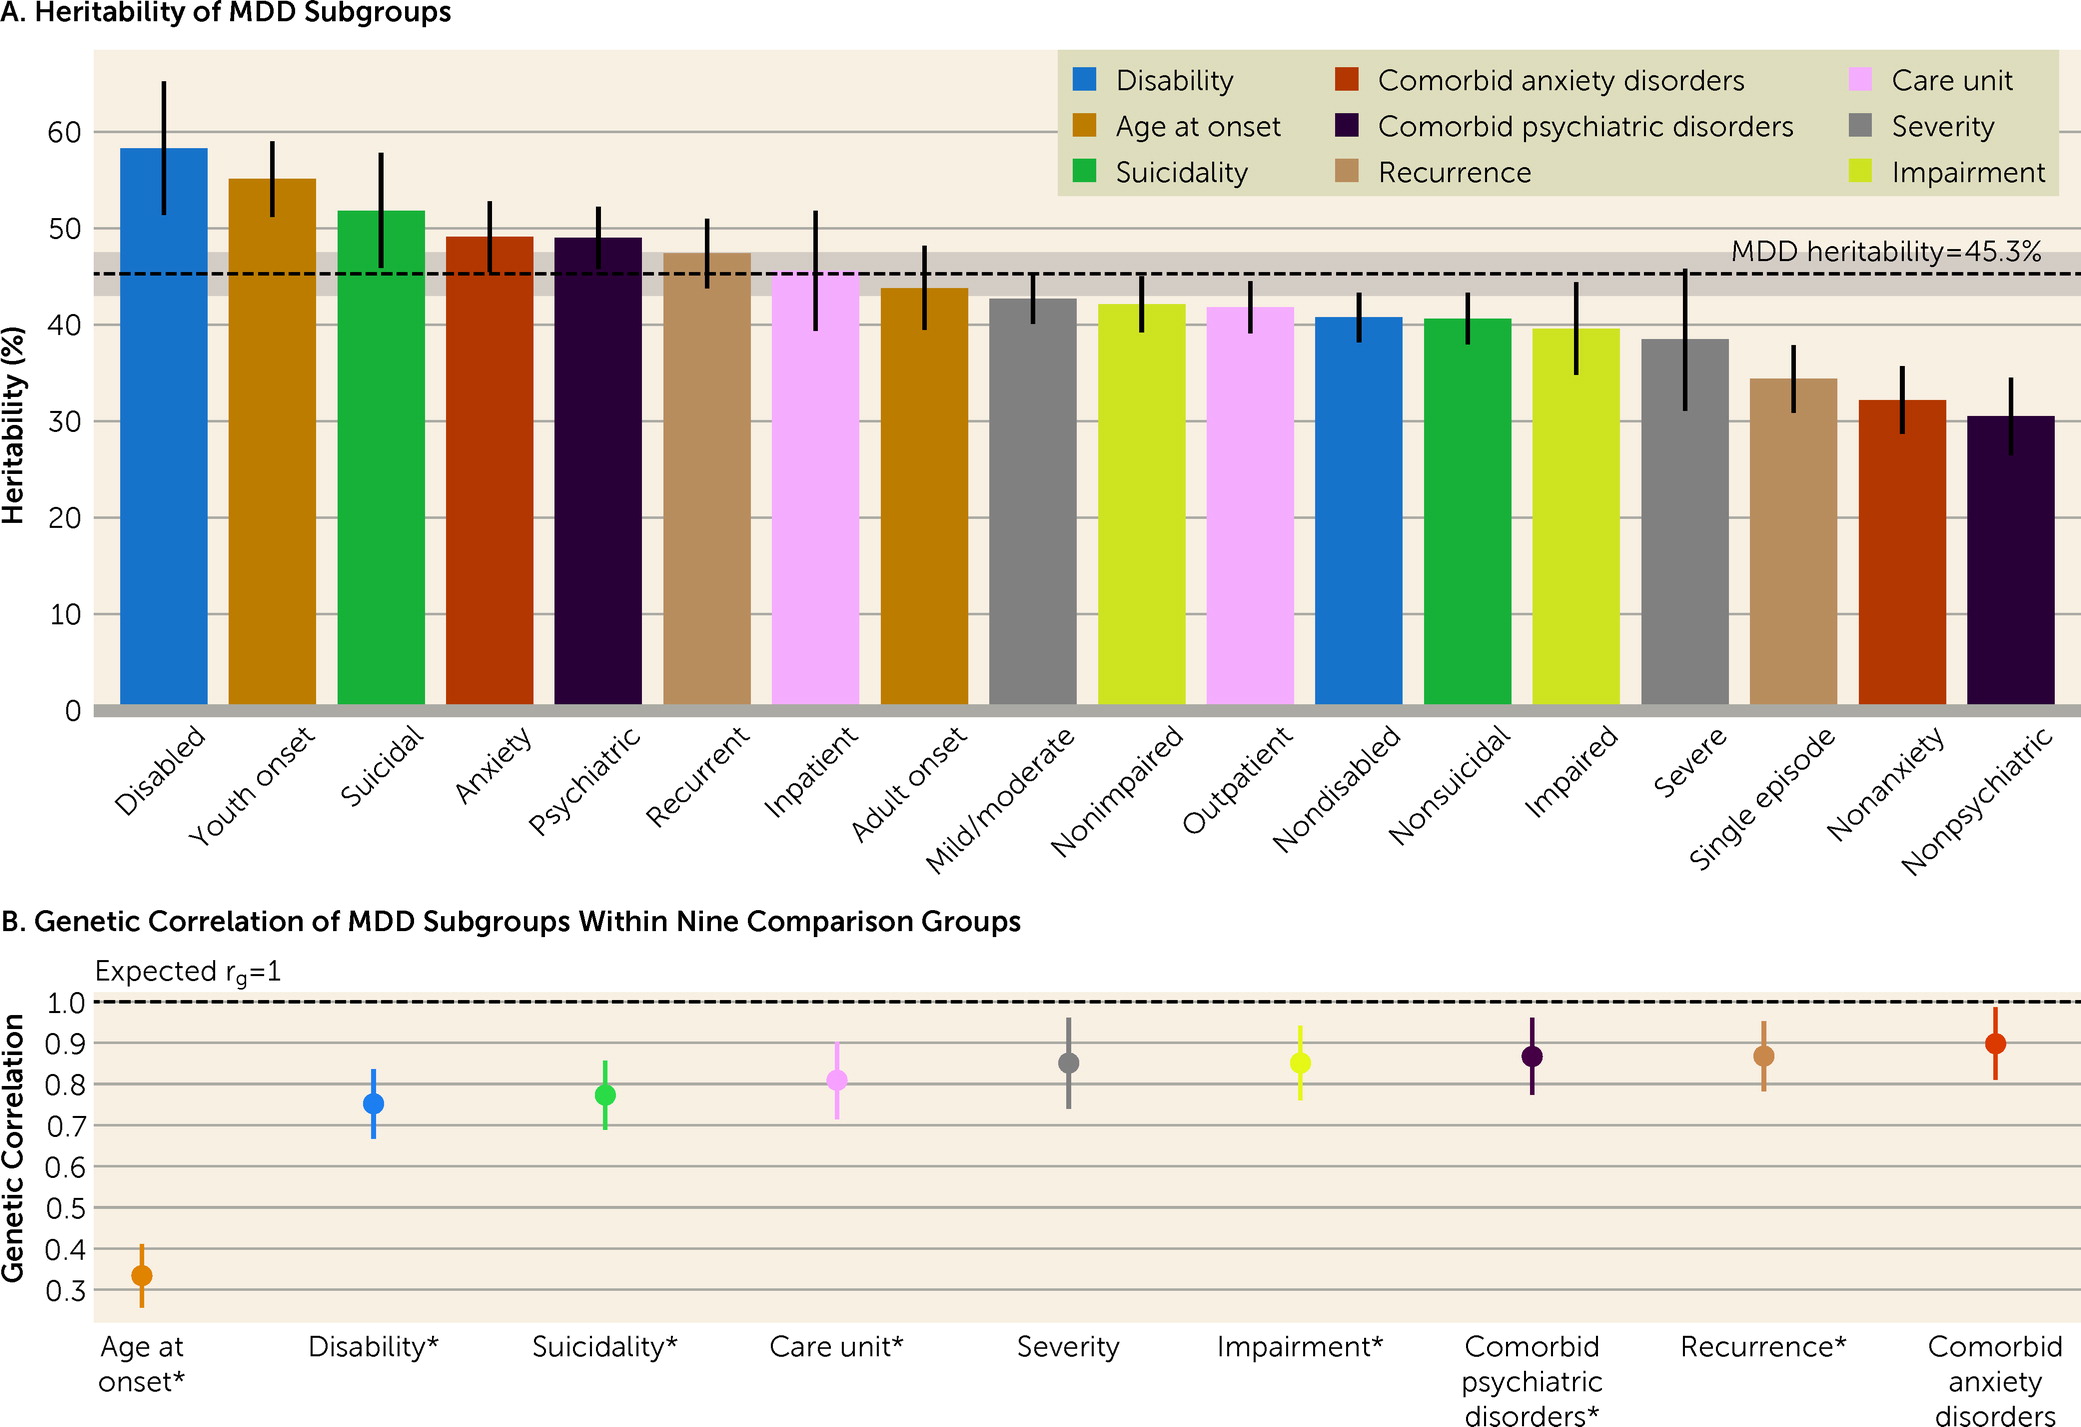
The number of individuals in the 18 MDD subgroups ranged between 6,857 (14.8% of the MDD sample) and 39,398 (85.2%) (Table 1). For the subgroups, the heritability estimates ranged from 30.5% to 58.3% (Figure 1A; see also Table S6 in the online supplement). The disabled and youth-onset subgroups showed significantly higher h2 than the overall MDD sample, while the subgroups with single-episode MDD and without comorbid anxiety disorder or other psychiatric disorders showed significantly lower estimates (see Table S7 in the online supplement). The rg estimates within comparison groups ranged from 0.33 to 0.90 (Figure 1B). Seven of nine rg values were statistically significantly different from 1 (p<5.56×10⁻³) (see Table S8 in the online supplement).
FIGURE 1. Heritability and within-comparison genetic correlation of major depressive disorder (MDD) subgroupsa
aBars and dots show point estimates; error bars indicate 95% confidence interval. Colors index subgroup comparison groups. In panel A, the horizontal dashed line shows all MDD phenotype heritability, and the 95% confidence interval is shaded in gray (h2=45.3%, 95% CI=43.0–47.5). In panel B, asterisks indicate values that are statistically significantly different from 1.
Among all the subgroups studied, the subgroup with disability (based on early retirement) had the highest h2, at 58.3% (95% CI=51.4–65.2). This estimate was significantly higher than that for the nondisabled subgroup (h2=40.8%, 95% CI=38.20–43.3; p=2.63×10⁻⁶ for difference in estimates) (see Table S7 in the online supplement). The rg between these two subgroups was significantly lower than 1 (rg=0.75, 95% CI=0.67–0.84) (Figure 1B; see also Table S8 in the online supplement). For the disabled subgroup, there was suggestive evidence for the influence of a C component (22.3%, 95% CI=2.3–42.3, p=0.03) (see Table S6 in the online supplement).
For the comparison groups based on age at first diagnosis, youth-onset MDD was more heritable than adult-onset, with h2 estimates of 55.1% (95% CI=51.2–59.0) and 43.8% (95% CI=39.5–48.2), respectively. The rg between the two subgroups (rg=0.33, 95% CI=0.26–0.41) was the lowest among the nine comparison groups (Figure 1; see also Tables S6–S8 in the online supplement).
The suicidal subgroup showed a significantly higher h2 than the nonsuicidal subgroup (51.8% vs. 40.6%, p=8.05×10⁻⁴), and their rg was 0.77 (95% CI=0.69–0.86).
The subgroups with comorbid anxiety disorder and with other psychiatric disorders showed higher h2 estimates than the subgroups without these comorbidities (Figure 1A; see also Table S7 in the online supplement). However, the rg values within these two comparison groups were high, at 0.90 (95% CI=0.81–0.99) between the subgroups with or without comorbid anxiety disorder, and 0.87 (95% CI=0.77–0.96) for the ones with or without other psychiatric disorders.
Similarly, recurrent MDD was more heritable than single-episode MDD (47.4% and 34.4%, respectively; p=3.84×10⁻⁷). The rg of these two subgroups was 0.87 (95% CI=0.78–0.95) (Figure 1).
The inpatient subgroup (i.e., individuals who had been hospitalized for MDD) showed a slightly higher h2 than the subgroup treated only in outpatient care (45.6% [95% CI=39.4–51.8] compared with 41.8% [95% CI=39.1–44.5]), but the difference was not statistically significant. The rg within this comparison was significantly lower than 1 (rg=0.81, 95% CI=0.72–0.90) (Figure 1; see also Tables S7 and S8 in the online supplement). By including only a primary diagnosis of MDD in the inpatient subgroup, we may have missed relevant MDD cases in which the patient was hospitalized with suicide as the main diagnosis. We conducted sensitivity analyses where 287 MDD cases with a primary diagnosis of suicide were added to the inpatient subgroup. The results were consistent with the primary results (see Table S9 in the online supplement).
The two comparison groups based on severity and impairment showed a high within-comparison rg of 0.85 (Figure 1B). The h2 estimates for the severe and impaired subgroups were slightly lower compared with those for their counterparts, albeit with largely overlapping confidence intervals (Figure 1A; see also Table S7 in the online supplement).
Considerable sample overlap (mean overlap, 48.3%; range, 6.4–93.6; see Figure S2 in the online supplement) and phenotypic correlations (range, −0.55 to 0.55; see Figure S3 in the online supplement) contributed to the high rg estimates between subgroups across comparison groups (mean=0.89; see Figures S3 and S4 in the online supplement). Nonetheless, 48% (69/144) of the rg values had confidence intervals that did not include 1. Some comparison groups showed different patterns of cross-comparison rg. For example, as expected, the inpatient subgroup had a strong genetic correlation with the severe MDD subgroup (rg=0.91), while the outpatient subgroup had a strong genetic correlation with the mild/moderate MDD subgroup (rg=0.99). Compared with the adult-onset subgroup, the youth-onset subgroup had a stronger genetic correlation with all but the impaired subgroup (rg>0.7) (see Figure S4 in the online supplement).

Heterogeneity of MDD Subgroups Observed Using Pedigree and Genomic Data

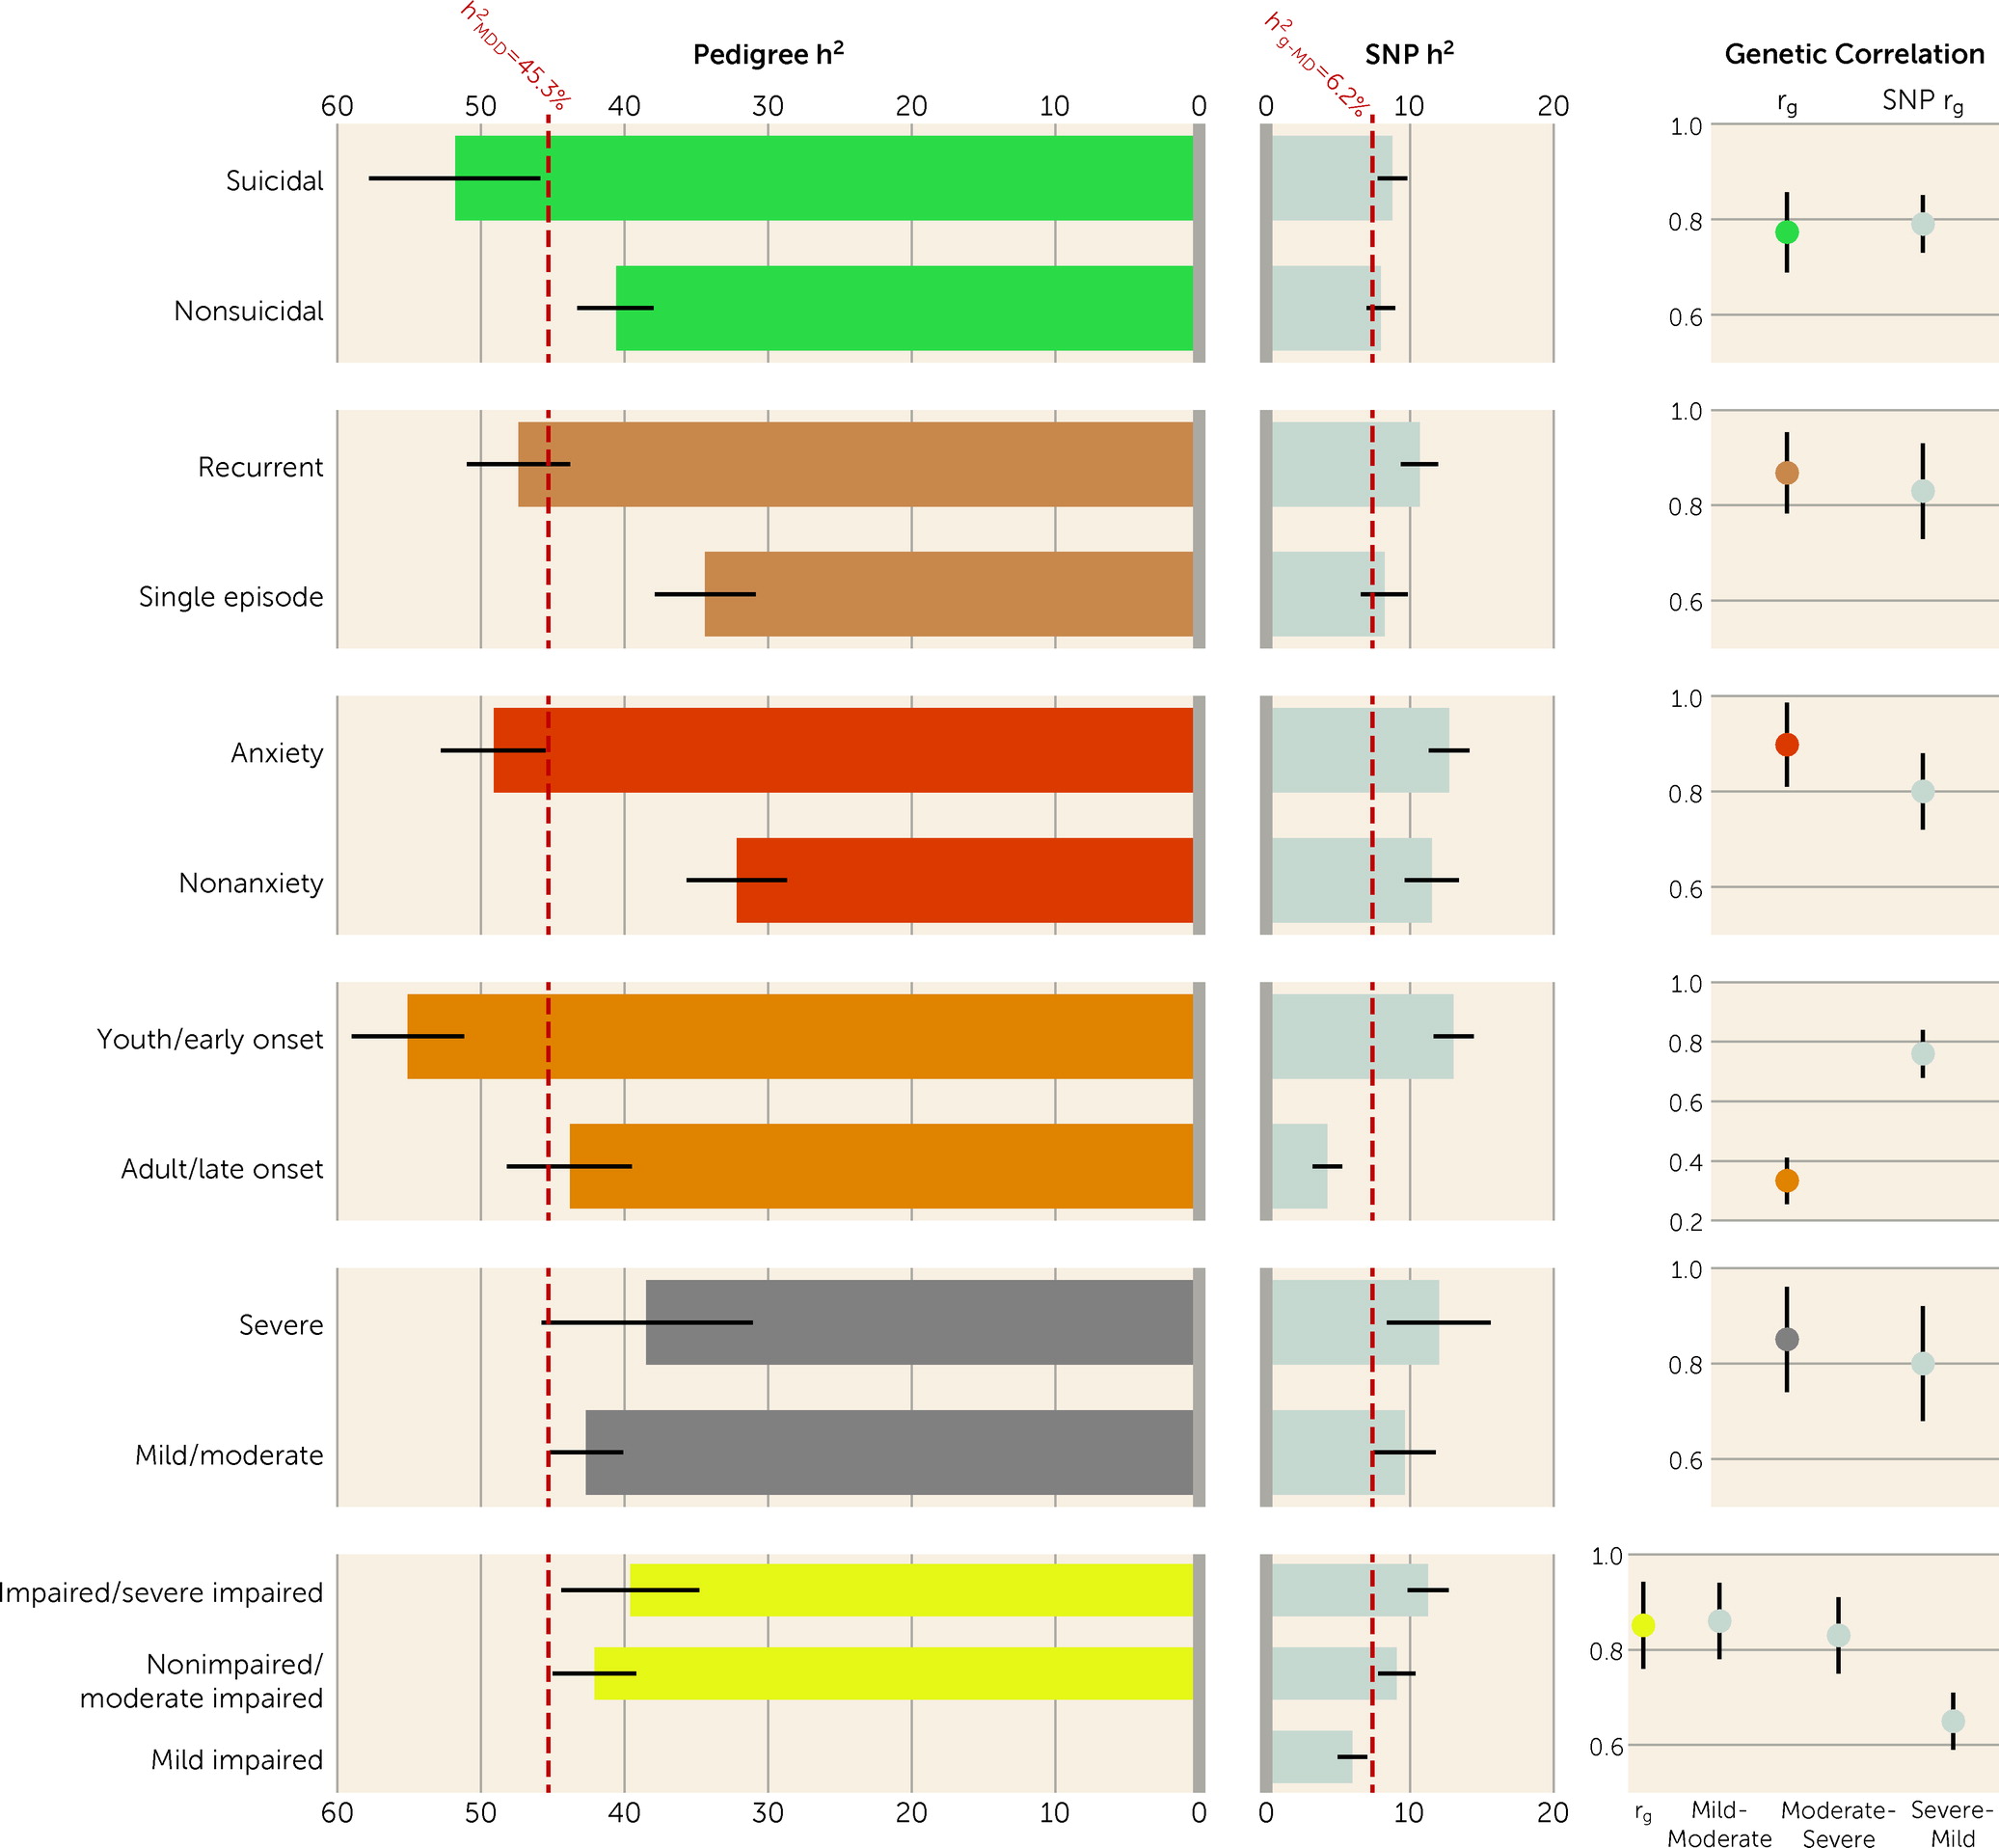
We compared the h2 and within-comparison-group rg values estimated using pedigree data (this study) with the estimates from genomic data (our previous study, using the UK Biobank cohort) (Figure 2). Among the six overlapping subgroups, SNP h2 was about one-tenth to one-third of h2 across subgroups. In general, patterns of heritability estimates were similar between the two studies (Figure 2; see also Table S10 in the online supplement). In both studies, the early/youth-onset subgroup was significantly more heritable than the late/adult-onset subgroup (Figure 2; see also Table S6 in the supplement of reference 6). Using pedigree data, we observed significant differences in h2 based on more clinical indices, including suicidality, recurrence, and comorbid anxiety disorder, for which we did not find the same results in the UK Biobank data. Contrary to the h2 estimates, the SNP h2 values for the severe and impaired subgroups were higher than their counterparts in the UK Biobank data.
FIGURE 2. Heritability and genetic correlations estimated from Swedish pedigree data and UK Biobank genotype dataa
aThe Swedish pedigree data are in the same colors as those used in Figure 1, and the UK Biobank genotype data are in gray. Bars and dots show point estimates; error bars indicate 95% confidence interval. Red dashed vertical lines show all MDD phenotype heritability (h2=45.3%, SNP h2=6.2%). In pedigree data, youth onset is ≤21 years and adult onset is ≥25 years; in genotype data, early onset is ≤30 years and late onset is ≥44 years.
The rg estimates were similar between the two studies, with mean values of 0.76 and 0.79 for the pedigree and genomic data, respectively. In both studies, rg was significantly lower than 1 for subgroups within the comparisons of age at diagnosis/onset, suicidality, recurrence, and impairment. However, the rg between youth-onset and adult-onset MDD from the present study was significantly different from that of early-onset and late-onset MDD from the UK Biobank study (0.33 and 0.76, respectively; p=3.97×10⁻¹³).

Discussion

In this study, we used Swedish national registers to investigate and contrast genetic components of 18 MDD subgroups. The range of heritability of these MDD subgroups was 30.5%–58.3%, nearly a twofold difference. The majority of genetic correlations within comparison groups (range, 0.33–0.90) significantly deviated from 1, suggesting differences in their underlying genetic risk factors. Furthermore, we followed up on our previous work and compared these pedigree-based estimates with the SNP-based estimates from the UK Biobank. In both studies, we found that, in general, subgroups with more severe manifestation were more heritable than their counterparts, and genetic correlations from the two studies were comparable (mean correlations of 0.76 and 0.79 for pedigree- and SNP-based, respectively). These findings strengthen the current evidence that subgroups of MDD differ in their genetic components.
It has been challenging to characterize genetic contribution to MDD heterogeneity. The large samples from Sweden and the UK Biobank provide unique opportunities to systematically compare genetic components of MDD subgroups. The present study, however, differs from our previous UK Biobank study in several important respects. First, here we used a Swedish population-based cohort, as compared to a more selected population in the UK Biobank (7). With specialist-treated MDD extracted from patient registers, the samples used here represent a patient population with more severe illness and greater functional impairment, thereby addressing a key limitation of the previous study. Second, in the previous study, which was primarily based on retrospective self-reported symptoms, we focused on symptom-based subtypes, whereas in this study we focused on the subgroups with differential psychosocial function and disease burden. Third, the previous findings based on genomic data were reexamined here using classic quantitative genetic modeling. Across the six overlapping subgroups, the SNP-based heritability accounted for only a small percentage (10%–30%) of pedigree heritability. The difference is likely due to two main factors. First, SNP-based heritability only captures the genetic contribution explained by common genetic variants that are tagged on genotyping arrays. Second, the dissimilarities between the two studies, including phenotype definitions and sample ascertainment (i.e., specialist-treated MDD versus self-reported major depression) may also contribute to the variation. Notwithstanding the differences, the findings from the two studies were largely consistent; together they provide the most comprehensive overview of genetic heterogeneity in MDD to date. Identifying more heritable subgroups would increase GWAS power. The present study found up to 1.5 times higher heritability in subgroups than in all MDD; assuming the SNP heritability of 9% for all MDD (24) and a similar fold increase in subgroups’ SNP heritability, this would reduce sample size by approximately one-third while maintaining power to detect significant loci (25).
Notably, this study extends evidence for subgroups with greater functional disability and disease burden. We used medical and social benefit records to examine clinical and psychosocial features as a means of defining MDD subgroups. We found that the disabled subgroup, as indexed by early retirement, was the most heritable subgroup among all those studied. Compared with their counterparts, heritability was significantly higher for the MDD subgroups with disability, youth onset, suicide attempt or death by suicide, comorbidity with anxiety disorder or another psychiatric disorder, and recurrence. These results were largely consistent with previous analyses using polygenic risk scores, which showed that subgroups with youth onset, recurrence, and comorbid anxiety disorder had a higher genetic burden of common risk alleles for MDD than the later-onset, single-episode, and nonanxiety MDD subgroups, respectively (5, 26). On the other hand, severity and impairment within MDD in this study appeared to be less useful differentiators. This might be due to the limited variability in these two indicators in specialist-treated MDD. Nevertheless, these results underscore the importance of studying the patient subgroups on the far end of the spectrum of functional disability, especially using genetic approaches.
Despite the evidence supporting genetic heterogeneity in MDD, the relatively high genetic correlations clearly demonstrated that the genetic components of subgroups are only partially distinct. Except for the age-at-diagnosis comparison, all pairwise genetic correlations were between 0.75 and 0.90. The subgroups of youth-onset MDD (defined as age ≤21 at the first specialist MDD diagnosis) and adult-onset (age ≥25) showed a much lower genetic correlation of 0.33. This estimate was also substantially lower than our UK Biobank estimate of 0.76 between early-onset depression (defined as age at first experience of a ≥2-week episode of cardinal symptoms at age ≤30 years) and late-onset depression (≥44 years). It should be noted that the two studies had major differences in phenotype definitions (age at diagnosis vs. age at onset) and cutoffs (youth- or adult-onset vs. early- or late-onset), especially given the fact that many individuals with MDD do not seek treatment until well after symptom onset (27). These differences are likely to have led to discrepancies in the results. Both our own work based on the UK Biobank (27) and the Australian Genetics Study of Depression (5) showed that the polygenic risk scores of MDD were the highest among individuals with an early onset age and steadily declined until an onset age of around 30. Youth depression has been associated with subsequent somatic diseases and premature mortality (28). Thus, it might be meaningful and clinically important to identify specific genetic risk factors underlying this subgroup.
Interpretation of the study results is subject to several limitations. Changes in clinical practice during the study follow-up period constitute a possible limitation of using register data. Changes in practice may have led to differences in MDD diagnoses in individuals across different years. To limit potential bias owing to this factor, we used a sibling design (as opposed to familial relations across generations) with sibling pairs born ≤10 years apart and adjusted for the linear and quadratic effects of birth year in all models except those for the subgroups based on age at diagnosis. We were not able to appropriately account for potential diagnostic changes over calendar time in the comparison of youth-onset versus adult-onset MDD. Second, although national register data allowed us to study subgroups in large samples, we still lacked sufficient sample sizes to study rare subtypes, such as psychotic MDD (less than 4% of all MDD cases in the Swedish register), and lacked fine-grained clinical information on symptoms and treatment response to investigate important subtypes such as atypical or treatment-resistant MDD. These represent areas of interest for future studies. Third, we do not have information to identify the specific indication for receiving sickness benefits and early retirement pensions. Fourth, we may have missed MDD cases or misclassified subgroups beyond the end of follow-up. However, our data covered the peak onset age of MDD for the investigated cohort, and for the majority of MDD cases, we have sufficient follow-up time to correctly assign subgroups (median=5.1 years since the first MDD diagnosis, IQR=2.5–7.8 years). Moreover, the results from this study were similar to our previous findings in the UK Biobank, regardless of the differences in birth cohort and follow-up. Finally, despite many advantages of register data, we cannot rule out the potential impact of the differences in the phenotypic reliability between subgroups on the observed findings.
For all subgroups, we did not find any statistically significant contribution of the common environment (C) to the liability of the disorders. Our simulation (see the Supplementary Results section in the online supplement) showed that with the sample size used here, we had sufficient power (>80%) to detect a significant C component of ∼10% and above. However, the power might be limited if C is of a smaller magnitude (e.g., we had less than 60% power to detect a C component of <8%) (see the Supplementary Results section in the online supplement). Our models relied on the assumption of no gene-environment interplay, which, if violated, could affect the estimates.
Treating MDD as a single form limits the potential for personalized treatment. Progress will depend on patient stratification based on clinical characteristics, or on the omics features promised by advanced technologies. This study has produced important insights into the genetic heterogeneity of MDD and a deeper etiological understanding of MDD clinical subgroups. These insights will encourage future studies to identify specific genetic factors and biomarkers, and to map subgroups to outcomes, thereby accelerating research on novel and optimized treatment tailored to specific patient groups.
Acknowledgments

Dr. Sullivan acknowledges support from the Swedish Research Council (Vetenskapsrådet, award D0886501) and NIMH (R01 grants MH124871, MH121545, and MH123724).

Supplementary Material

File (appi.ajp.20220906.ds001.pdf)

REFERENCES

1.
GBD 2019 Mental Disorders Collaborators: Global, regional, and national burden of 12 mental disorders in 204 countries and territories, 1990–2019: a systematic analysis for the Global Burden of Disease Study 2019. Lancet Psychiatry 2022; 9:137–150
2.
The Lancet Global Health: Mental health matters. Lancet Glob Health 2020; 8:e1352
3.
Ostergaard SD, Jensen SO, Bech P: The heterogeneity of the depressive syndrome: when numbers get serious. Acta Psychiatr Scand 2011; 124:495–496
4.
Kendall KM, Van Assche E, Andlauer TFM, et al: The genetic basis of major depression. Psychol Med 2021; 51:2217–2230
5.
Mitchell BL, Campos AI, Whiteman DC, et al: The Australian Genetics of Depression Study: new risk loci and dissecting heterogeneity between subtypes. Biol Psychiatry 2022; 92:227–235
6.
Nguyen TD, Harder A, Xiong Y, et al: Genetic heterogeneity and subtypes of major depression. Mol Psychiatry 2022; 27:1667–1675
7.
Fry A, Littlejohns TJ, Sudlow C, et al: Comparison of sociodemographic and health-related characteristics of UK Biobank participants with those of the general population. Am J Epidemiol 2017; 186:1026–1034
8.
Cai N, Choi KW, Fried EI: Reviewing the genetics of heterogeneity in depression: operationalizations, manifestations, and etiologies. Hum Mol Genet 2020; 29:R10–R18
9.
Flint J: The genetic basis of major depressive disorder. Mol Psychiatry (Online ahead of print, January 26, 2023)
10.
Ludvigsson JF, Andersson E, Ekbom A, et al: External review and validation of the Swedish National Inpatient Register. BMC Public Health 2011; 11:450
11.
Ekbom A: The Swedish Multi-Generation Register. Methods Mol Biol 2011; 675:215–220
12.
Brooke HL, Talbäck M, Hörnblad J, et al: The Swedish Cause of Death Register. Eur J Epidemiol 2017; 32:765–773
13.
Ludvigsson JF, Svedberg P, Olén O, et al: The Longitudinal Integrated Database for Health Insurance and Labour Market Studies (LISA) and its use in medical research. Eur J Epidemiol 2019; 34:423–437
14.
Ludvigsson JF, Almqvist C, Bonamy AK, et al: Registers of the Swedish total population and their use in medical research. Eur J Epidemiol 2016; 31:125–136
15.
Blomberg M, Selbing A, Källén B: Congenital malformations in the southeast of Sweden: a registry study with validation. Acta Paediatr 2000; 89:1238–1243
16.
Harald B, Gordon P: Meta-review of depressive subtyping models. J Affect Disord 2012; 139:126–140
17.
Kendler KS, Ohlsson H, Lichtenstein P, et al: The genetic epidemiology of treated major depression in Sweden. Am J Psychiatry 2018; 175:1137–1144
18.
Boker S, Neale M, Maes H, et al: OpenMx: an open source extended structural equation modeling framework. Psychometrika 2011; 76:306–317
19.
Pettersson E, Larsson H, Lichtenstein P: Common psychiatric disorders share the same genetic origin: a multivariate sibling study of the Swedish population. Mol Psychiatry 2016; 21:717–721
20.
Falconer DS: The inheritance of liability to certain diseases, estimated from the incidence among relatives. Ann Hum Genet 2007; 29:51–76
21.
Song J, Kuja-Halkola R, Sjölander A, et al: Specificity in etiology of subtypes of bipolar disorder: evidence from a Swedish population-based family study. Biol Psychiatry 2018; 84:810–816
22.
Oehlert GW: A note on the delta method. Am Stat 1992; 46:27–29
23.
Dunn OJ: Multiple comparisons among means. J Am Stat Assoc 1961; 56:52–64
24.
Howard DM, Adams MJ, Clarke TK, et al: Genome-wide meta-analysis of depression identifies 102 independent variants and highlights the importance of the prefrontal brain regions. Nat Neurosci 2019; 22:343–352
25.
Visscher PM, Wray NR, Zhang Q, et al: 10 Years of GWAS discovery: biology, function, and translation. Am J Hum Genet 2017; 101:5–22
26.
Wray NR, Ripke S, Mattheisen M, et al: Genome-wide association analyses identify 44 risk variants and refine the genetic architecture of major depression. Nat Genet 2018; 50:668–681
27.
Harder A, Nguyen TD, Pasman JA, et al: Genetics of age-at-onset in major depression. Transl Psychiatry 2022; 12:124
28.
Leone M, Kuja-Halkola R, Leval A, et al: Association of youth depression with subsequent somatic diseases and premature death. JAMA Psychiatry 2021; 78:302–310

Information & Authors

Information

Published In

Go to American Journal of Psychiatry
American Journal of Psychiatry
Pages: 714 - 722
PubMed: 37644812

History

Received: 2 November 2022
Revision received: 28 April 2023
Accepted: 26 May 2023
Published online: 30 August 2023
Published in print: October 1, 2023

Keywords

  1. Depressive Disorders
  2. Major Depressive Disorder
  3. Genetics / Genomics
  4. Epidemiology
  5. Heterogeneity

Authors

Details

Thuy-Dung Nguyen, M.Sc.
Department of Medical Epidemiology and Biostatistics (Nguyen, Kowalec, Pasman, Larsson, Lichtenstein, Sullivan, Kuja-Halkola, Lu) and Department of Global Public Health (Nguyen, Dalman, Lu), Karolinska Institutet, Stockholm; College of Pharmacy, University of Manitoba, Winnipeg, Canada (Kowalec); School of Medical Sciences, Örebro University, Örebro, Sweden (Larsson); Departments of Genetics and Psychiatry, University of North Carolina, Chapel Hill (Sullivan).
Kaarina Kowalec, Ph.D.
Department of Medical Epidemiology and Biostatistics (Nguyen, Kowalec, Pasman, Larsson, Lichtenstein, Sullivan, Kuja-Halkola, Lu) and Department of Global Public Health (Nguyen, Dalman, Lu), Karolinska Institutet, Stockholm; College of Pharmacy, University of Manitoba, Winnipeg, Canada (Kowalec); School of Medical Sciences, Örebro University, Örebro, Sweden (Larsson); Departments of Genetics and Psychiatry, University of North Carolina, Chapel Hill (Sullivan).
Joëlle Pasman, Ph.D.
Department of Medical Epidemiology and Biostatistics (Nguyen, Kowalec, Pasman, Larsson, Lichtenstein, Sullivan, Kuja-Halkola, Lu) and Department of Global Public Health (Nguyen, Dalman, Lu), Karolinska Institutet, Stockholm; College of Pharmacy, University of Manitoba, Winnipeg, Canada (Kowalec); School of Medical Sciences, Örebro University, Örebro, Sweden (Larsson); Departments of Genetics and Psychiatry, University of North Carolina, Chapel Hill (Sullivan).
Henrik Larsson, Ph.D.
Department of Medical Epidemiology and Biostatistics (Nguyen, Kowalec, Pasman, Larsson, Lichtenstein, Sullivan, Kuja-Halkola, Lu) and Department of Global Public Health (Nguyen, Dalman, Lu), Karolinska Institutet, Stockholm; College of Pharmacy, University of Manitoba, Winnipeg, Canada (Kowalec); School of Medical Sciences, Örebro University, Örebro, Sweden (Larsson); Departments of Genetics and Psychiatry, University of North Carolina, Chapel Hill (Sullivan).
Paul Lichtenstein, Ph.D.
Department of Medical Epidemiology and Biostatistics (Nguyen, Kowalec, Pasman, Larsson, Lichtenstein, Sullivan, Kuja-Halkola, Lu) and Department of Global Public Health (Nguyen, Dalman, Lu), Karolinska Institutet, Stockholm; College of Pharmacy, University of Manitoba, Winnipeg, Canada (Kowalec); School of Medical Sciences, Örebro University, Örebro, Sweden (Larsson); Departments of Genetics and Psychiatry, University of North Carolina, Chapel Hill (Sullivan).
Christina Dalman, M.D.
Department of Medical Epidemiology and Biostatistics (Nguyen, Kowalec, Pasman, Larsson, Lichtenstein, Sullivan, Kuja-Halkola, Lu) and Department of Global Public Health (Nguyen, Dalman, Lu), Karolinska Institutet, Stockholm; College of Pharmacy, University of Manitoba, Winnipeg, Canada (Kowalec); School of Medical Sciences, Örebro University, Örebro, Sweden (Larsson); Departments of Genetics and Psychiatry, University of North Carolina, Chapel Hill (Sullivan).
Patrick F. Sullivan, M.D., F.R.A.N.Z.C.P.
Department of Medical Epidemiology and Biostatistics (Nguyen, Kowalec, Pasman, Larsson, Lichtenstein, Sullivan, Kuja-Halkola, Lu) and Department of Global Public Health (Nguyen, Dalman, Lu), Karolinska Institutet, Stockholm; College of Pharmacy, University of Manitoba, Winnipeg, Canada (Kowalec); School of Medical Sciences, Örebro University, Örebro, Sweden (Larsson); Departments of Genetics and Psychiatry, University of North Carolina, Chapel Hill (Sullivan).
Ralf Kuja-Halkola, Ph.D.
Department of Medical Epidemiology and Biostatistics (Nguyen, Kowalec, Pasman, Larsson, Lichtenstein, Sullivan, Kuja-Halkola, Lu) and Department of Global Public Health (Nguyen, Dalman, Lu), Karolinska Institutet, Stockholm; College of Pharmacy, University of Manitoba, Winnipeg, Canada (Kowalec); School of Medical Sciences, Örebro University, Örebro, Sweden (Larsson); Departments of Genetics and Psychiatry, University of North Carolina, Chapel Hill (Sullivan).
Yi Lu, Ph.D. [email protected]
Department of Medical Epidemiology and Biostatistics (Nguyen, Kowalec, Pasman, Larsson, Lichtenstein, Sullivan, Kuja-Halkola, Lu) and Department of Global Public Health (Nguyen, Dalman, Lu), Karolinska Institutet, Stockholm; College of Pharmacy, University of Manitoba, Winnipeg, Canada (Kowalec); School of Medical Sciences, Örebro University, Örebro, Sweden (Larsson); Departments of Genetics and Psychiatry, University of North Carolina, Chapel Hill (Sullivan).

Notes

Send correspondence to Dr. Lu ([email protected]).
Presented as a poster at the 2021 Virtual World Congress of Psychiatric Genetics, October 11–15, 2021.

Author Contributions

Dr. Kuja-Halkola and Dr. Lu contributed equally.

Funding Information

Supported by NIMH (grant R01 MH123724), the European Union’s Horizon 2020 Research and Innovation Program (grant agreement numbers 847776 and 964874), and the European Research Council (grant agreement ID 101042183).Dr. Larsson has received grants from Shire Pharmaceuticals, personal and speaking fees from Evolan Pharma AB, Medice, and Shire/Takeda Pharmaceuticals, and sponsorship for a conference from Evolan Pharma AB and Shire/Takeda Pharmaceuticals, and he serves as editor-in-chief of JCPP Advances. Dr. Sullivan has served as an advisory committee member for Neumora Therapeutics and is a shareholder. The other authors report no financial relationships with commercial interests.

Metrics & Citations

Metrics

Citations

Export Citations

If you have the appropriate software installed, you can download article citation data to the citation manager of your choice. Simply select your manager software from the list below and click Download.

For more information or tips please see 'Downloading to a citation manager' in the Help menu.

Format
Citation style
Style
Copy to clipboard

View Options

View options

PDF/EPUB

View PDF/EPUB

Login options

Already a subscriber? Access your subscription through your login credentials or your institution for full access to this article.

Personal login Institutional Login Open Athens login
Purchase Options

Purchase this article to access the full text.

PPV Articles - American Journal of Psychiatry

PPV Articles - American Journal of Psychiatry

Not a subscriber?

Subscribe Now / Learn More

PsychiatryOnline subscription options offer access to the DSM-5-TR® library, books, journals, CME, and patient resources. This all-in-one virtual library provides psychiatrists and mental health professionals with key resources for diagnosis, treatment, research, and professional development.

Need more help? PsychiatryOnline Customer Service may be reached by emailing [email protected] or by calling 800-368-5777 (in the U.S.) or 703-907-7322 (outside the U.S.).

Media

Figures

Other

Tables

Share

Share

Share article link

Share