Main Findings
The main finding of this study was that NeuroQuant was more sensitive for detecting atrophy, abnormal asymmetry and progressive atrophy of the brain than the method of simple visual inspection traditionally used by radiologists. Furthermore, the NeuroQuant extended analysis was more sensitive for detecting atrophy than was the NeuroQuant standard analysis (the latter is called the “Age Related Atrophy” analysis by CorTechs Labs). The results of this study expanded on those of our previous related study
1 in several ways.
The NeuroQuant standard analysis found at least one sign of atrophy in 16.7% of patients; in contrast, the NeuroQuant extended analysis found at least one sign of atrophy in 50.0% of patients. This finding was not surprising, given the fact that the NeuroQuant standard analysis compared only three brain regions to normal controls, with left and right brain regions added together, for a total of three volumes; whereas the NeuroQuant extended analysis compared 15 brain regions to normal controls, with left and right brain regions analyzed separately, for a total of 30 volumes.
The radiologist’s traditional approach found at least one sign of atrophy in 12.5% of patients; this rate was similar to that of the NeuroQuant standard analysis.
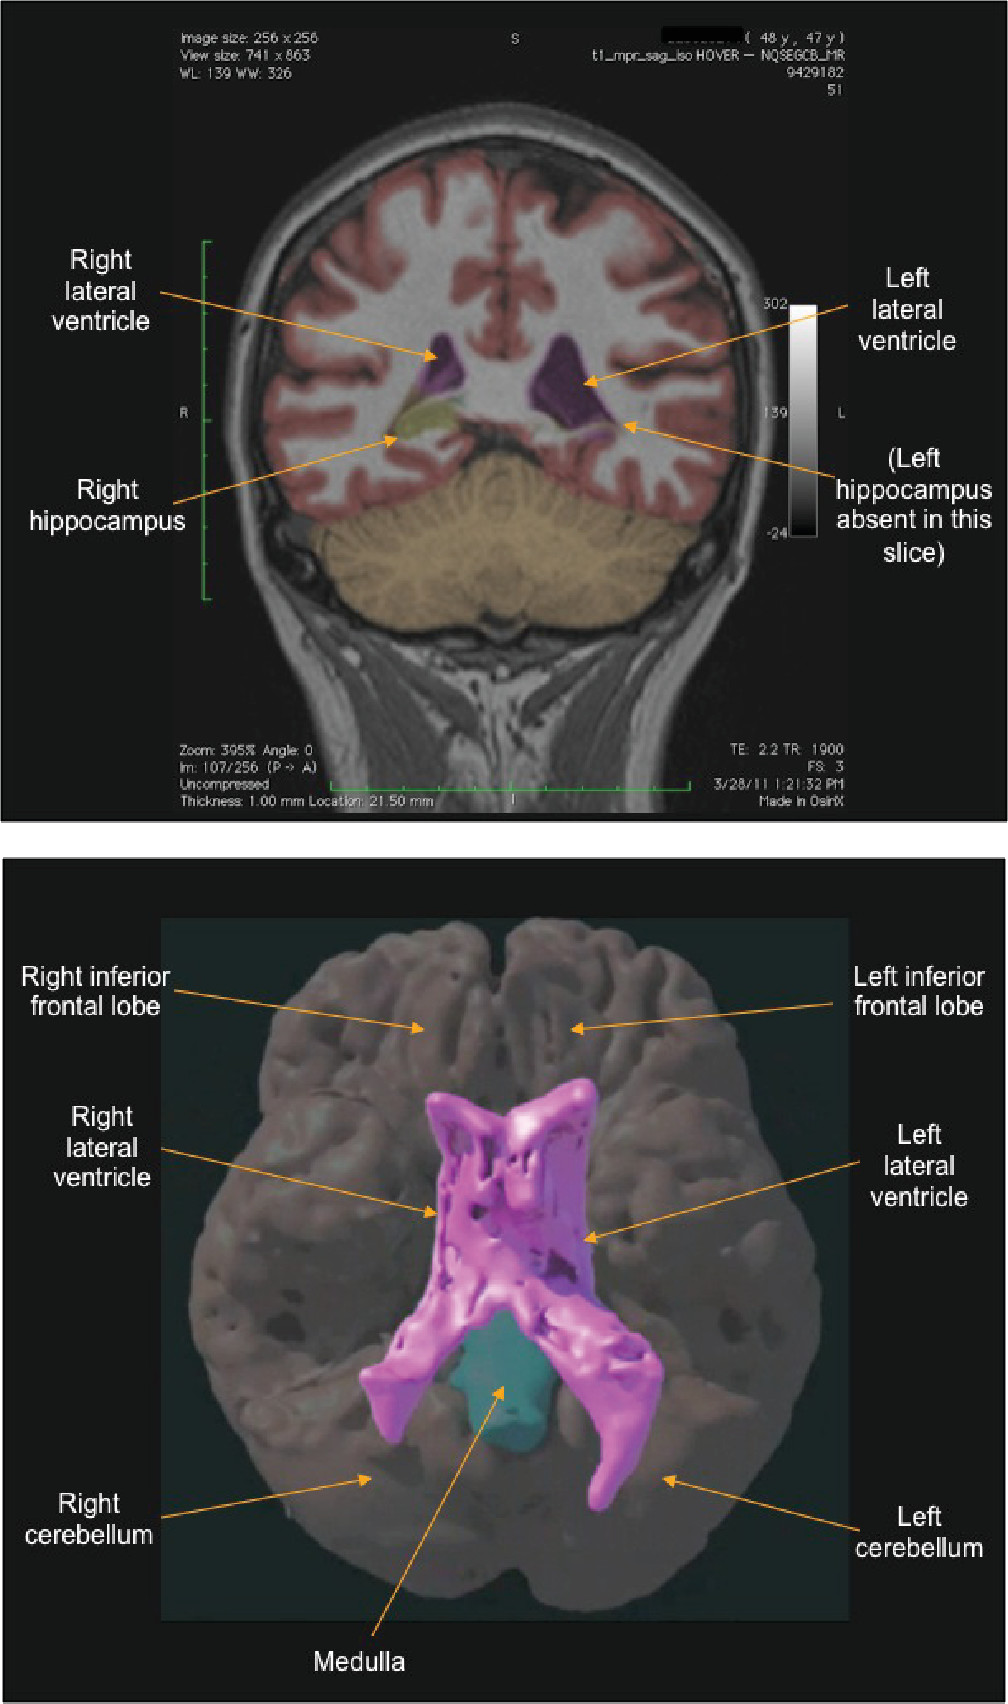
The radiologist’s traditional approach found no signs of abnormal asymmetry. In contrast, the NeuroQuant extended analysis found this abnormality in a majority (83.3%) of patients. Surprisingly, although there is a vast amount of clinical experience that TBI causes greater brain atrophy on the side of the impact (especially with penetrating injuries), there is little published literature on brain volume asymmetry in patients with TBI. In fact, a PubMed search by the authors using the terms “asymmetry” and “traumatic brain injury” found no studies in human subjects. The high rate of abnormal asymmetry found in the current study suggests that measurement of brain volume asymmetry could be an important area for future research.
Regarding the failure of the radiologists to identify abnormal asymmetry, there appear to be two explanations: 1) it is difficult to see subtle asymmetry, perhaps e.g. asymmetry indices<10%−15%; and 2) when asymmetry can be seen, it usually is interpreted as being within the normal range. Regarding the latter point, in our experience, radiologists occasionally notice asymmetry in brain structures, but in most cases, they believe it is within the normal range. However, when asked what the cutoff is between normal and abnormal asymmetry, usually they do not know, because they were not taught it and do not routinely measure brain volume. For example, the cutoff between normal and abnormal asymmetry of the lateral ventricles, based on our sample of ADNI normal controls, is about 25%. This degree of asymmetry is easily visible. So while it is true that some normal brain regions can be clearly asymmetric, it does not follow that, therefore, most of the obviously asymmetric regions in a subject’s brain are normal. The results of the current study showed that the large majority of the patients had abnormal asymmetry of the brain, and the radiologists failed to identify any sign of asymmetry. (Note that our sample consisted of patients with mild to moderate TBI whose symptoms persisted for months to years after the injury; therefore, these findings may not apply to patients whose symptoms completely abate within days to weeks after the injury.) The good news is that, now that computer-automated volumetric MRI techniques are readily available, radiologists and other brain specialists can learn what the cutoffs are between normal and abnormal asymmetry, and what the related brain images look like. In other words, not only has the machine beat man in this contest, the machine has begun teaching man how to do the job better.
Similar to the findings discussed above for asymmetry, the radiologist’s traditional approach found no signs of progressive atrophy, and the NeuroQuant extended analysis found this abnormality in a majority (70.0%) of patients. In our experience, unlike the case with asymmetry, most cases in which progressive atrophy occurred were difficult to appreciate visually, even using simultaneous visual inspection of both sets (time 1 and time 2) of NeuroQuant segmented brain images, which were coregistered in three-dimensional space. The reason for this seemed to be that changes of less than about 10%−15% of volume, typically spread throughout the three-dimensional brain structure, were difficult to see. And most of the longitudinal abnormal changes in brain volume were less than 10%−15%. In contrast, many of the abnormal asymmetries were greater than 15% and therefore were easier to appreciate visually. The fact that longitudinal abnormal changes are relatively difficult to see makes it more important that volumetric techniques be used to assess for these changes.
Limitations
Although brain atrophy or asymmetry commonly is caused by TBI, it is not always true in a given patient that atrophy or asymmetry found months or years after the injury was caused by the injury. Patients with persistent symptoms from TBI (like the patients in this study) often have pre-accident neurological or psychiatric disorders which can cause abnormal brain structure.
In comparison with the group of patients, the ADNI normal controls used in this study for the NeuroQuant extended analyses were significantly older. It is well-known that increasing age, especially over 50 years old, is associated with brain atrophy.
12–14 Because the ADNI normal controls were older than the patients in the current study, it was quite possible that the patients had a higher rate of atrophy than was revealed by the NeuroQuant analyses. Therefore, this was a conservative limitation. It was unlikely that NeuroQuant would have found atrophy in the patients when it did not actually exist, or that the results would have been biased in favor of NeuroQuant finding more atrophy than that found by the radiologists, who knew each patient’s age and could factor that information into their decision about presence of atrophy.
Furthermore, it was unlikely that the older ages of the normal controls affected the rates of asymmetry found by NeuroQuant because it is unlikely that normal aging in adults causes brain asymmetry. The primary effect of aging on brain volume is generalized atrophy, probably because the left side of the brain ages at the same rate as the right. This conclusion is supported by normal control data provided by CorTechs Labs, which shows that for multiple brain regions, volumes plotted versus age over the range of 18- to 90-years old showed no change of asymmetry with age.
There were some reasons why the radiologists involved may have underreported brain atrophy or asymmetry. They might have noticed some mild atrophy or asymmetry but not reported it because it did not seem clinically important. On the other hand, while it is true that there is no specific treatment for atrophy in patients with chronic TBI, atrophy does have prognostic value
2,11 and awareness of the existence of atrophy may be the first step toward developing treatments to halt its progress. In support of the radiologists, they were not informed that they were being checked against a machine, and if they were asked to detect the mildest asymmetry or atrophy, perhaps they would have been more sensitive. But the purpose of this study was to assess how radiologists would perform in a typical clinical setting, and tipping them off would have unnecessarily unblinded that aspect of the study. Finally, one could argue that, if the cutoffs for abnormality used in this study (5% and 95%) had been made more stringent (1% and 99%, for example), the radiologists might have fared better because it was more likely that they noticed severe atrophy. Although the latter point is true, the problem with using stricter criteria for the cutoffs for abnormality would be the failure to identify patients with mildly abnormal volume.
The radiologists had a potential advantage over NeuroQuant (which was based only on a T1 MRI sequence) because they had a greater range and amount of brain imaging data available (including T2, FLAIR, etc., in addition to the T1 sequence). Therefore, at least with respect to this issue, the results could have been biased in the favor of the radiologists finding atrophy. The fact that the results actually showed the opposite make it somewhat more remarkable that NeuroQuant was more sensitive for detecting atrophy or asymmetry than was the traditional approach used by the radiologists.


