Design and Patients
This prospective, observational study was performed in the 32-bed mixed ICU of the University Medical Centre Utrecht (The Netherlands) in a convenient sample. A waiver for informed consent was obtained from the local Medical Ethics Committee (Institutional Review Board number 10-181). All patients were informed of the purpose and measurements of the study, the confidentiality of the data being collected, and about their right to refuse to participate.
Patients from 30 to 80 years of age, admitted for more than 24 hours, were eligible for inclusion. Exclusion criteria were those conditions with expected or profound autonomic dysfunction: a history of any neurological disease, diabetes mellitus, end-stage renal failure, chronic obstructive pulmonary disease Gold stage IV, depression or anxiety disorder, coronary artery disease, heart transplantation, and severe sepsis. Additionally, patients with preexisting or new-onset cardiac arrhythmias or those receiving any adrenergic blocking agents or agonists were excluded.
Data Collection
Demographic data were collected at inclusion. Comorbidity at hospital admission was registered with the Charlson Comorbidity Index.
5 Severity of illness at ICU admission was assessed using the Acute Physiology and Chronic Health Evaluation version IV score.
6 The Sequential Organ Failure score was used to estimate the severity of illness.
7Eligible patients were screened for delirium using the Dutch version of the confusion assessment method for the ICU by a trained physician.
8 In case of doubt, a neurologist (A.J.C.S.) was consulted who applied the DSM-IV criteria for delirium, based on clinical assessment for cognitive dysfunction and a review of the medical charts.
9 Additionally, the Richmond Agitation and Sedation Score
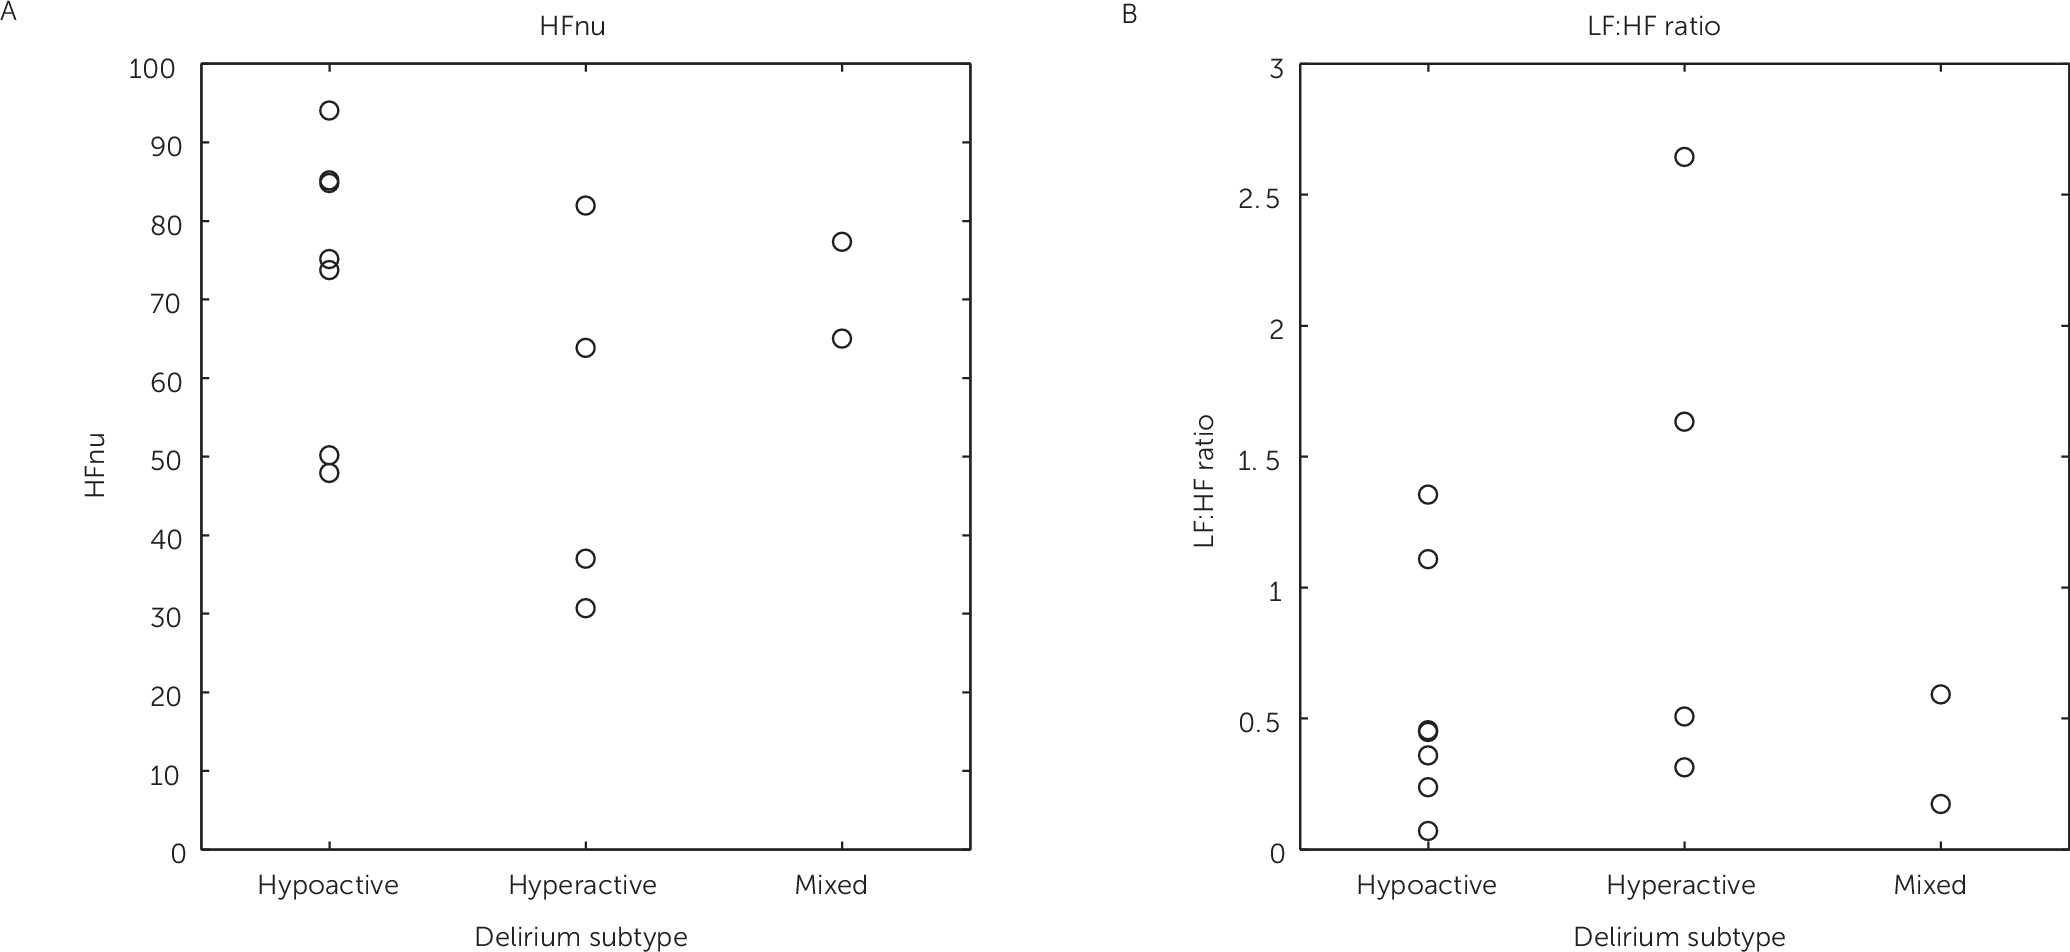
10 was used to classify different delirium subtypes.
11 Hypoactive delirium was defined in persistent neutral or negative Richmond Agitation and Sedation Score scores (ranging from 0 to −3).
11 Hyperactive delirium was present in patients with all positive Richmond Agitation and Sedation Score scores (ranging from +1 to +4).
11 When both positive and negative Richmond Agitation and Sedation Score values were scored, patients were classified as having mixed-type delirium.
11Bipolar chest lead ECG was recorded in each patient for 15 minutes. In 10 patients, data were acquired for 2 days at four time points (8:00 a.m., 11:00 a.m., 2:00 p.m., and 5:00 p.m.) during the day to assess circadian influence. As no circadian rhythm could be shown, data from all time points for a particular patient could be pooled. Therefore, subsequently included patients could be measured less frequently with a minimum of one measurement to increase feasibility. During HRV measurements, every effort was made to keep the environmental conditions stable throughout data acquisition. All patients were in a temperature-controlled room in supine position. During HRV assessment, there were no interventions or changes in ventilator settings. As delirium is characterized by its fluctuating nature, only those measurements with patients scored delirious were included in the analysis.
All data were sampled at 500 Hz and monitored online (software Poly 5; Physiological Analysis Package, Inspector Research Systems, Amsterdam, The Netherlands). During off-line analyses, we verified all heartbeats detected by the software and manually corrected the software algorithm when necessary. From each 900 seconds of recording, a maximum of three 300-second time series were obtained that were devoid of artifacts and of ectopic heartbeats. When no 300-second period was available, we used at least 180-second periods, which has been described as sufficient.
3,12 The power spectrum of the tachogram was computed using fast-Fourier transformation. For analysis of the power spectrum, fixed frequency bands were used, according to the guidelines of the Task Force of the European Society of Cardiology and the North American Society of Pacing and Electrophysiology.
3 Very LFs (VLFs) were defined as frequencies <0.04 Hz, low frequencies (LFs) as frequencies between 0.04 and 0.15 Hz, and high frequencies (HFs) as frequencies between 0.15 and 0.40 Hz.
3 The area under the power spectral curve is considered the total power.
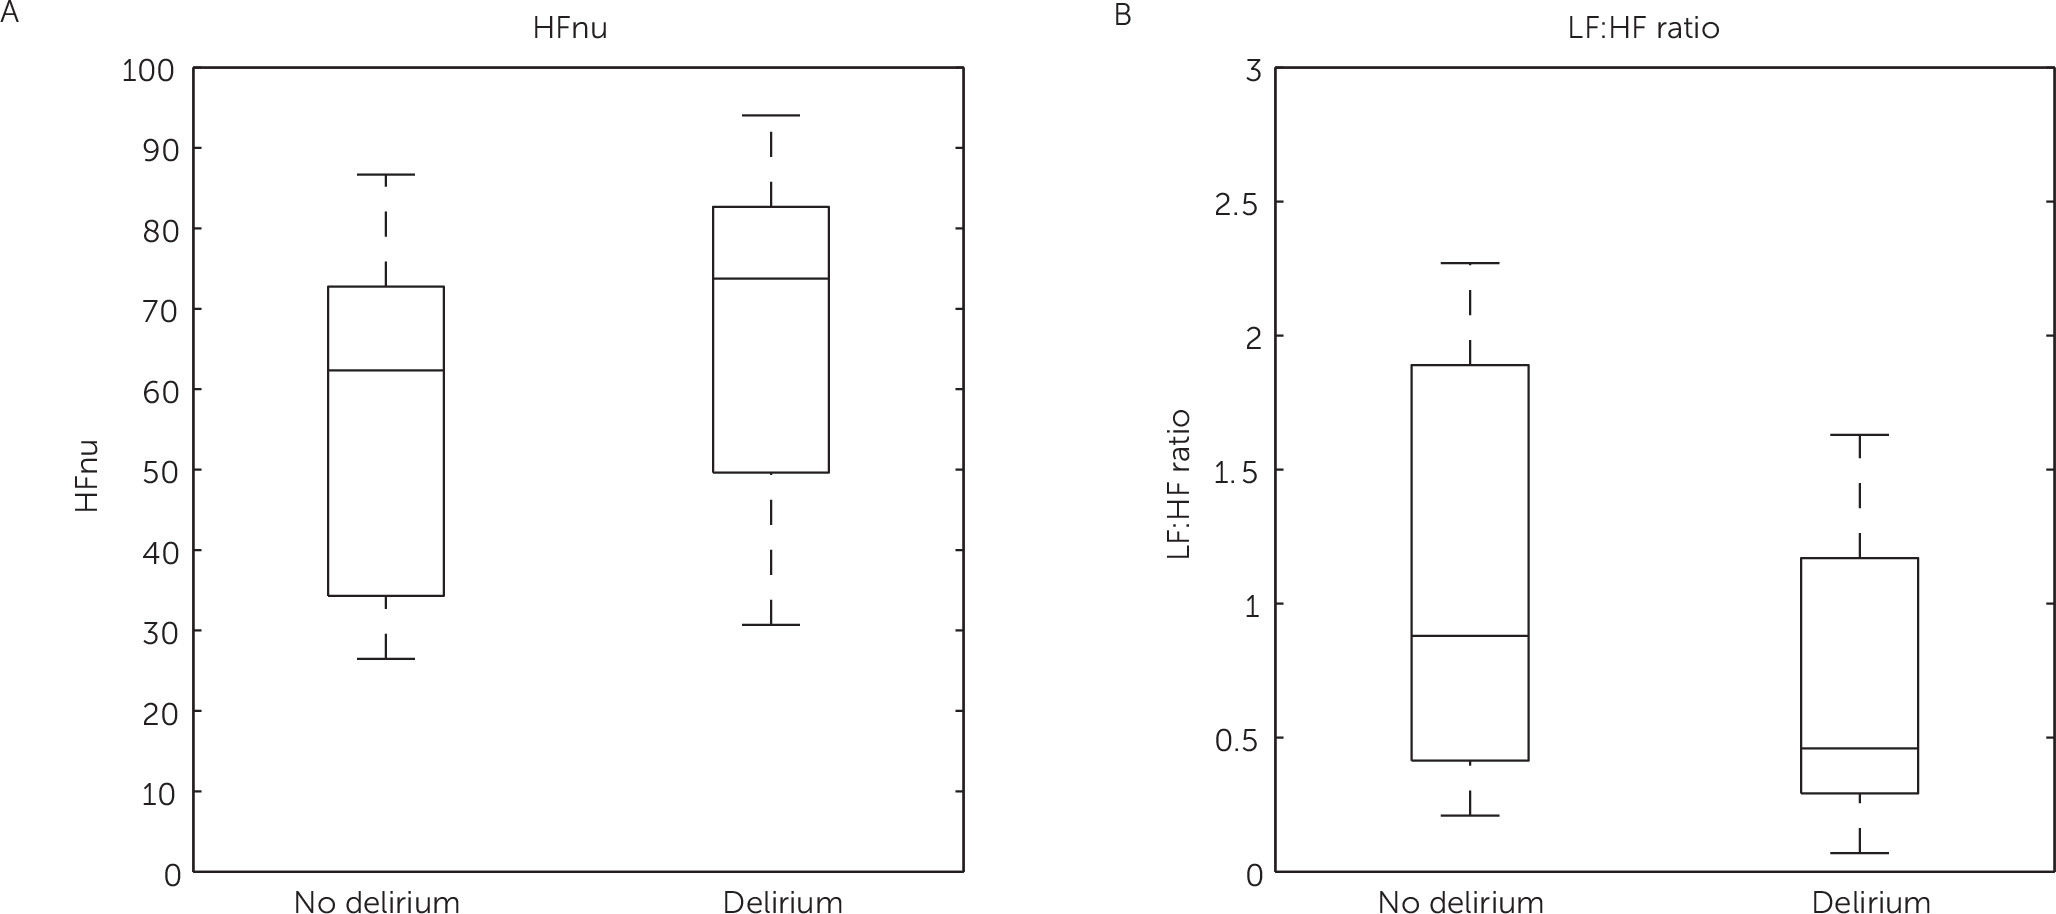
3 Because of differences in spectral power between patients, HF power was converted to normalized units (nu) calculated as HFnu=HF/(total power – very LF) × 100. LFnu was not calculated as it is reciprocal to HFnu and would not provide additional information.
3 It has been shown that the LF is a measure for activity of both the parasympathetic and the sympathetic system, whereas the HF and thus HFnu are solely measures of parasympathetic activity.
3 The LF:HF ratio reflects sympathovagal balance and is therefore a measure for increased or decreased HRV.
3Statistical Analysis
Because the HRV frequency domain parameters are known to be skewed, we used log-transformed data of the LF power, HF power, and LF:HF ratio for statistical analysis. Differences between groups were assessed using Fisher’s exact test, Student t test, Kruskal-Wallis test, or Mann-Whitney U test where appropriate. Multivariable linear regression was used to evaluate the effect of delirium on HRV independent from age, gender, and severity of disease. Statistical tests were performed against two-sided alternatives, and p<0.05 was defined as being significant. Statistical analysis was performed using R version 3.0.1 and SPSS (SPSS 20; IBM, New York, NY).


