Anatomical connectivity studies in healthy individuals and in persons with visuospatial attention–spatial neglect have demonstrated that the superior longitudinal fasciculus (SLF), inferior fronto-occipital fasciculus (IFOF), and inferior longitudinal fasciculus (ILF) are strongly linked to visuospatial attentional abilities (
1,
2). Right-handed healthy individuals present a left-hemispheric dominance for language (
3–
5) and a right-hemispheric dominance for visuospatial attention (
1,
2). In contrast, persons with schizophrenia present decreased leftward hemispheric functional lateralization for language (
6,
7) and underlying anatomical organization of disrupted white matter (
8–
12). No previous studies have investigated the anatomy or structural asymmetry of the SLF, IFOF, and ILF in schizophrenia, despite anatomically related visual attentional impairments (
13–
15) that may contribute to problems with everyday function. Accordingly, identifying anatomical abnormalities underlying these attentional deficits in persons with schizophrenia is important.
The visuospatial attentional network consists of several cortical epicenters that form a large-scale and bilaterally distributed neurocognitive system (
16), interconnected by fiber bundles. Corbetta and Shulman (
17) proposed a subdivision of these epicenters into dorsal and ventral streams in healthy individuals. The SLF commonly supports the dorsal and ventral streams and is subdivided into the dorsal (SLF I), middle (SLF II), and ventral (SLF III) branches (
18). SLF II mediates direct communication between SLF III and SLF I. Globally, these streams are involved in various visuospatial attentional abilities (
2,
19,
20). Thiebaut de Schotten et al. (
2) found a lateralized dorsal-ventral gradient with a symmetric SLF I between the two hemispheres, a rightward asymmetry of the SLF III, and a tendency to a larger SLF II in the right hemisphere. Another group has replicated the rightward asymmetry of the SLF III (
21). Thiebaut de Schotten et al. (
2) demonstrated that asymmetry of the SLF II could predict behavioral performance on a visuospatial attention task, showing that a larger right-hemisphere SFL II corresponds with faster reaction times in the left hemifield during a line bisection task.
Other fiber bundles, such as the IFOF and ILF, also contribute to the ventral processing stream. These bundles also are involved in various visuospatial attentional abilities (
1,
22–
25). Regarding their anatomical asymmetry, Chechlacz et al. (
21) found that IFOF volume in healthy individuals is distributed symmetrically between the two hemispheres and that the IFOF is lateralized rightward with respect to integrity. In their work, the data were extracted to diffusion tensor imaging (DTI), which characterizes properties of white matter (
26). Recent studies have identified leftward anatomical asymmetry for the ILF with respect to integrity (
27,
28).
Using DTI tractography, we performed the first assessment of the integrity and volume of fasciculi underlying the visuospatial attentional network (SLF I, SLF II, SLF III, ILF, and IFOF) in both hemispheres and studied their structural asymmetry in persons with schizophrenia and in healthy individuals. Our hypothesis was that compared with healthy individuals, persons with schizophrenia would show a loss of white matter pathway integrity and of structural asymmetry.
Methods
All participants provided informed, written consent in accordance with the Declaration of Helsinki, and the local ethics committee (Comité de Protection des Personnes Nord-Ouest, France) approved the experimental protocol.
Participants
Participants were recruited from Caen University Hospital (Caen, France) and the surrounding community. Participants with schizophrenia or schizoaffective disorder were identified by using DSM-IV criteria and were assessed with the Positive and Negative Syndrome Scale (PANSS) (
29). The healthy individuals did not meet criteria for lifetime psychotic disorders (they did not take antipsychotic-anxiolytic medication) or substance dependence (including alcohol), as assessed by the Mini International Neuropsychiatric Interview. Lifetime habits, such as tobacco consumption, were not collected for either group, although this variable could be an additional confounding factor in the interpretation of our findings. All participants were required to be free of neurological disorders and cerebral abnormalities.
Data Acquisition
Neuroimaging data were acquired on a 3-T scanner (Intera Achieva, Philips Medical Systems, Eindhoven, the Netherlands). Three-dimensional, high-resolution T1-weighted brain volumes were acquired (three-dimensional fast-field echo turbo-field echo sequence: 256 × 256 matrix size with 180 contiguous slices, 256-mm field of view, 1-mm isotropic resolution, sagittal slice orientation, 20-ms repetition time, 4.6-ms echo time, 10° flip angle, 800-ms inversion time, and a SENSE factor of 2). In addition, a T2-weighted scan was acquired for each participant (T2 turbo spin echo sequence: 256 × 256 matrix size with 81 contiguous slices, 256-mm field of view, 2-mm isotropic resolution, sagittal slice orientation, 5,500-ms repetition time, 80-ms echo time, 90° flip angle, and a SENSE factor of 2).
We obtained diffusion-weighted images by using a diffusion-weighted imaging sequence from 21 directions with one image without diffusion weighting (factor b=1,000 seconds/mm2, 112 × 112 matrix size with 70 contiguous slices, 224-mm field of view, 2-mm isotropic resolution, axial slice orientation, 8,500-ms repetition time, 81-ms echo time, 90° flip angle, and a SENSE factor of 2.5).
Data Analysis
For preprocessing of anatomical data, we used SPM5 software subroutines (Statistical Parametric Mapping, Wellcome Department of Cognitive Neurology, London,
http://www.fil.ion.ucl.ac.uk/spm), which allowed us to obtain classical anatomical images in MNI space (Montreal Neurological Institute, Canada). We chose normalization parameters by default and used the deformation field from the normalization for subsequent processing of DTI data.
The method used to extract diffusion values into the different tracts has been published previously (
8,
30). Briefly, the preprocessing of diffusion data used different steps (movement and eddy current correction; calculation of diffusion tensor model [DTIFIT; FDT FMRIB’s Diffusion Toolbox]) of FSL software (FLIRT, FMRIB Software Library, Oxford, United Kingdom,
http://www.fmrib.ox.ac.uk/fsl), which allowed us to obtain diffusion maps of fractional anisotropy (FA), radial diffusivity (RD), and mean diffusivity (MD) (RD and MD in mm
2/second) for each participant. Fiber tracking was reconstructed from the diffusion-weighted images for each participant within the frontoparietal network in both the right and left hemispheres. Thus the SLF was subdivided into three branches: SLFI
R/SLFI
L, SLFII
R/SLFII
L, and SLFIII
R/SLFIII
L (R, right; L, left). The IFOF
R/IFOF
L and the ILF
R/ILF
L were also reconstructed. To reconstruct all of these fasciculi in each participant, we applied a probabilistic tractography method to transfer regions used as “seed” or “avoid” regions (belonging to automated anatomical labeling gray matter [
31] or Mori’s gray matter and white matter atlases [
32]) into the diffusion space where the different tracts were created (
33,
34).
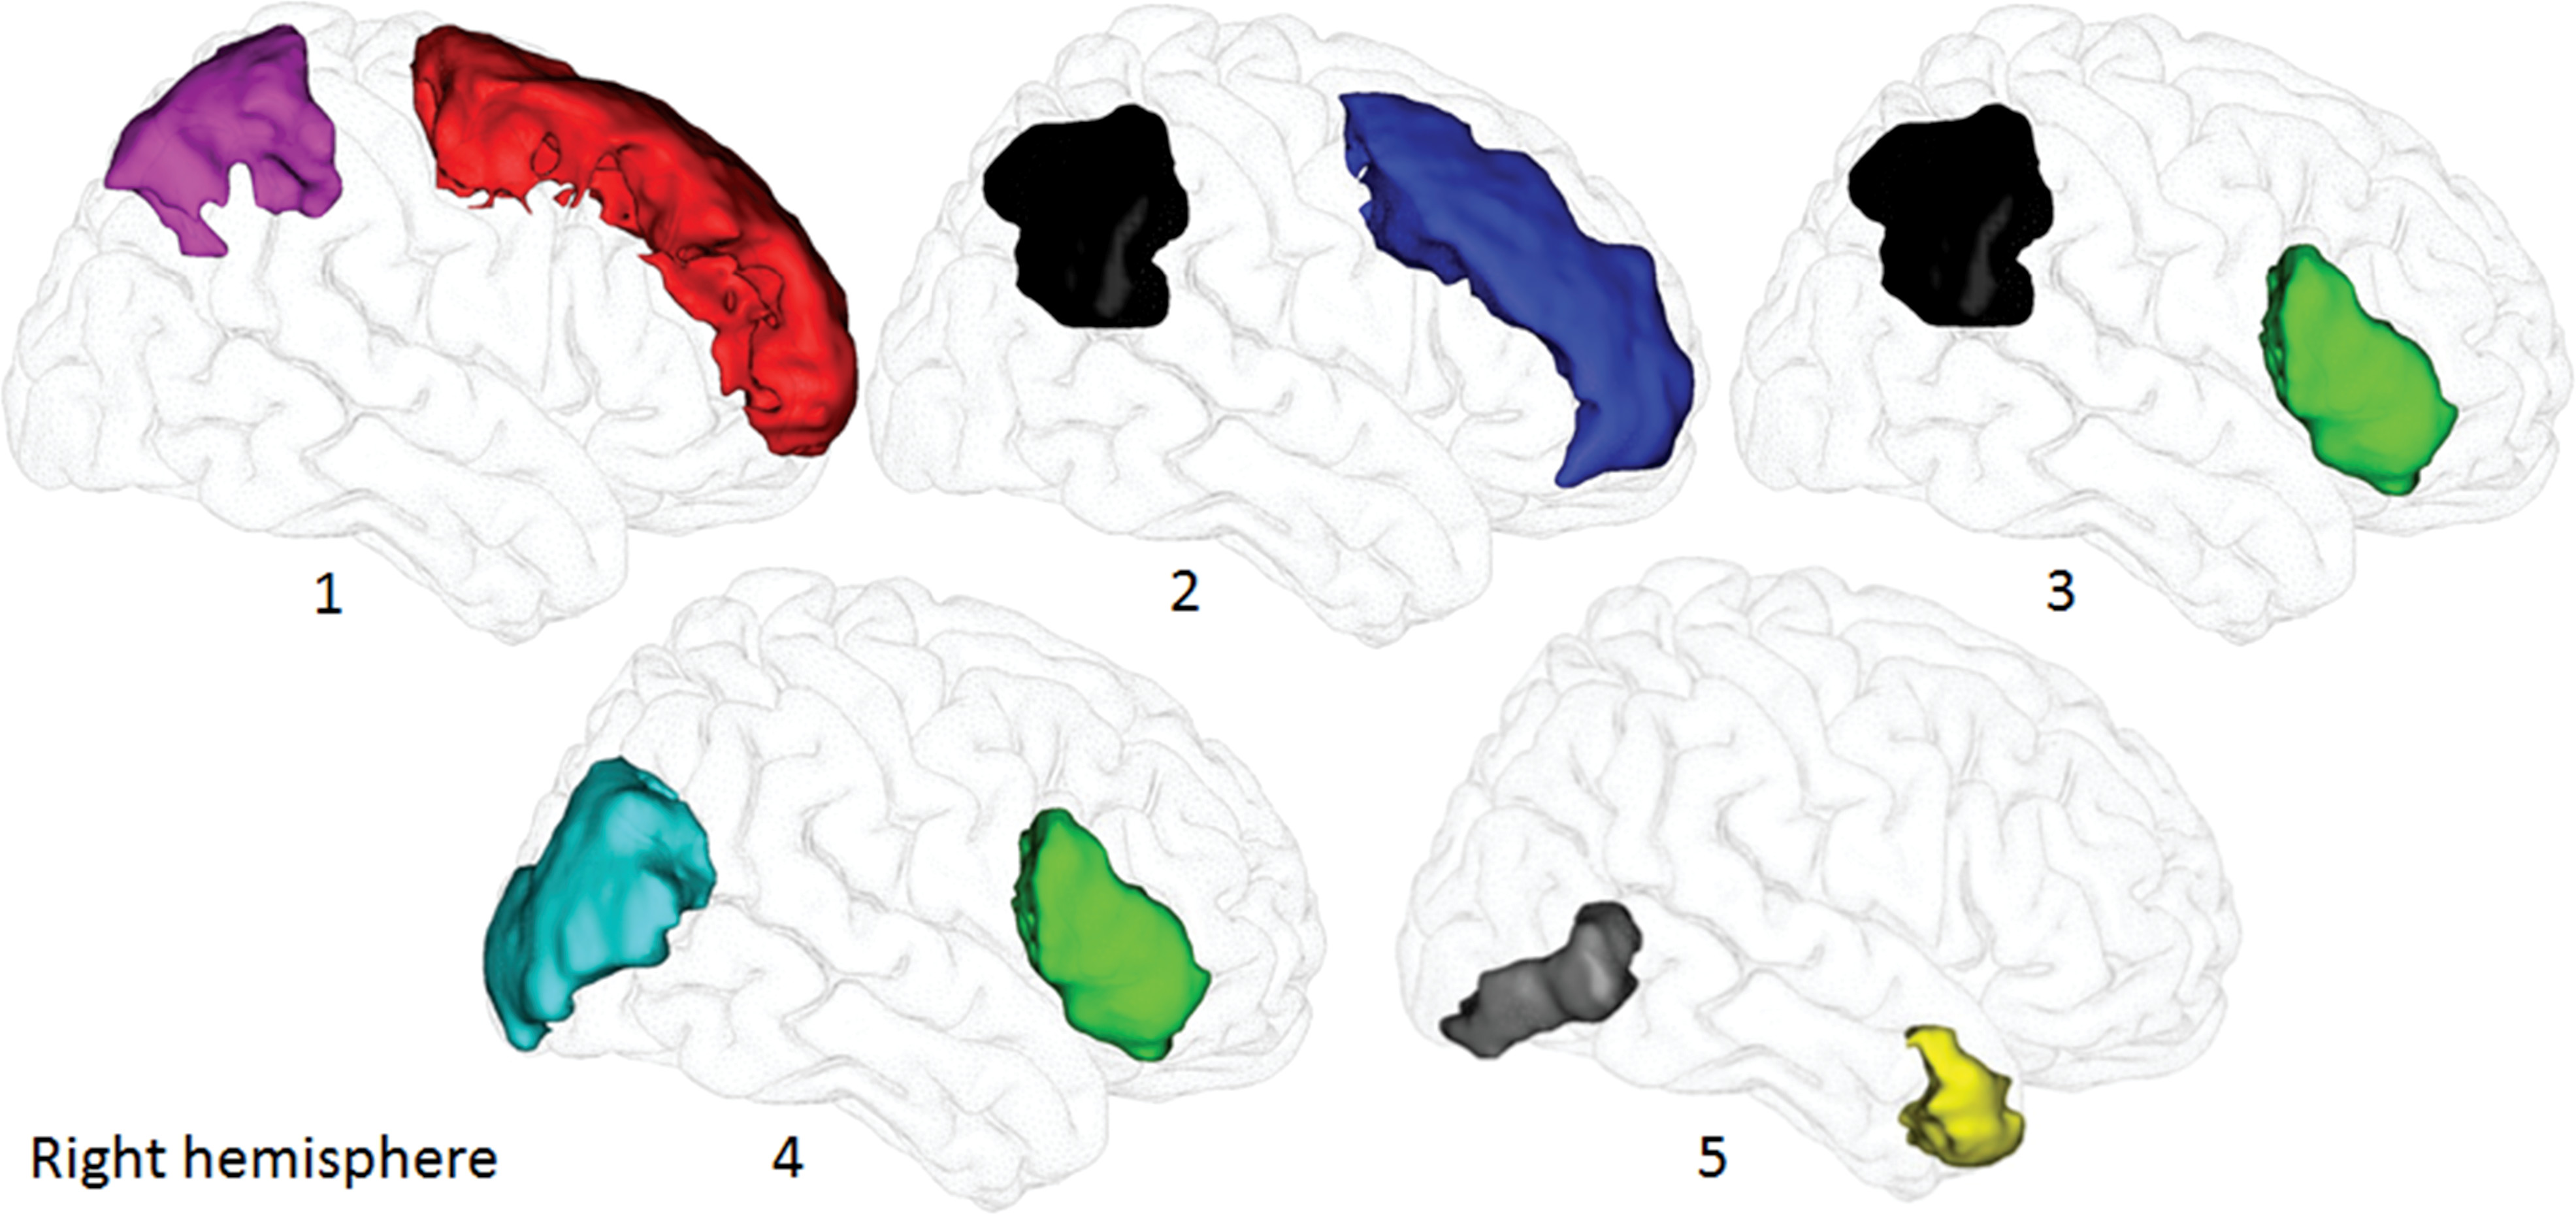
The SLFI
R/SLFI
L was reconstructed between the left or right superior frontal and superior parietal gyri, respectively; the SLF II between the middle frontal and inferior parietal gyri (angular gyrus); and the SLF III between the inferior frontal and inferior parietal gyri (
2,
35), according to Mori’s gray matter atlas (
Figure 1). We used the temporal lobe as the “avoid” region to exclude fibers of the arcuate fasciculus. The IFOF
R/IFOF
L was reconstructed between the inferior frontal and middle occipital gyri (
25,
36), according to Mori’s gray matter atlas, and we used the ILF from Mori’s white matter atlas as the “avoid” region because of fibers in common with IFOF. Then, we reconstructed the ILF
R/ILF
L between the anterior temporal pole (automated anatomical labeling gray matter atlas) and inferior occipital cortex (Mori’s gray matter atlas) (
36,
37) and used the IFOF as the “avoid” region (Mori’s white matter atlas).
Next, we registered the ten tracts and diffusion maps for each participant in the MNI space. For this purpose, we used a deformation field previously calculated by using a fully automated in-house normalization method to individually extract and compare mean values for all diffusion parameters (anisotropy values: FA; diffusivity values: RD and MD) and white matter volume (number of voxels) between groups. In brief, this method consists of initially registering rigidly the native T
2-weighted volume onto the T
1 acquisition, followed by rigid and nonlinearly spatially normalized registration of the individual image without diffusion weighting onto the first-created image. The transformation matrix, resulting from this spatial registration, is combined with the transferred individual T
1-weighted images in the MNI space in order to register individual tracts/diffusion maps directly into standard space (
30). Per standard practice, we defined white matter abnormalities as loss of integrity characterized by decreased FA (axonal degeneration) and increased RD/MD (demyelination) (
26,
30,
38). (All individual fasciculi in the diffusion space in participants with schizophrenia are displayed in Figure S1 in the
online supplement.)
Statistical Analysis
Analyses of covariance (ANCOVAs) were computed separately to test differences in the integrity of diffusion data between the two groups and between the two hemispheres for each tract. For each tract (SLF I, SLF II, SLF III, IFOF, and ILF), we performed a repeated-measures ANCOVA (with participants as random effect) with each diffusion parameter (FA, RD, and MD) as the dependent variable and group and hemisphere as independent factors. The analyses included sex and tract volume as covariates, and the group-by-hemisphere interaction was tested. Using Tukey’s HSD test to correct for multiple comparisons, we conducted post hoc analyses when a significant main effect emerged.
Intragroup correlation analyses (Pearson) between anatomical and clinical data were also conducted for participants with schizophrenia to evaluate the impact of antipsychotic dosages (in chlorpromazine equivalents), duration of illness, and severity of symptoms (PANSS positive, negative, and general subscores and total PANSS scores) on white matter integrity/volume and their asymmetry index (AI). AI was based on the following formula: AI=100 × (right hemisphere – left hemisphere) / (right hemisphere + left hemisphere), where positive (AI > 0) and negative (AI < 0) AIs correspond to rightward and leftward asymmetries, respectively. With a Bonferroni correction for multiple comparisons, correlations were considered statistically significant when p<0.0071.
We performed all statistical analyses with JMP v13.0 Software (SAS Institute, Cary, N.C.). The significance level for other analyses was set at p<0.05.
Results
Thirty-four participants with schizophrenia or schizoaffective disorder and 69 unaffected individuals met study inclusion criteria. All participants were right-handed (self-reported). The two groups did not significantly differ with respect to sex, age, or years of education (
Table 1). All participants with schizophrenia were stabilized outpatients with no change in their treatment during the past month. Most of them were treated with monotherapy (
Table 1), and some had additional concomitant medication (mainly hypnotics or anxiolytics). The values for all diffusion parameters and volumes for each tract are presented in
Table 2.
Anatomical Data: SLF I–III, IFOF, and ILF
For the SFLI, a group-by-hemisphere interaction was observed for MD (ANCOVA: F=4.0, df=1, 100, p=0.047); however, Tukey’s HSD tests showed no differences.
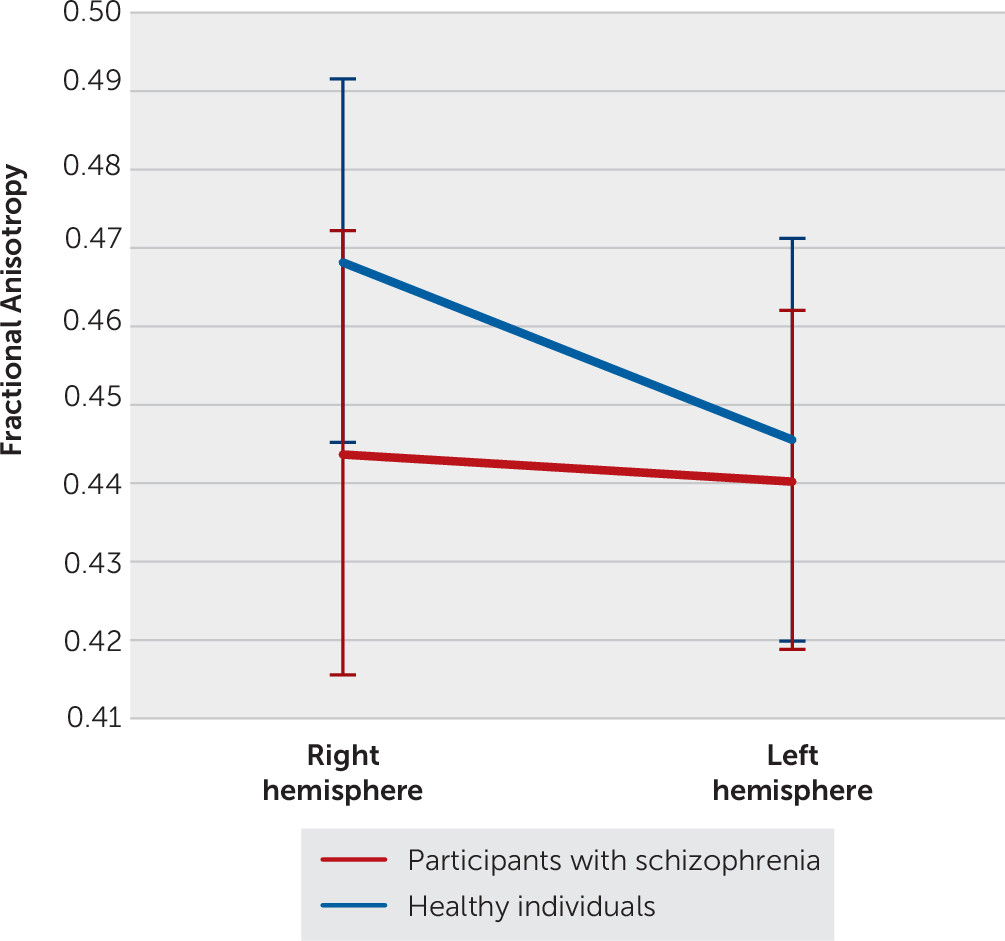
In the analysis of SLF II, ANCOVAs revealed a significant group-by-hemisphere interaction for all diffusion parameters (FA: F=14.7, df=1, 100, p=0.0002; RD: F=8.8, df=1, 100, p=0.0038; MD: F=4.9, df=1, 100, p=0.030). Healthy individuals presented increased FA and decreased RD/MD in the right hemisphere, compared with participants with schizophrenia (Tukey’s HSD tests; FA: F=21.3, df=1, 156, p<0.0001; RD: F=16.3, df=1, 176, p=0.0006; MD: F=11.1, df=1, 179, p=0.0067). Healthy individuals also exhibited increased FA and decreased RD/MD in the right hemisphere, compared with the left hemisphere (Tukey’s HSD tests; p<0.0001 for all values; FA: F=65.1, df=1, 104; RD: F=37.2, df=1, 105; MD: F=29.0, df=1, 105) (
Figure 2). In participants with schizophrenia, the hemispheres did not differ for any measures.
For the SLF III, we observed a strong tendency for group-by-hemisphere interaction for FA (ANCOVA: F=3.7, df=1, 101, p=0.056). Healthy individuals presented increased FA in the right hemisphere, compared with participants with schizophrenia (Tukey’s HSD test: F=20.5, df=1, 177, p<0.0001). Both groups displayed increased FA in the right hemisphere, compared with the left (Tukey’s HSD tests; healthy individuals, F=51.8, df=1, 101, p<0.0001; participants with schizophrenia, F=7.2, df=1, 101, p=0.028).
For the IFOF and ILF, ANCOVAs revealed no group-by-hemisphere interaction for any values.
Relationships of Anatomical and Clinical Data
Finally, we computed correlations between anatomical and clinical data and found a significant, negative correlation between FA values for the ILFL and antipsychotic dosages (p=0.0046, r=−0.48). No other significant correlations emerged.
Discussion
This study was the first to compare structural asymmetry differences in the fiber bundles corresponding to visuospatial attentional abilities in terms of integrity/volume in participants with schizophrenia, compared with healthy individuals. The main findings were reduced integrity in the SLF II (FA, RD, and MD) and the SLF III (FA) in participants with schizophrenia. Participants in both groups exhibited a rightward asymmetry for the SLF III with respect to integrity; by contrast, only healthy individuals presented a rightward asymmetry of the SLF II.
Our results highlight aberrant integrity within the SLF II and the SLF III in participants with schizophrenia, compared with healthy individuals, characterized by neuronal loss (decreased FA) or demyelination of fibers (increased RD and MD). To our knowledge, this study is the first to reveal a difference in integrity between participants with schizophrenia and healthy individuals regarding anatomical organization corresponding to visuospatial abilities. The most striking result of this study is the asymmetry difference between the two groups in the SLF II with respect to integrity. The integrity loss observed in participants with schizophrenia, which was more marked in the SLF II (FA, RD, and MD) and related to both axonal reduction and decreased myelin sheath, might underlie the abnormal asymmetry of this fasciculus in this population. Indeed, previous studies in healthy individuals have shown that a frontoparietal anatomical network, the SLF, supports visuospatial attentional processes, with partial hemispheric lateralization to the right hemisphere (
2,
21).
Our results in healthy individuals are in agreement with those of Thiebaut de Schotten et al. (
2), who investigated hemispheric specialization of the visuospatial attentional network. They showed that structural lateralization in the SLF with respect to integrity presents a dorsal-ventral gradient characterized by rightward lateralization for the SLF III and SLF II and symmetric organization for the SLF I. Our findings for the participants with schizophrenia suggest a disturbance of this dorsal-ventral gradient that is classically observed in healthy individuals, with a loss of asymmetry in the SLF II. Such changes in this fasciculus could be the source of cognitive deficits in attentional processes.
The differences in anatomical organization observed between the two groups in our study may represent the substrate for differences in visuospatial attentional abilities. The SLF II directly connects the dorsal (SLF III) and ventral (SLF I) streams, which are both especially involved in visual attentional information processing, and appears to modulate between the two. Therefore, SLF II differences may be associated with the visuospatial attentional deficits that accompany schizophrenia (global-local processes [e.g.,
13,
39–
42]). Further studies are necessary to determine which visuospatial attentional abilities such differences affect.
This study had some limitations. First, regarding participants, the number of patients with schizophrenia was small. We also lacked data on lifestyle factors, such as smoking, for both groups, leaving the potential for cofounding. Moreover, all recruited patients were right-handed and thus represent only a subset of persons with schizophrenia spectrum disorders. A similar study with left-handed participants or a mixture regarding handedness would be interesting. Second, combining structural data with behavioral and functional neuroimaging data might provide finer-grained neuroanatomical information regarding the visuospatial attentional network. Third, the diffusion-weighted image sequence was limited to 21 gradient directions and to a b-value of 1,000, which does not completely overcome issues of crossing and branching fibers. For this reason, we did not test axial or parallel diffusivity (i.e., parallel diffusivity, the diffusion of water along the direction of the principal diffusion), because it lacks sensitivity for regions with branching and crossing white matter fibers (
38), such as the intrahemispheric tracts included here. Fourth, we carried out our analyses with SPM5 rather than SPM12. We made this choice because data for our sample were previously acquired and preprocessed for other studies using SPM5 (
43). Nevertheless, we conducted a crucial quality control on the ten tracts of the 103 participants. In addition, SPM was used only to transfer tracts/diffusion maps into the MNI common space and not for extracting quantitative data. Finally, we did not directly investigate the visuospatial attentional network because the white matter fasciculi connecting its regions do not really constitute a network; thus our results should be interpreted with caution. Despite these limitations, this study is the first to describe the structural organization of fasciculi underlying visuospatial attentional abilities in schizophrenia.
Conclusions
Our findings revealed a specific disruption of structural connectivity (loss of integrity) in the SLF II and abnormal anatomical asymmetry (loss of asymmetry) of this fasciculus between the two hemispheres in participants with schizophrenia. These abnormalities could be one substrate of attentional deficits and alterations that underlie visuospatial disabilities in people with schizophrenia. The results provide new insight into the neuroanatomical basis of the atypical visuospatial attentional network in schizophrenia and offer new understanding of how people with schizophrenia perceive and process their visual world.
Acknowledgments
The authors thank Annick Razafimandimby, Ph.D., Frederic Briend, Ph.D., and Vincent Marzloff, Ph.D., for their technical assistance and Perrine Brazo, Ph.D., for her clinical contribution.


