Effect of Functional BDNF and COMT Polymorphisms on Symptoms and Regional Brain Volume in Frontotemporal Dementia and Corticobasal Syndrome
Abstract
Objective:
Methods:
Results:
Conclusions:
Methods
Participants
| Characteristic | FTD and PPA | CBS | COMT Val+ | COMT Val− | Correlation with COMT Val dose | p | BDNF Met+ | BDNF Met− | Correlation with BDNF Met dose | p |
|---|---|---|---|---|---|---|---|---|---|---|
| Gender (N) | ||||||||||
| Male | 63 | 36 | 96 | 23 | 92 | 4 | ||||
| Female | 47 | 28 | 53 | 21 | 70 | 3 | ||||
| Age at onset (years; mean) | 55.9 | 59.1 | 57.2 | 57.0 | 0.04 | 60.0 | 62.9 | −0.00 | ||
| Age at onset (years; SD) | 8.0 | 7.9 | 8.2 | 8.2 | 7.9 | 4.1 | ||||
| Handedness (N) | ||||||||||
| Right-handed | 89 | 57 | 106 | 36 | 136 | 5 | ||||
| Left-handed | 14 | 4 | 13 | 5 | 16 | 2 | ||||
| Ambidextrous | 1 | 1 | 2 | 0 | 2 | 0 | ||||
| Education (years; mean) | 15.8 | 15.0 | 15.4 | 15.6 | −0.05 | 15.5 | 14.4 | 0.11 | ||
| Education (years; SD) | 2.7 | 2.6 | 2.8 | 2.7 | 2.7 | 3.6 | ||||
| Composite scores | ||||||||||
| Composite executive measure (mean) | 0.01 | −0.02 | −0.06 | 0.21 | −0.21 | 0.08* | −0.01 | 0.16 | −0.01 | 0.97 |
| Composite executive measure (SD) | 0.41 | 0.51 | 0.40 | 0.48 | 0.45 | 0.56 | ||||
| Composite memory measure (mean) | 17.15 | 18.60 | 17.49 | 18.44 | −0.05 | 0.58 | 17.49 | 21.67 | −0.04 | 0.64 |
| Composite memory measure (SD) | 7.19 | 6.79 | 6.89 | 7.16 | 7.05 | 7.61 | ||||
| Composite motor measure (mean) | 0.15 | −0.24 | −0.19 | 0.05 | −0.07 | 0.53 | −0.13 | −0.01 | −0.08 | 0.51 |
| Composite motor measure (SD) | 0.92 | 0.78 | 0.87 | 0.79 | 0.84 | 1.05 | ||||
| Neuropsychiatric Inventory score | ||||||||||
| Total mean | 26.91 | 10.53 | 20.55 | 22.14 | −0.03 | 0.76 | 20.47 | 23.33 | −0.04 | 0.67 |
| Total SD | 16.75 | 10.48 | 16.85 | 16.90 | 16.99 | 15.02 | ||||
| Delusions mean | 0.33 | 0.08 | 0.21 | 0.34 | −0.08 | 0.29 | 0.23 | 0.00 | 0.01 | 0.25 |
| Delusions SD | 1.11 | 0.44 | 1.00 | 0.80 | 0.92 | 0.00 | ||||
| Hallucinations mean | 0.32 | 0.00 | 0.27 | 0.00 | 0.11 | 0.20 | 0.20 | 0.00 | 0.13 | 0.12 |
| Hallucinations SD | 1.15 | 0.00 | 0.27 | 0.00 | 0.96 | 0.00 | ||||
| Agitation mean | 2.68 | 1.22 | 2.05 | 2.63 | −0.11 | 0.21 | 2.12 | 2.50 | −0.07 | 0.42 |
| Agitation SD | 3.07 | 1.92 | 2.73 | 3.12 | 2.88 | 2.35 | ||||
| Depression mean | 1.18 | 1.78 | 1.48 | 1.29 | −0.04 | 0.62 | 1.28 | 4.50 | −0.22 | 0.01** |
| Depression SD | 2.37 | 2.79 | 2.77 | 1.95 | 2.27 | 5.93 | ||||
| Anxiety mean | 2.99 | 1.51 | 2.44 | 2.77 | −0.07 | 0.39 | 2.48 | 1.67 | 0.05 | 0.56 |
| Anxiety SD | 3.37 | 2.32 | 3.12 | 3.30 | 3.17 | 2.42 | ||||
| Euphoria mean | 1.71 | 0.31 | 1.10 | 1.57 | −0.04 | 0.65 | 1.25 | 1.33 | 0.05 | 0.57 |
| Euphoria SD | 2.58 | 1.24 | 2.10 | 2.89 | 2.30 | 3.27 | ||||
| Apathy mean | 6.59 | 2.47 | 5.17 | 5.20 | 0.01 | 0.95 | 4.98 | 7.17 | −0.03 | 0.70 |
| Apathy SD | 3.90 | 3.14 | 4.22 | 4.06 | 4.20 | 3.25 | ||||
| Disinhibition mean | 3.97 | 1.04 | 2.93 | 3.06 | 0.03 | 0.73 | 3.03 | 1.67 | 0.001 | 0.98 |
| Disinhibition SD | 4.11 | 2.15 | 3.89 | 3.75 | 3.90 | 3.20 | ||||
| Irritability mean | 3.04 | 1.02 | 2.30 | 2.60 | −0.05 | 0.55 | 2.25 | 2.33 | −0.10 | 0.27 |
| Irritability SD | 3.60 | 2.24 | 3.42 | 3.26 | 3.34 | 3.67 | ||||
| Motor behavior mean | 4.36 | 0.92 | 3.19 | 3.20 | 0.06 | 0.47 | 3.23 | 2.17 | 0.07 | 0.40 |
| Motor behavior SD | 4.22 | 1.96 | 3.89 | 4.32 | 4.00 | 3.25 |
Genotyping
Cognitive, Behavioral, and Motor Analyses
Statistical Analyses
Imaging
Results
Demographic Characteristics
Cognitive, Behavioral, and Motor Analyses
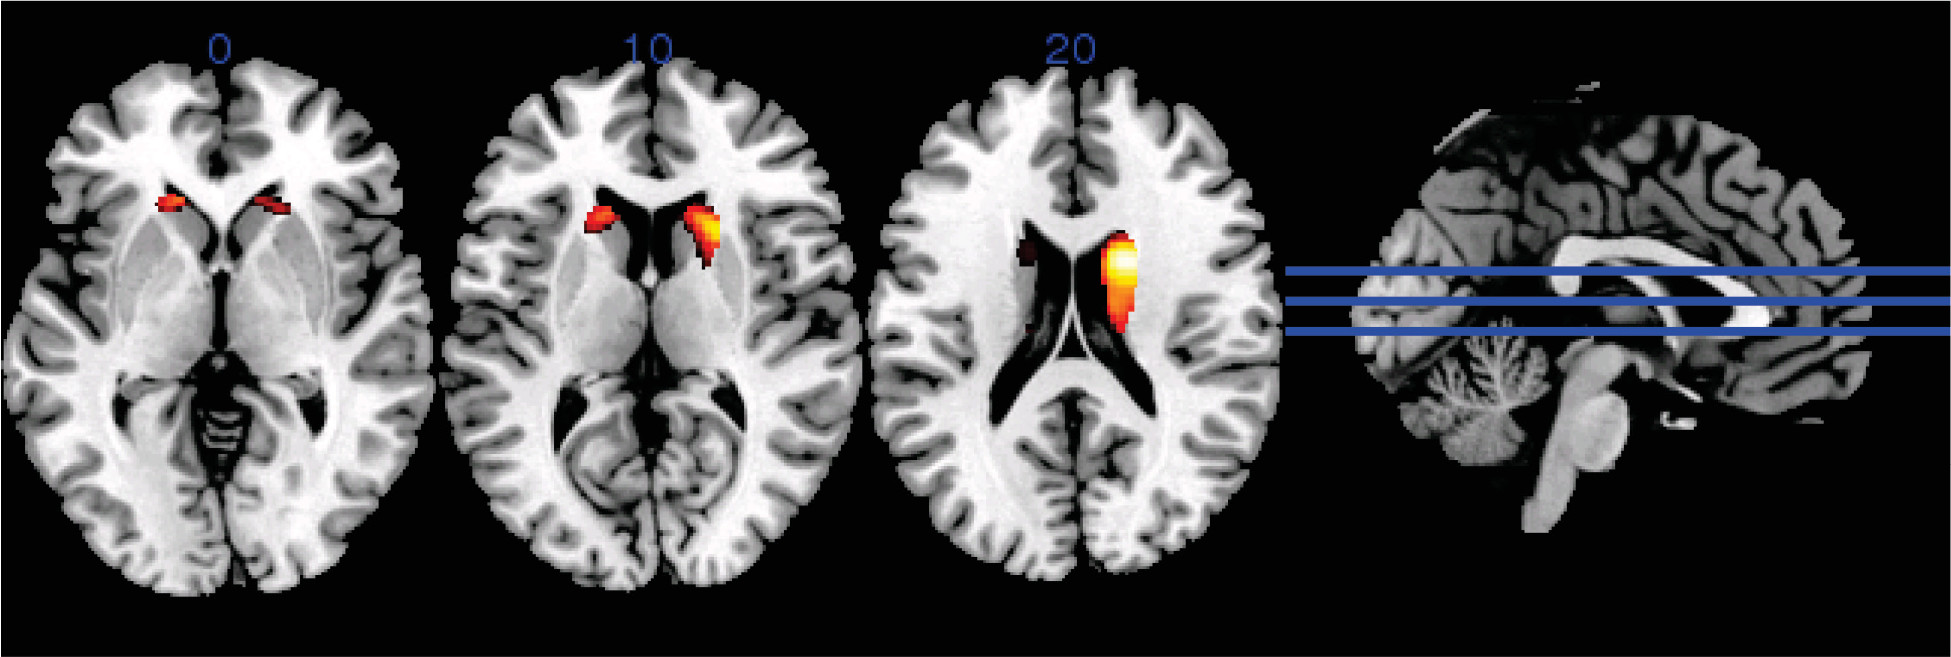
Imaging

| Left correlation | Right correlation | |||
|---|---|---|---|---|
| NPI subscale | r | p | r | p |
| Total | −0.322 | <0.000** | −0.146 | 0.050* |
| Delusions | 0.041 | 0.329 | 0.054 | 0.280 |
| Hallucinations | −0.051 | 0.288 | −0.052 | 0.284 |
| Agitation | −0.178 | 0.025* | −0.136 | 0.069 |
| Depression | 0.146 | 0.054 | 0.019 | 0.417 |
| Anxiety | −0.121 | 0.094 | −0.041 | 0.328 |
| Euphoria | −0.358 | <0.000** | −0.300 | <0.000** |
| Apathy | −0.318 | <0.000** | −0.116 | 0.102 |
| Disinhibition | −0.338 | <0.000** | −0.154 | 0.046* |
| Irritability | −0.147 | 0.054 | −0.083 | 0.183 |
| Motor behavior | −0.326 | <0.000** | −0.063 | 0.246 |
Discussion
Acknowledgments
References
Information & Authors
Information
Published In
History
Keywords
Authors
Funding Information
Metrics & Citations
Metrics
Citations
Export Citations
If you have the appropriate software installed, you can download article citation data to the citation manager of your choice. Simply select your manager software from the list below and click Download.
For more information or tips please see 'Downloading to a citation manager' in the Help menu.
View Options
View options
PDF/EPUB
View PDF/EPUBLogin options
Already a subscriber? Access your subscription through your login credentials or your institution for full access to this article.
Personal login Institutional Login Open Athens loginNot a subscriber?
PsychiatryOnline subscription options offer access to the DSM-5-TR® library, books, journals, CME, and patient resources. This all-in-one virtual library provides psychiatrists and mental health professionals with key resources for diagnosis, treatment, research, and professional development.
Need more help? PsychiatryOnline Customer Service may be reached by emailing [email protected] or by calling 800-368-5777 (in the U.S.) or 703-907-7322 (outside the U.S.).

