Therefore, we sought to examine interactions between NPS as measured by the Neuropsychiatric Inventory Questionnaire (NPI‐Q) and neuroimaging biomarkers, that is, amyloid imaging and FDG‐PET in predicting global and domain‐specific cognitive decline in community‐dwelling older adults. The primary question was if any NPS, as measured by NPI‐Q, interacted with amyloid deposition or glucose hypometabolism in predicting cognitive decline. In addition, we examined specific NPS.
We hypothesized that there would be an interaction between NPS and neuroimaging biomarkers in increasing the rate of cognitive decline in community‐dwelling individuals.
METHODS
Study Design and Sample
We conducted a prospective cohort study in the setting of the population‐based Mayo Clinic Study of Aging (MCSA) in Olmsted County, MN, USA. Details of the study procedures have been reported elsewhere (
18).
We included 1581 CU participants ≥50 years who underwent baseline NPS assessment and amyloid‐PET and FDG‐PET neuroimaging, with the majority having repeated cognitive testing after approximately every 15 months.
Participants were followed forward in time for a median of 6.2 years to examine interactions between baseline NPS and amyloid‐PET as well as FDG‐PET with longitudinal changes in global and domain specific (memory, attention, language, visuospatial) cognitive z‐scores.
The study was approved by the Mayo Clinic and Olmsted Medical Center institutional review boards, and informed consent for participation was obtained from every participant.
Cognitive Evaluation
MCSA participants underwent face‐to‐face evaluations including risk factor ascertainment (including NPI‐Q) and baseline evaluation (including Clinical Dementia Rating Scale) (
19) performed by a nurse or study coordinator; a neurologic evaluation including a neurologic interview, Short Test of Mental Status (
20), and neurologic examination performed by behavioral neurologists; and neuropsychological evaluation of four cognitive domains: memory (delayed recall trials from the Auditory Verbal Learning Test (
21) and the Wechsler Memory Scale–Revised (
22), Logical Memory and Visual Reproduction subtests); language (Boston Naming Test (
23) and category fluency); visuospatial (Wechsler Adult Intelligence Scale–Revised (
23), Picture Completion and Block Design subtests); and executive function (Trail Making Test Part B (
24) and the Wechsler Adult Intelligence Scale–Revised (
25), Digit Symbol subtest). All tests were administered by psychometrists and supervised by neuropsychologists. An expert consensus panel of physicians, neuropsychologists, and nurses or study coordinators reviewed the data and determined if a participant was CU, had MCI (based on the revised Mayo Clinic criteria (
26) or dementia. In this analysis we included only individuals who were CU; participants with MCI or dementia were excluded for the current analysis at baseline. Classification of CU was based on normative data developed in this community (
27,
28,
29,
30).
We further created domain‐specific cognitive z‐scores by z‐scoring the averages of the test‐specific z‐scores, and additionally created a global z‐score by z‐scoring the averages of the domain‐specific z‐scores. The outcome of interest for the linear mixed‐effect model analyses was the longitudinal change in global and domain‐specific (i.e., memory, attention/executive function, language, visuospatial skills) cognitive z‐scores.
Measurement of Neuropsychiatric Symptoms
NPS were measured by using the NPI‐Q (
31) which was administered as a structured interview to an informant, usually the spouse. The NPI‐Q is a shorter version of the Neuropsychiatric Inventory (NPI) and is a clinical instrument that is cross‐validated with the standard NPI (
31). We considered the NPI‐Q an appropriate screening instrument because it assesses a broad variety of neuropsychiatric symptoms and was also selected by the Uniform Data Set Initiative of the National Institute on Aging (
32). The NPI‐Q is designed to obtain information on 12 behaviors (i.e., agitation, delusion, hallucination, depression, anxiety, euphoria, apathy, disinhibition, irritability, aberrant motor behavior, sleep, and eating/appetite). A severity scale has scores ranging from 1 to three points (1 = mild; 2 = moderate; and 3 = severe) and a scale for assessing caregiver distress has scores ranging from 0 to five points (0 = no distress; 1 = minimal distress; 2 = mild distress; 3 = moderate distress; 4 = severe distress; and 5 = extreme distress).
PiB‐PET Acquisition
Amyloid PET imaging was performed using the Pittsburgh Compound B (PiB) tracer. Details on PiB‐PET imaging in the MCSA have been published elsewhere (
33,
34). Briefly, PiB scans, consisting of four 5‐min dynamic frames, were acquired 40–60 min after intravenous injection with 292–728 MBq of 11C‐PiB. We used an in‐house, fully automated image processing pipeline to analyze images. Herein, image voxel values were extracted from automatically labeled regions of interest (ROI) propagated from regions defined on each participant's own magnetic resonance imaging (MRI). The prefrontal, orbitofrontal, parietal, temporal, anterior cingulate, and posterior cingulate/precuneus ROI were normalized to the cerebellar gray matter to form a global amyloid PET standardized uptake value ratio (SUVR). We defined abnormal PiB‐PET retention (PiB‐PET+) by an SUVR ≥1.48, which is the current cut‐off used in the MCSA (
33,
35). We ran the linear‐mixed effects models with continuous, z‐scored PiB‐PET SUVR.
FDG‐PET Acquisition
FDG‐PET imaging which consisted of four 2‐min dynamic frames, was performed 30 min after injecting 366–399 MBq of 18fluorodeoxyglucose intravenously. Images were analyzed using our in‐house fully automated image processing pipeline (
36) in which image voxel values were extracted from automatically labeled cortical ROI (
37) After combining the left and right regions from the Atlas, there were 19 ROI and the meta‐region of interest consisted of bilateral angular gyrus, posterior cingulate/precuneus, and inferior temporal cortical regions from both hemispheres and was identified as AD signature ROI (
38,
39). SUVR was formed by the ratio of this AD signature ROI and two reference regions, namely the pons and the cerebellar vermis which have preserved glucose metabolism in AD (
40). Participants were classified as having glucose hypometabolism, which is a measure of neurodegeneration as defined by NIA‐AA criteria (N+) (
14) based on SUVR of ≤1.47 (
33). We ran the linear‐mixed effects models with continuous, z‐scored FDG‐PET SUVR. We additionally flipped the sign of the z‐score so that higher values would correspond with a worsening of the biomarker, thereby allowing for a similar interpretation as for the PiB‐PET analysis.
Statistical Analysis
We conducted linear mixed‐effect models with random participant‐specific intercepts and slopes over time to examine the associations and interactions between baseline NPS with brain amyloid deposition (as measured by PiB‐PET) or glucose hypometabolism (as measured by FDG‐PET) in predicting longitudinal change in global and domain‐specific (i.e. attention/executive function, memory, visuospatial, language) cognitive z‐scores over time. We ran the models with continuous, z‐scored PiB‐PET as well as FDG‐PET SUVR (with sign reversed for interpretation purposes for the FDG‐PET SUVR). All models included NPS at baseline, PET imaging at baseline, time in years from baseline and their interactions. All models were adjusted for age at baseline, sex, education, and previous cognitive testing experience (Yes/No). We conducted this analysis separately for the 12 NPS as assessed by the NPI‐Q, and for presence of any NPS as well as NPS severity. For each model, we computed beta coefficients, 95% confidence intervals (CIs), and p‐values.
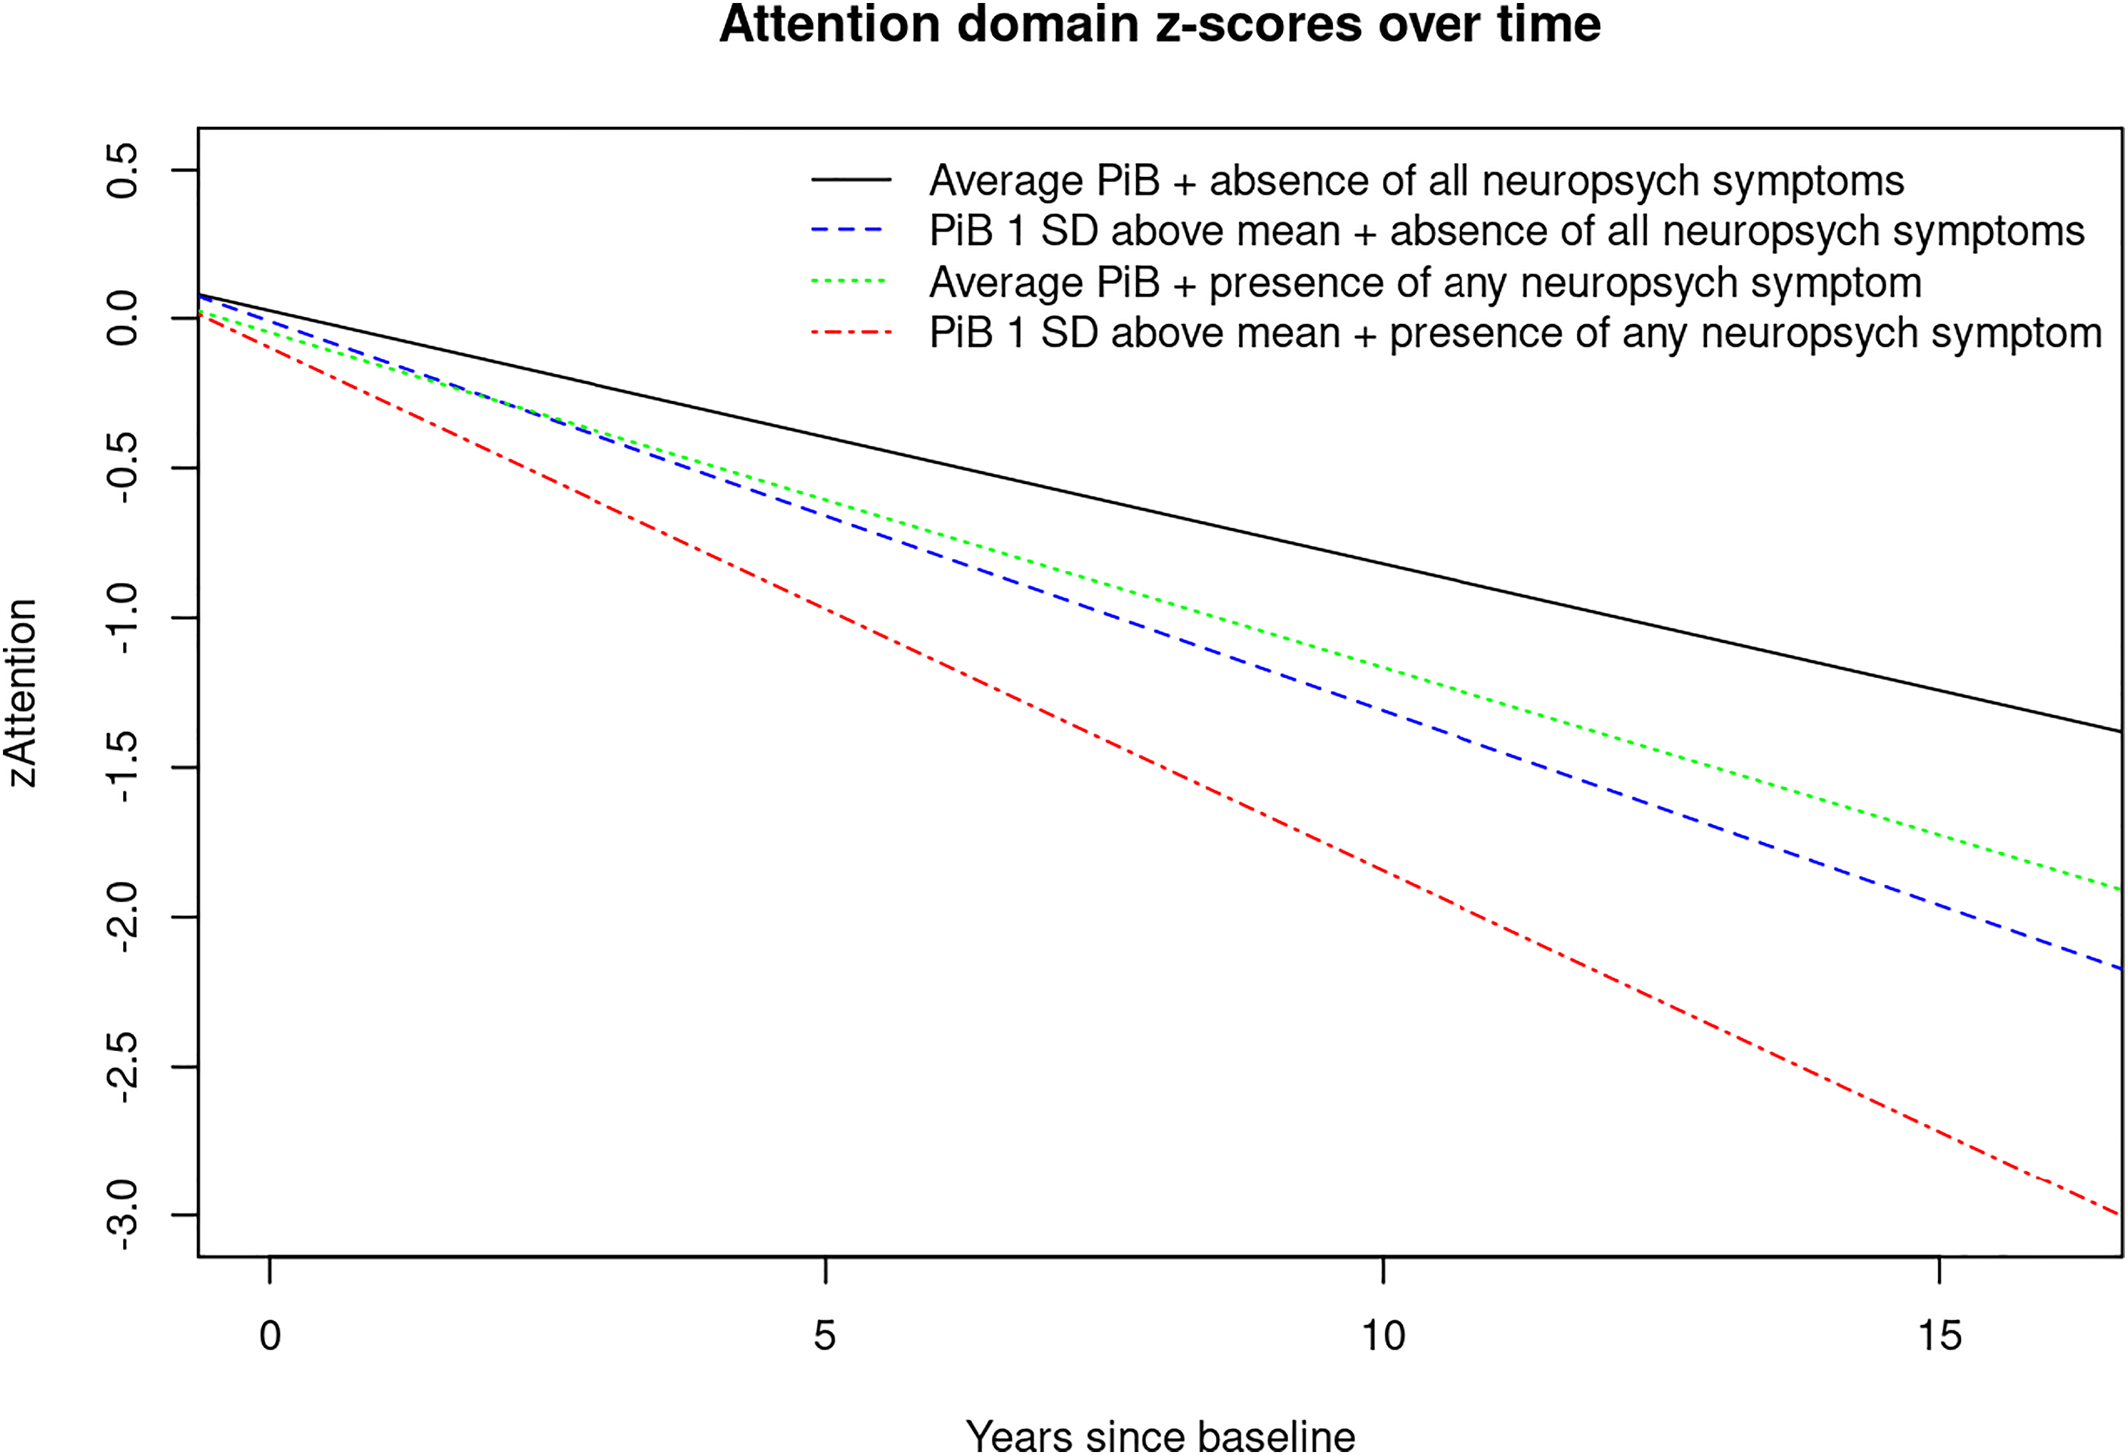
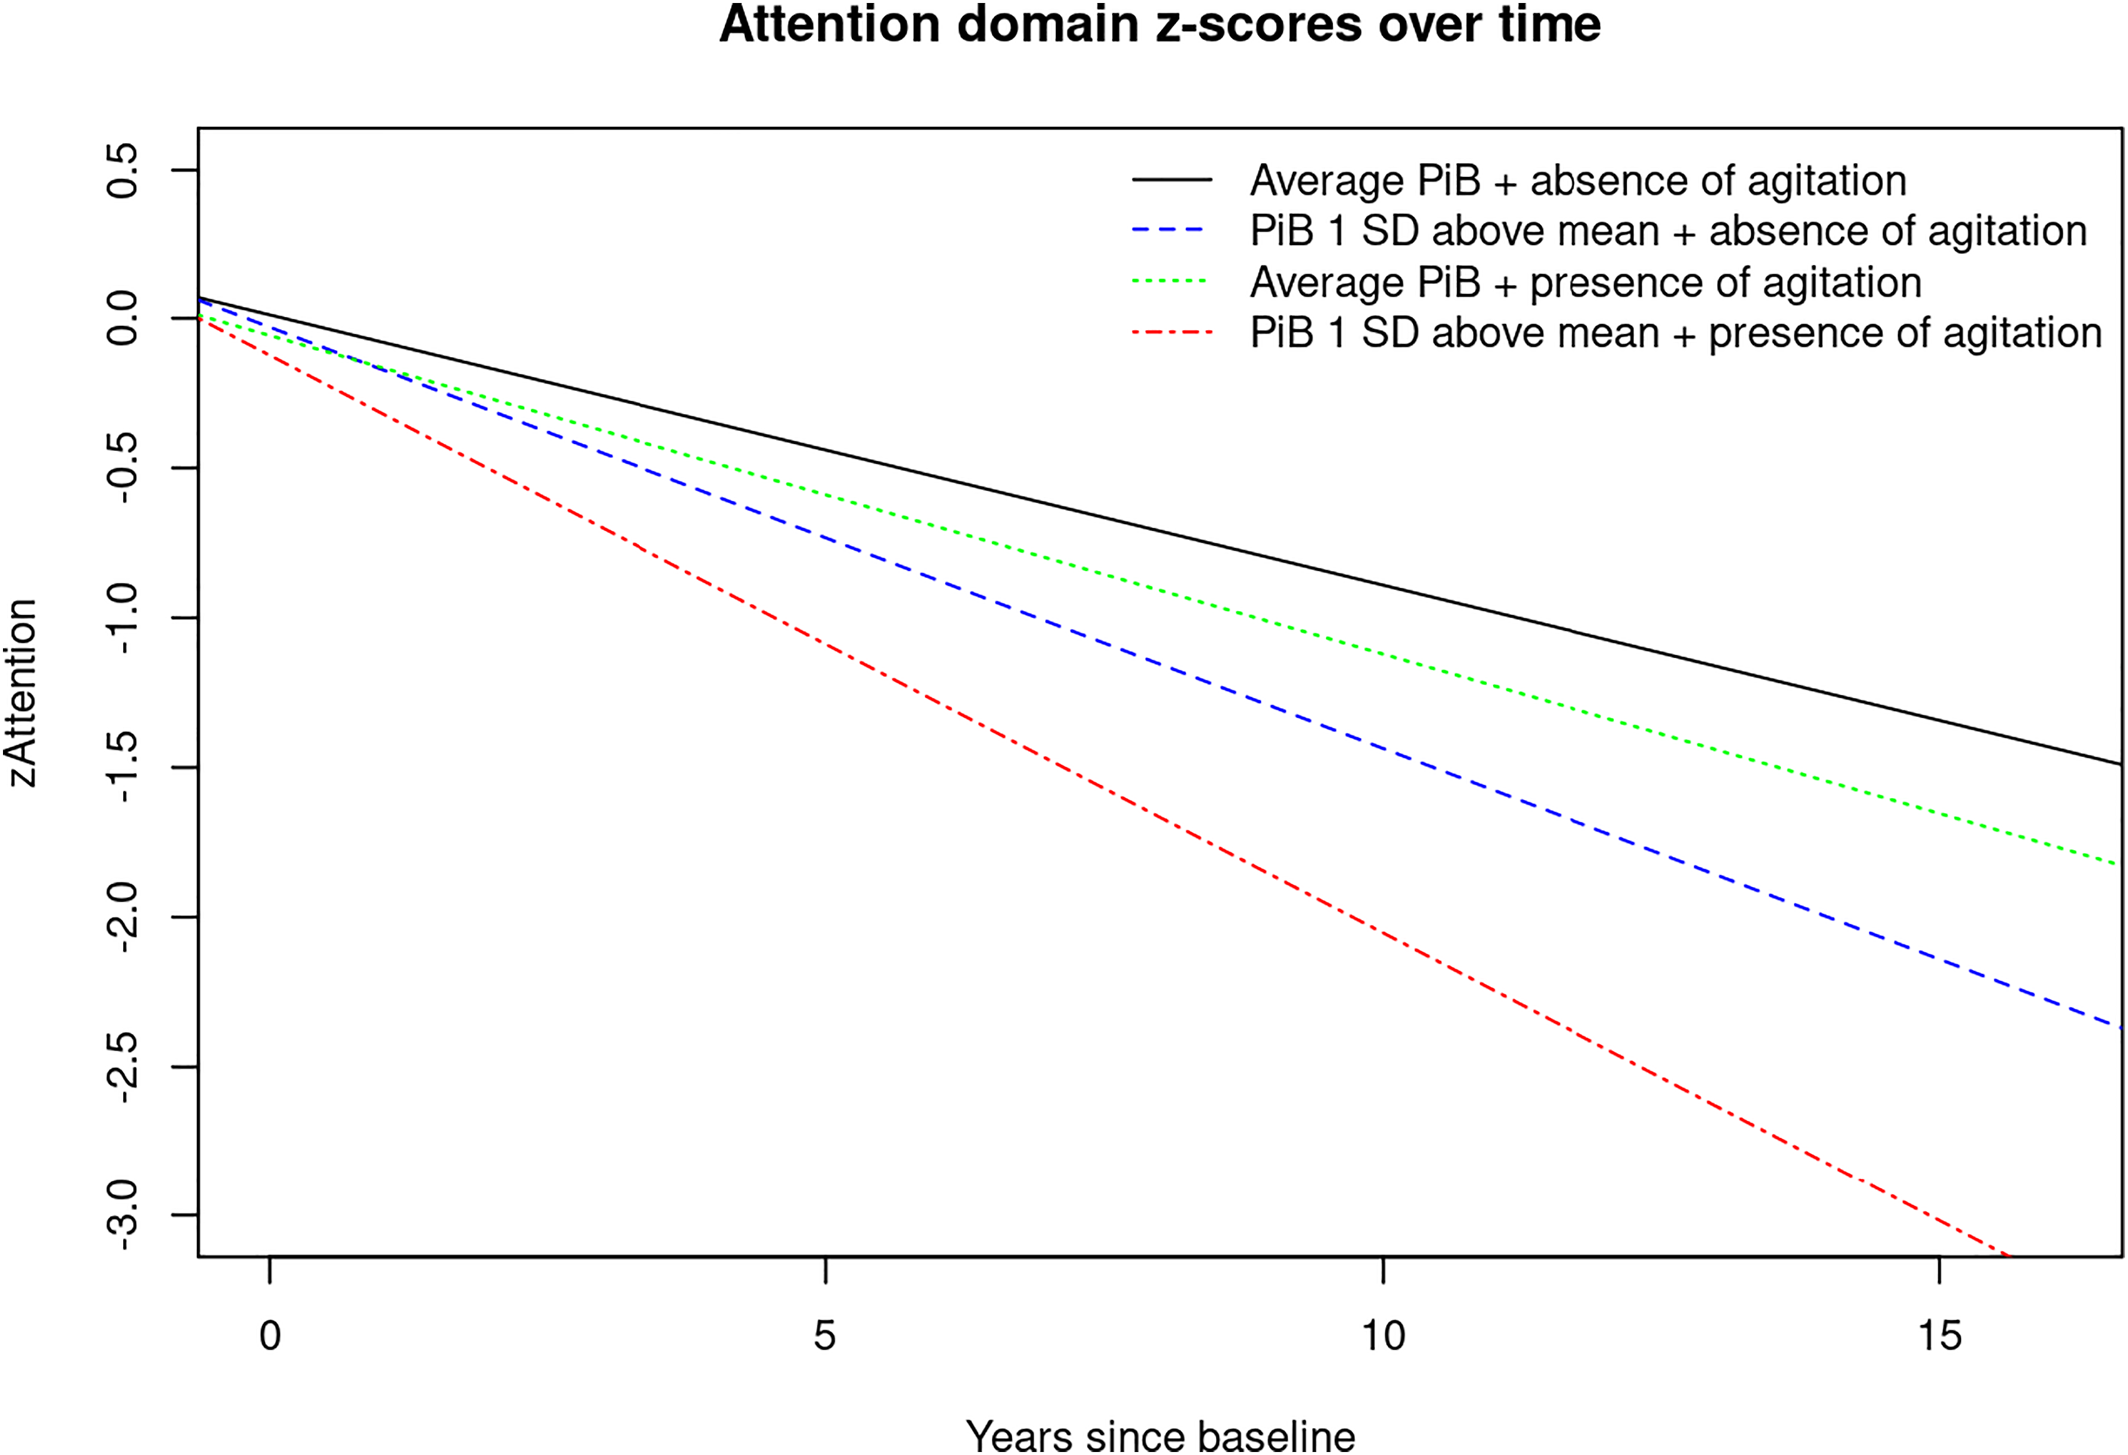
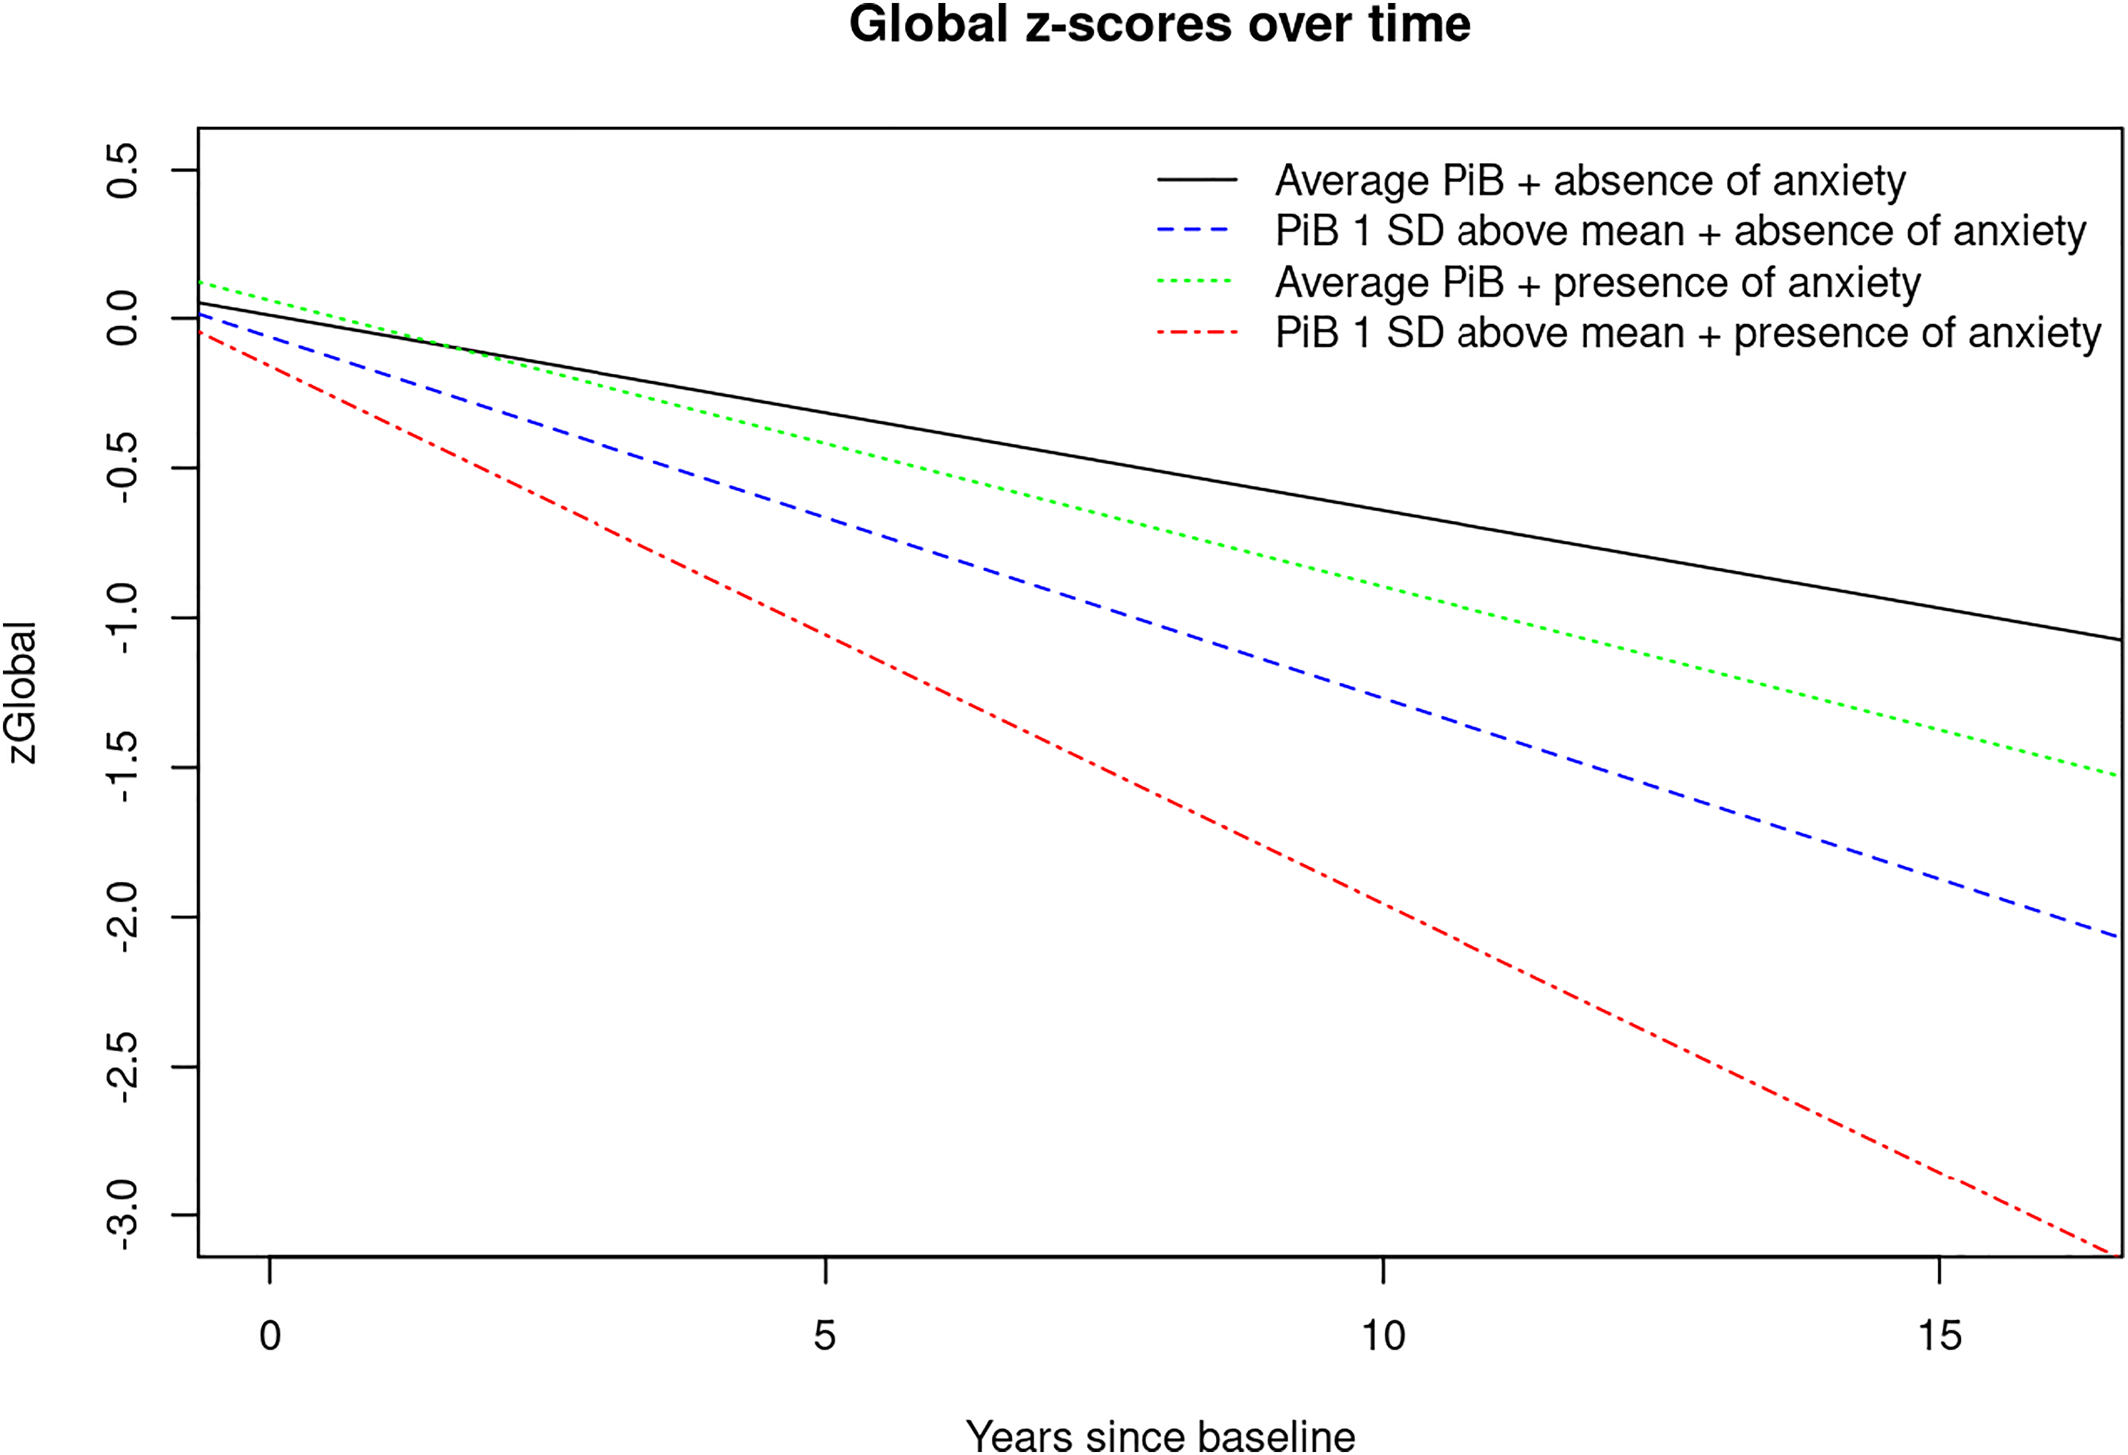
For visual display of data, we plotted the linear mixed effects model for PiB‐PET SUVR (average vs. 1 standard deviation (SD) above the mean) and presence of any NPS (Yes/No) predicting the attention z‐score, as well as presence of anxiety predicting the global cognition z‐score to show the trajectories over time for individuals in these groups (
Figures 1,
2,
3). Statistical testing was performed at the conventional two‐tailed alpha level of 0.05. All analyses were performed using SAS System, version 9.4 software (SAS Institute, Cary, NC) and R, version 4.1.2 (R Foundation for Statistical Computing, Vienna, Austria).
DISCUSSION
Here we report interactions (two‐way and three‐way) between NPS, PiB and time since baseline with accelerated cognitive decline. Most novel to the present study are the three‐way interactions we observed showing that having NPS and elevated brain amyloid deposition are associated with even further accelerated global and domain‐specific cognitive decline, especially in the attention/executive function domain. For example, there were interactions between time since baseline, PiB, and agitation, appetite change, euphoria, irritability, any NPI‐Q assessed NPS and NPS‐severity indicating faster decline on attention z‐scores. We also observed interactions between time since baseline, PiB, and anxiety, depression and aberrant motor behavior with accelerated decline on memory z‐scores and a few three‐way interactions that reveal accelerated decline on visuospatial and language z‐scores.
While NPS and neuroimaging biomarkers have been shown to be independent predictors of cognitive decline, little is known about the underlying etiologic mechanisms. Our team has previously proposed four possible theoretical explanations for the link between NPS and cogitive decline (
41). For example, the etiologic pathway, meaning that NPS may have a direct deleterious effect on the brain leading to cognitive decline. Further theoretical constructs are the shared risk factor or confounding pathway, reverse causality and synergistic interaction. In the current study, we examined the theory of synergistic interaction. Thus, we examined the possibility of NPS interacting with AD pathology, as measured by PiB‐PET, in accelerating cognitive decline.
While several studies have reported associations between NPS and brain amyloid deposition (
42,
43,
44,
45) as well as glucose hypometabolism (
46,
47), few have examined associations between multi‐modal amyloid and synaptic imaging with cognitive outcomes. For example, we and others have observed that clinically relevant anxiety interacts with amyloid pathology in predicting cognitive decline (
16,
17). In the current study we observed interactions between PiB and NPI‐Q assessed anxiety symptoms in accelerating cognitive decline on global cognition and in the memory domain.
When it comes to depression, previous studies have observed longitudinal associations between amyloid imaging and depression (
45,
48). Investigators from the Harvard Aging Brain Study have also examined cognitive outcomes and reported a significant interaction between baseline amyloid deposition with higher depressive symptoms on cognitive decline (
49). While we previously found that CU persons with both depression (as measured by BDI‐II) and PiB+ were at increased risk of developing MCI, we did not observe significant interactions between these risk factors in predicting MCI (
16). In the current study, we observed interactions between NPI‐Q‐assessed depressive symptoms and amyloid deposition in predicting faster cognitive decline in terms of memory.
While findings on depression and anxiety seem to be inconsistent in the previous literature, in the current study, we observed significant interactions between elevated PiB and anxiety with accelerated decline on global cognition and the memory domain; PiB and depression interacted to accelerate decline in the memory domain. However, one should keep in mind the differences in methodology across various studies. For example, it should be noted that in this study we examined CU individuals; participants with cognitive impairment at baseline, (i.e., MCI or dementia) were excluded. Furthermore, the outcome of interest for our analyses was cognitive z‐scores and not clinical syndromes like MCI or dementia. In addition, current research suggests that NPS can fluctuate and unlike cognition do not necessarily proceed in a straight line in a single direction.
To our knowledge, studies investigating interactions between amyloid deposition and a broad spectrum of NPS in accelerating cognitive decline in community‐dwelling individuals are lacking.
While in the current study we found three‐way interactions between PiB‐PET, NPS, and time since baseline in predicting cognitive z‐scores, we did not observe significant three‐way interactions between FDG‐PET, NPS, and time since baseline in predicting the same outcomes. However, it should be noted that while PiB‐PET can identify individuals on the AD‐spectrum even before cognitive decline occurs, FDG‐PET reflects neurodegeneration which is not necessarily specific for AD (
14). In this analysis we included only CU at baseline. When we conducted the same analysis in a sample that also included cognitively impaired individuals (i.e. MCI and dementia), we found significant three‐way interactions between neurodegeneration, that is, lower FDG‐PET, various NPS, and time since baseline indicating faster decline on attention z‐scores (data not shown). In addition, our team previously observed that the combined presence of FDG‐PET and NPS increased the risk of incident MCI (
50). However, as mentioned above, the differences in study methodology should be noted.
The strengths of our study include the large population‐based sample of CU older adults, and a relatively long follow‐up time of 6.2 years. Furthermore, we examined a broad spectrum of NPS.
Our study also has limitations. Some of the NPI‐Q assessed NPS were rare, thus potentially limiting statistical power (e.g., only one participant had delusions, seven had euphoria, and one had hallucinations). However, considering that our study sample consisted of community‐dwelling persons, low numbers in some strata are expected. Furthermore, data on nighttime behavior was missing for 164 participants. In addition, we did not adjust for multiplicity of testing which could be interpreted as a limitation by some. However, it is also important to note that some investigators do not recommend Bonferroni correction to avoid type 2 error. Also, in light of the previous literature, the results seem plausible and build a foundation to understanding and examining potential mechanisms that may underly the association between NPS and AD. Furthermore, our sample is relatively highly educated and 98% of study participants are of Caucasian decent. However, it has been shown that data from Olmsted County are generalizable to the U.S. population of Minnesota and the Upper Midwest (
51), even though, generalization to ethnic minorities is still limited.
In summary, our study shows that NPS can give us extra information beyond PiB‐PET for predicting faster global and domain‐specific cognitive decline, especially in the attention domain. Based on our findings, it is possible that NPS interact with AD pathology, as measured by PiB‐PET, in accelerating global and domain specific cognitive decline in CU community‐dwelling older adults.
Furthermore, this study emphasizes the importance of NPS in AD‐research, and underlines the clinical importance of NPS in the early stages of AD, that is, individuals on the AD spectrum without cognitive impairment. More studies are needed to confirm our findings.


