Factors Affecting Antidepressant Response Trajectories: A Veterans Affairs Augmentation and Switching Treatments for Improving Depression Outcomes Trial Report
Abstract
Background
Methods
Results
Conclusion
Highlights
METHODS
Compliance
Study Design
Participants
Interventions
Assessments
Baseline Measures
Outcome Measures
Statistical analysis
Trajectory Analysis
Weighted Multinomial Logistic Regression and Exploratory Analyses
RESULTS
Trajectory Analysis
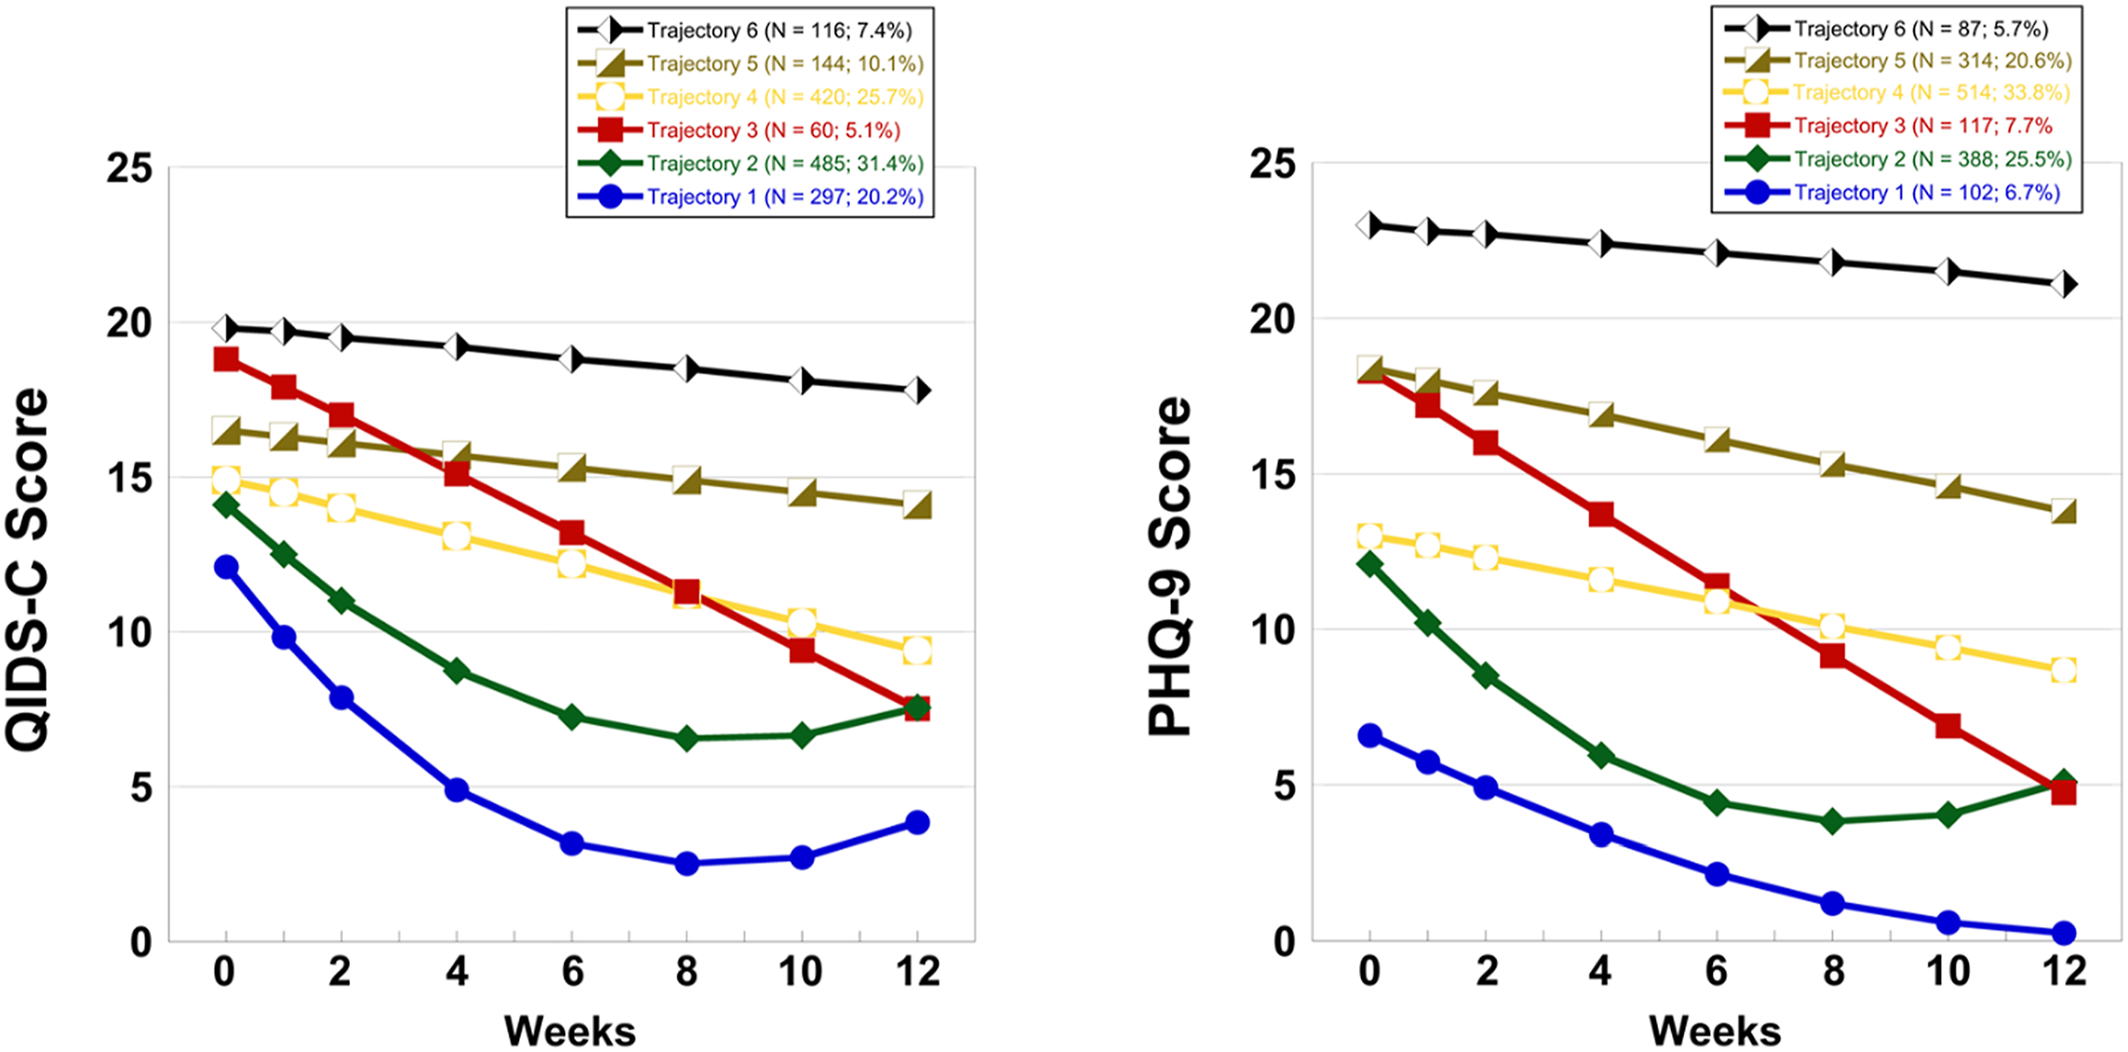
| Trajectory | Mean baseline QIDS‐C ± SDb | Remission | Non‐remission/response | Non‐response | ||||
|---|---|---|---|---|---|---|---|---|
| No. | N | N | % | N | % | N | % | |
| 1 | 297 | 14.6 ± 2.8 | 256 | 16.8 | 25 | 1.6 | 16 | 1.1 |
| 2 | 485 | 15.9 ± 2.9 | 133 | 8.7 | 310 | 20.4 | 42 | 2.8 |
| 3 | 60 | 20.9 ± 2.1 | 3 | 0.2 | 56 | 3.7 | 1 | 0.1 |
| 4 | 420 | 16.9 ± 2.7 | 4 | 0.3 | 194 | 12.7 | 222 | 14.6 |
| 5 | 144 | 18.2 ± 2.5 | 0 | 0.0 | 43 | 2.8 | 101 | 6.6 |
| 6 | 116 | 20.7 ± 2.0 | 0 | 0.0 | 2 | 0.1 | 114 | 7.5 |
| Totals | 396 | 26.0 | 630 | 41.4 | 496 | 32.6 | ||
| Trajectory | Mean baseline PHQ‐9 ± SDb | Remission | Non‐remission/response | Non‐response | ||||
|---|---|---|---|---|---|---|---|---|
| No. | N | N | % | N | % | N | % | |
| 1 | 102 | 9.58 ± 4.9 | 87 | 5.7 | 12 | 0.8 | 3 | 0.2 |
| 2 | 514 | 13.9 ± 4.3 | 243 | 16.0 | 193 | 12.7 | 78 | 5.1 |
| 3 | 117 | 20.9 ± 2.9 | 23 | 1.5 | 78 | 5.1 | 16 | 1.1 |
| 4 | 388 | 15.3 ± 3.5 | 34 | 2.2 | 231 | 15.2 | 123 | 8.1 |
| 5 | 314 | 19.5 ± 3.4 | 9 | 0.6 | 105 | 6.9 | 200 | 13.1 |
| 6 | 87 | 23.2 ± 2.3 | 0 | 0.0 | 11 | 0.7 | 76 | 5.0 |
| Totals | 396 | 26.0 | 630 | 41.4 | 496 | 32.6 | ||
Weighted Multinomial Logistic Regression Analysis
| Variable | Trajectory | QIDS‐C | PHQ‐9 | ||||
|---|---|---|---|---|---|---|---|
| ORc | 95% CI | p value | OR | 95% CI | p value | ||
| Early improvementd | 1 | 4.80 | (4.04–5.71) | <0.001 | 6.20 | (5.10–7.55) | <0.001 |
| 2 | 3.16 | (2.69–3.70) | <0.001 | 2.48 | (2.15–2.86) | <0.001 | |
| 3 | 1.30 | (1.14–1.49) | <0.001 | 1.78 | (1.56–2.03) | <0.001 | |
| 4 | 2.36 | (2.02–2.74) | <0.001 | 3.55 | (3.05–4.12) | <0.001 | |
| 5 | 1.89 | (1.63–2.19) | <0.001 | 1.57 | (1.39–1.78) | <0.001 | |
| QIDS‐C/PHQ‐9e | 1 | 0.10 | (0.08–0.13) | <0.001 | 0.07 | (0.06–0.10) | <0.001 |
| 2 | 0.17 | (0.14–0.21) | <0.001 | 0.23 | (0.19–0.28) | <0.001 | |
| 3 | 0.80 | (0.65–0.98) | 0.03 | 0.51 | (0.43–0.61) | <0.001 | |
| 4 | 0.24 | (0.19–0.31) | <0.001 | 0.16 | (0.13–0.19) | <0.001 | |
| 5 | 0.35 | (0.28–0.45) | <0.001 | 0.50 | (0.43–0.59) | <0.001 | |
| Q‐LES‐Q‐SFf | 1 | 1.06 | (1.03–1.10) | <0.001 | 1.07 | (1.03–1.11) | 0.001 |
| 2 | 1.05 | (1.02–1.07) | <0.001 | 1.03 | (1.00–1.07 | 0.049 | |
| 3 | 1.01 | (0.98–1.03) | 0.60 | 1.03 | (1.00–1.06) | 0.06 | |
| 4 | 1.02 | (1.00–1.05) | <0.001 | 1.05 | (1.02–1.09) | 0.002 | |
| 5 | 1.01 | (0.99–1.04) | 0.22 | 1.02 | (0.99–1.05) | 0.16 | |
| Treatment allocation: Aug‐ARIg versus Switch‐BUPh | 1 | 1.86 | (0.74–4.68) | 0.17 | 0.96 | (0.29–3.20) | 0.95 |
| 2 | 1.55 | (0.67–3.60) | 0.30 | 1.17 | (0.45–3.04) | 0.74 | |
| 3 | 1.85 | (0.85–4.09) | 0.13 | 1.67 | (0.67–4.18) | 0.27 | |
| 4 | 0.76 | (0.34–1.70) | 0.51 | 1.45 | (0.53–3.94) | 0.46 | |
| 5 | 1.45 | (0.66–3.20) | 0.34 | 1.32 | (0.58–3.03) | 0.50 | |
| Treatment allocation: Aug‐BUPi versus Switch‐BUP | 1 | 1.11 | (0.46–2.71) | 0.81 | 0.82 | (0.26–2.61) | 0.73 |
| 2 | 0.96 | (0.43–2.13) | 0.91 | 0.60 | (0.24–1.51) | 0.27 | |
| 3 | 0.59 | (0.24–1.43) | 0.23 | 0.66 | (0.27–1.63) | 0.36 | |
| 4 | 0.77 | (0.36–1.63) | 0.49 | 0.66 | (0.25–1.74) | 0.40 | |
| 5 | 0.78 | (0.36–1.69) | 0.52 | 0.84 | (0.38–1.87) | 0.67 | |
| Factor | Trajectory group | ORb | 95% confidence limits | p value |
|---|---|---|---|---|
| BAIc | 0.03 | |||
| 1 | 0.23 | 0.14–0.40 | ||
| 2 | 0.36 | 0.23–0.57 | ||
| 3 | 0.66 | 0.42–1.06 | ||
| Early improvementd | <0.001 | |||
| 1 | 3.38 | 2.95–3.87 | ||
| 2 | 2.13 | 1.90–2.39 | ||
| 3 | 1.61 | 1.45–1.78 | ||
| QIDS‐Ce | <0.001 | |||
| 1 | 0.34 | 0.30–0.39 | ||
| 2 | 0.49 | 0.43–0.54 | ||
| 3 | 0.69 | 0.63–0.76 | ||
| Treatment allocation | 0.21 | |||
| Aug‐ARIf versus Switch‐BUPg | 1 | 1.98 | 0.99–3.99 | |
| 2 | 1.24 | 0.68–2.25 | ||
| 3 | 0.91 | 0.54–1.55 | ||
| Aug‐BUPh versus Switch‐BUP | 1 | 1.18 | 0.59–2.36 | |
| 2 | 0.96 | 0.54–1.71 | ||
| 3 | 0.88 | 0.53–1.47 |
| Factor | Trajectory group | ORb | 95% confidence limits | p value |
|---|---|---|---|---|
| Agec | 0.035 | |||
| 1 | 1.03 | 1.00–1.05 | ||
| 2 | 1.02 | 1.00–1.04 | ||
| 3 | 1.00 | 0.98–1.03 | ||
| 4 | 1.03 | 1.01–1.05 | ||
| 5 | 1.01 | 0.99–1.02 | ||
| BAId | <0.001 | |||
| 1 | 0.23 | 0.14–0.40 | ||
| 2 | 0.36 | 0.23–0.57 | ||
| 3 | 0.66 | 0.42–1.06 | ||
| 4 | 0.30 | 0.19–0.48 | ||
| 5 | 0.53 | 0.38–0.72 | ||
| Duration of index episodee | 0.031 | |||
| 1 | 1.00 | 1.00–1.00 | ||
| 2 | 1.00 | 0.97–1.00 | ||
| 3 | 1.00 | 1.00–1.00 | ||
| 4 | 1.00 | 1.00–1.00 | ||
| 5 | 1.00 | 1.00–1.00 | ||
| Early improvementf | <0.001 | |||
| 1 | 1.39 | 1.26–1.54 | ||
| 2 | 1.38 | 1.26–1.52 | ||
| 3 | 1.14 | 1.03–1.27 | ||
| 4 | 1.01 | 0.92–1.12 | ||
| 5 | 1.17 | 1.08–1.25 | ||
| Employment status | 0.005 | |||
| Retired versus employedg | 1 | 0.28 | 0.14–0.58 | |
| 2 | 0.49 | 0.25–0.97 | ||
| 3 | 1.00 | 0.45–2.19 | ||
| 4 | 0.31 | 0.16–0.60 | ||
| 5 | 0.61 | 0.36–1.03 | ||
| Unemployed versus employed | 1 | 0.37 | 0.20–0.67 | |
| 2 | 0.51 | 0.29–0.91 | ||
| 3 | 0.92 | 0.47–1.81 | ||
| 4 | 0.36 | 0.20–0.64 | ||
| 5 | 0.60 | 0.38–0.94 | ||
| QIDS‐Ch | <0.001 | |||
| 1 | 0.77 | 0.71–0.84 | ||
| 2 | 0.88 | 0.82–0.95 | ||
| 3 | 0.94 | 0.86–1.02 | ||
| 4 | 0.77 | 0.72–0.84 | ||
| 5 | 0.86 | 0.81–0.91 | ||
| Treatment allocation | 0.85 | |||
| Aug‐ARIi versus Switch‐BUPj | 1 | 1.44 | 0.80–2.61 | |
| 2 | 1.47 | 0.84–2.55 | ||
| 3 | 1.09 | 0.72–1.64 | ||
| 4 | 1.49 | 0.86–2.58 | ||
| 5 | 1.47 | 0.81–2.65 | ||
| Aug‐BUPk versus Switch‐BUP | 1 | 1.14 | 0.62–2.08 | |
| 2 | 1.32 | 0.76–2.30 | ||
| 3 | 1.11 | 0.74–1.66 | ||
| 4 | 1.19 | 0.68–2.07 | ||
| 5 | 1.10 | 0.59–2.05 |
| Factor | Trajectory group | ORb | 95% confidence limits | p value |
|---|---|---|---|---|
| Agec | 0.002 | |||
| 1 | 0.93 | 0.90–0.97 | ||
| 2 | 0.97 | 0.94–1.00 | ||
| 3 | 0.97 | 0.94–1.00 | ||
| BAId | <0.001 | |||
| 1 | 0.31 | 0.14–0.67 | ||
| 2 | 0.73 | 0.40–1.34 | ||
| 3 | 1.07 | 0.62–1.84 | ||
| CIRS severity indexe | 0.04 | |||
| 1 | 1.12 | 1.03–1.21 | ||
| 2 | 1.03 | 0.97–1.11 | ||
| 3 | 1.03 | 0.97–1.10 | ||
| Early improvementf | <0.001 | |||
| 1 | 0.77 | 0.59–0.99 | ||
| 2 | 1.38 | 1.12–1.69 | ||
| 3 | 1.01 | 0.84–1.21 | ||
| Lifetime suicidal ideationg | 0.03 | |||
| 1 | 0.83 | 0.68–1.00 | ||
| 2 | 0.79 | 0.67–0.93 | ||
| 3 | 0.88 | 0.76–1.02 | ||
| Marital statush | 0.01 | |||
| Single versus married/cohabitating | 1 | 0.43 | 0.18–0.99 | |
| 2 | 0.33 | 0.16–0.67 | ||
| 3 | 0.59 | 0.31–1.11 | ||
| QIDS‐Ci | <0.001 | |||
| 1 | 0.56 | 0.49–0.65 | ||
| 2 | 0.64 | 0.56–0.72 | ||
| 3 | 0.74 | 0.66–0.83 | ||
| Treatment allocation | 0.56 | |||
| Aug‐ARIj versus Switch‐BUPk | 1 | 1.62 | 0.64–4.12 | |
| 2 | 1.18 | 0.54–2.58 | ||
| 3 | 0.98 | 0.48–1.99 | ||
| Aug‐BUPl versus Switch‐BUP | 1 | 0.93 | 0.38–2.30 | |
| 2 | 0.69 | 0.32–1.46 | ||
| 3 | 0.63 | 0.32–1.26 |
Exploratory Analysis of Clinical and Demographic Factors
| Categorical factors | QIDS‐C total (F5,999) | QIDS‐corec emotional cluster (F3,999) | QIDS‐sleepd cluster (F3,999) | QIDS‐atypicale cluster (F3,999) | PHQ‐9 (F5,999) | |||||
|---|---|---|---|---|---|---|---|---|---|---|
| Chi‐square | p value | Chi‐square | p value | Chi‐square | p value | Chi‐square | p value | Chi‐square | p value | |
| Educationf | 14.8 | 0.46 | 7.72 | 0.56 | 22.8 | 0.09 | 9.87 | 0.36 | 13.1 | 0.59 |
| Employment statusg | 36.5 | <0.001 | 30.5 | <0.001 | 31.2 | <0.001 | 18.5 | 0.01 | 23.9 | 0.01 |
| Genderh | 10.9 | 0.05 | 4.77 | 0.19 | 12.6 | 0.03 | 21.1 | <0.001 | 24.0 | <0.001 |
| Grief endorsementi | 18.6 | <0.001 | 22.8 | <0.001 | 27.3 | <0.001 | 1.44 | 0.70 | 26.9 | <0.001 |
| Marital statusj | 1.78 | 0.87 | 1.5 | 0.59 | 11.4 | 0.04 | 7.8 | 0.05 | 6.7 | 0.24 |
| Racek | 23.6 | 0.01 | 8.67 | 0.19 | 49.3 | <0.001 | 9.46 | 0.15 | 14.8 | 0.14 |
| Substance or alcohol abusel | 4.7 | 0.45 | 0.67 | 0.88 | 2.1 | 0.84 | 6.44 | 0.09 | 4.52 | 0.48 |
| Treatment allocationm | 32.5 | <0.001 | 16.4 | 0.01 | 8.3 | 0.60 | 9.31 | 0.16 | 8.97 | 0.54 |
| Continuous factors | F statistic (F5,999) | p value | F statistic (F3,999) | p value | F statistic (F3,999) | p value | F statistic (F3,999) | p value | F statistic (F5,999) | p value |
|---|---|---|---|---|---|---|---|---|---|---|
| ACESn | 1.61 | 0.15 | 1.20 | 0.31 | 2.0 | 0.08 | 0.98 | 0.40 | 1.03 | 0.40 |
| Ageo | 1.18 | 0.32 | 1.64 | 0.18 | 2.4 | 0.04 | 2.03 | 0.11 | 1.23 | 0.29 |
| BAIp | 33.5 | <0.001 | 40.3 | <0.001 | 26.0 | <0.001 | 28.5 | <0.001 | 60.8 | <0.001 |
| CIRS severity indexq | 0.18 | 0.97 | 1.09 | 0.35 | 0.8 | 0.56 | 0.99 | 0.40 | 1.12 | 0.35 |
| DSM‐5 mixed featuresr | 2.13 | 0.06 | 0.36 | 0.79 | 4.2 | <0.001 | 4.08 | 0.01 | 3.15 | 0.01 |
| Duration of index episodes | 5.66 | <0.001 | 5.35 | <0.01 | 3.7 | <0.001 | 4.20 | 0.01 | 5.61 | <0.001 |
| Lifetime suicidal ideationt | 2.94 | 0.012 | 1.14 | 0.33 | 0.7 | 0.59 | 8.64 | <0.001 | 1.25 | 0.28 |
| QIDS‐Cu | 130 | <0.001 | 141 | <0.001 | 33.0 | <0.001 | 70.9 | <0.001 | 235 | <0.001 |
| Q‐LES‐Q‐SFv | 57.7 | <0.001 | 89.5 | <0.001 | 23.3 | <0.001 | 20.4 | <0.001 | 99.0 | <0.001 |
DISCUSSION
Strengths and Limitations
Importance of Findings
Footnotes
Supplementary Material
- View/Download
- 781.25 KB
REFERENCES
Information & Authors
Information
Published In

History
Authors
Funding Information
Metrics & Citations
Metrics
Citations
Export Citations
If you have the appropriate software installed, you can download article citation data to the citation manager of your choice. Simply select your manager software from the list below and click Download.
For more information or tips please see 'Downloading to a citation manager' in the Help menu.
View Options
View options
PDF/EPUB
View PDF/EPUBLogin options
Already a subscriber? Access your subscription through your login credentials or your institution for full access to this article.
Personal login Institutional Login Open Athens loginNot a subscriber?
PsychiatryOnline subscription options offer access to the DSM-5-TR® library, books, journals, CME, and patient resources. This all-in-one virtual library provides psychiatrists and mental health professionals with key resources for diagnosis, treatment, research, and professional development.
Need more help? PsychiatryOnline Customer Service may be reached by emailing [email protected] or by calling 800-368-5777 (in the U.S.) or 703-907-7322 (outside the U.S.).