Full access
Articles
Published Online: 20 October 2020

Spending on Young Children With Autism Spectrum Disorder in Employer-Sponsored Plans, 2011–2017

This article has been corrected.
VIEW CORRECTION

Abstract

Objective:

Rapid increases in the prevalence of autism spectrum disorder (ASD) and increased access to intensive behavioral interventions have likely increased health care spending. This study estimated recent changes in spending among privately insured children with and without current ASD.

Methods:

A repeated cross-sections analysis of 2011–2017 claims data from large-employer–sponsored health plans assessed changes in annual expenditures by service type for children ages 3–7 enrolled for ≥1 year and with two or more claims with ASD billing codes within a calendar year and for all other children.

Results:

Mean spending per child with a current-year ASD diagnosis increased by 51% in 2017 U.S. dollars, from roughly $13,000 in 2011 to $20,000 in 2017. Among children who did not meet the current-year ASD case definition, per-child spending increased by 8%. Spending on children with ASD accounted for 41% of spending growth for children ages 3–7 during 2011–2017. Outpatient behavioral intervention–related spending per child with ASD increased by 376%, from $1,746 in 2011 to $8,317 in 2017; spending on all other services increased by 2%. Their share of behavioral intervention–related spending increased from 13.2% in 2011 to 41.7% in 2017. In 2011, 2.5% of children with current-year ASD diagnoses incurred ≥$20,000 in outpatient behavioral intervention–related spending, which increased to 14.4% in 2017.

Conclusions:

During 2011–2017, spending increased six times as much for privately insured children ages 3–7 with current-year ASD as for children without ASD, largely from increased behavioral intervention–related spending. One in seven children received at least $20,000 in services in 2017.

HIGHLIGHTS

During 2011–2017, mean inflation-adjusted spending per child ages 3–7 with current-year ASD enrolled in large-employer–sponsored plans increased by 51%, from roughly $13,000 to $20,000, while per-child spending for other children increased by 8%.
More than 40% of all increased spending for children ages 3–7 in included health plans was accounted for by spending on children with current-year ASD.
Almost all increased spending for children with ASD was associated with outpatient behavioral intervention–related services, especially those associated with codes for applied behavioral analysis.
In 2017, 14.4% of children ages 3–7 years with current-year ASD incurred at least $20,000 in expenditures on outpatient behavioral intervention–related services, and 5.9% incurred at least $50,000 in such expenditures.
Children with autism spectrum disorder (ASD) often incur high health care expenditures. U.S. children ages 5–10 with employer-sponsored insurance (ESI) who had ASD recorded as a diagnosis during 2003 had mean expenditures six times higher ($6,420 versus $920) than those incurred by children who had no ASD diagnosis codes; median expenditures were 11 times higher ($3,020 versus $260) (1). However, little is known about recent changes in expenditures for insured children with ASD and the impact of increased access to outpatient behavioral intervention–related services for ASD on overall health care spending.
Over the past decade, there has been increased recognition that many children with ASD can benefit from intensive (>15 hours per week) behavioral and developmental interventions, including those based on applied behavioral analysis (ABA) principles (26). Policy changes, including state insurance mandates (7, 8), the 2008 Mental Health Parity and Addiction Equity Act (9), and actions by the Office of Personnel Management in 2012 to allow and in 2017 to require Federal Employee Health Benefits (FEHB) plans to cover services (10), have sought to promote access to services for individuals with ASD. Mandates have increased spending for children with ASD, especially those ages 3–7, who were enrolled in health plans subject to the mandates (8, 1113).
Intensive behavioral and developmental interventions for ASD are typically targeted to preschool-age children, with evidence of benefits associated with receipt of services for 25–40 hours per week (4, 6). However, only a minority of eligible children receive such services, which can exceed $50,000 in costs per year per child (5, 1416). Our objective was to assess changes during 2011–2017 in spending among children ages 3–7 with current-year ASD diagnoses who were enrolled in self-insured ESI health plans, compared with spending for other children. We also examined changes in the percentages of children who met specified cutoffs for frequency or intensity of use of behavioral intervention–related services.

Methods

Data

The IBM MarketScan Commercial Database is a nationwide convenience sample of claims data from ESI plans. It combines data from two sources: large employers that sponsor self-insured plans regulated by the U.S. Department of Labor and health plans that contract with other employers—mostly fully insured plans that are state regulated. We restricted our analysis to noncapitated large-employer–sponsored health plans that included claims for mental health and substance abuse services (further details are provided in an online supplement to this article). Capitated plans that pay providers a fixed amount per enrollee rather than reimbursing for specific services may report incomplete expenditure data.
MarketScan data are deidentified, and our analysis was not classified by the Centers for Disease Control and Prevention as human subjects research, and thus approval by an institutional review board was waived.

Analysis

We analyzed repeated cross-sections of calendar-year data from children who were continuously enrolled and had outpatient claims for at least 1 calendar year during 2011–2017 and were ages 3–7 years at the beginning of the year (see Table S1 in online supplement for details about the application of inclusion and exclusion criteria).
We identified children with a current-year ASD diagnosis on the basis of the presence of two or more claims on separate dates within a calendar year with an ICD-9-CM diagnosis code of 299.0, 299.8, or 299.9 or an ICD-10-CM code of F84.0, F84.5, F84.8, or F84.9. We report the prevalence of current-year ASD diagnosis nationally, by region, by rural-urban residence, and by sex.
Annual mean total inpatient, outpatient, and pharmacy expenditures were calculated for children with current-year ASD diagnoses and used to calculate the share of overall health care spending associated with ASD. We also report median total expenditures and mean and median out-of-pocket expenditures (see online supplement). Expenditures were calculated in terms of purchasing power in 2017 U.S. dollars by using the gross domestic product deflator (17).
We tabulated expenditures for outpatient non–emergency department encounters with behavioral intervention–related procedure codes (Table S2, part a, in the online supplement), regardless of whether there was an ASD diagnosis code for the claim. We also calculated the percentages of children with current-year ASD who exceeded annual cutoffs of days with service claims or annual spending. Because of the possibility of substitution as new procedure codes were introduced, we also examined changes in codes for the combination of outpatient behavioral, developmental, or mental health services (BMH services); such services include encounters with mental health providers, including psychologists, psychiatrists, child psychiatrists, developmental and behavioral pediatricians, and psychiatric nurses, and exclude encounters given behavioral intervention–related procedure codes to avoid double-counting. We reviewed codes used by other researchers (9, 18), searched for procedure codes, and consulted with clinical experts (see Table S2 in online supplement for a code list).
We analyzed behavioral intervention–related spending per child classified as having current-year ASD. Statistical significance was assessed by conducting two-sample t tests for changes in mean expenditures and two-sample tests of proportions for changes in prevalence between 2011 and 2017; test statistics and p values are reported. The analysis used Stata, version 14 (19).

Supplemental Analyses

In separate analyses, we analyzed data for children enrolled in capitated large-employer–sponsored plans or mostly fully insured ESI plans, regardless of capitation. In analyses of noncapitated large-employer–sponsored plans, we analyzed spending for the following age groups: 3–5, 6–7, and 8–17. We also conducted analyses that examined the influence of the time duration over which ASD case status was ascertained; individuals with relatively mild symptoms and few health care encounters may not meet the current-year ASD case definition but do so when ≥5 years of claims data are searched (20).

Results

Population Characteristics

The prevalence of current-year ASD among children ages 3–7 in ESI plans nearly doubled, from 0.56% (4,246 of 760,791 enrollees) in 2011 to 1.05% (7,561 of 722,348) in 2017 (z=33.51, p<0.001) (Table 1). Prevalence was higher in states on the East or West Coast, in urban areas, and among males (see Table S3 in online supplement).
TABLE 1. Children ages 3–7 years continuously enrolled in noncapitated large-employer plans and mean spending, by calendar yeara
 All enrolleesEnrollees with current-year ASDEnrollees without current-year ASDSpending on children with ASD as a % of spending on all children
  Spending (2017 $)  Spending (2017 $) Spending (2017 $)
YearNM±SDMedianN%M±SDMedianNM±SDMedian
2011760,7912,086±13,5027084,246.5613,198±30,6616,245756,5452,023±13,3177033.5
2012786,9942,075±12,1106964,813.6113,126±27,0546,303782,1812,007±11,9286913.9
2013803,6082,099±12,8046745,382.6714,316±34,4746,573798,2262,016±12,4926684.6
2014795,6932,109±13,1796656,090.7715,140±36,7866,830789,6032,009±12,7796595.5
2015756,0192,236±15,5006676,550.8716,600±42,2176,871749,4692,110±14,9986606.4
2016742,6612,332±17,3876776,989.9417,387±33,8087,535735,6722,189±16,9906697.0
2017722,3482,372±15,1456787,5611.0519,955±38,8208,110714,7872,186±14,5796708.8
% change, 2011–2017–514b–4788c51b30–68b–5151c
a
Source: MarketScan Commercial database, 2011–2017. Expenditures were adjusted for inflation to 2017 U.S. dollars by using the U.S. gross domestic product deflator. Children with current-year autism spectrum disorder (ASD) diagnoses had two or more ASD claims on separate days in the calendar year.
b
p<.001, two-sample t tests (immediate form) for the changes in mean expenditures between 2011 and 2017.
c
p<.001, two-sample tests of proportions (immediate form) for the changes between 2011 and 2017 in the percentage of enrollees with current-year ASD and in spending on children with ASD as a percentage of spending on all children.

Expenditures

Overall expenditures.

Mean expenditures for children ages 3–7 years with current-year ASD in noncapitated plans increased by 51% (t=9.76, df=11,805, p<0.001), from $13,198 in 2011 to $19,955 in 2017 (Table 1). Mean spending for all children grew by 14% (t=12.15, df=1,483,137, p<0.001); spending among children without current-year ASD grew by 8% (t=7.08, df=1,471,330, p<0.001). The ratio of mean expenditures for children with and without current-year ASD increased from 6.5 in 2011 to 9.1 in 2017. Between 2011 and 2017, the share of spending for all enrolled children ages 3–7 years accounted for by children with current-year ASD increased from 3.5% to 8.8% (z=134.99, p<0.001) (Table 1).
Median expenditures for children with current-year ASD increased by 30%, from $6,245 in 2011 to $8,110 in 2017, and the ratio of mean to median expenditures increased from 1.4 to 3.5 as the distribution of spending among children with current-year ASD became more skewed. The ratio of median expenditures for children with current-year ASD to those of children without current-year ASD increased from 8.9 to 12.1. The ratio of mean to median spending was 25%−30% lower for children with ASD than for children without ASD (Table 1)—i.e., spending was less skewed to the right for children with current-year ASD (see Figure S1 in online supplement).
Mean out-of-pocket spending for children with ASD increased over time but less rapidly than did total spending, with the out-of-pocket share of spending for children with ASD decreasing slightly—from 13.0% in 2011 to 11.5% in 2017 (see Table S4 in online supplement). For children with ASD, median out-of-pocket spending increased slightly, from 21.2% to 22.0% of total spending.

Outpatient BMH expenditures and encounters.

The increase in spending for non–emergency department outpatient encounters with behavioral intervention–related procedure codes was much larger than was the increase in overall spending. Mean outpatient behavioral intervention–related spending per child with current-year ASD increased from $1,746 in 2011 to $8,317 in 2017, an increase of 376% (t=17.86, df=11,805, p<0.001) (Table 2). The behavioral intervention–related share of overall spending among children with ASD increased from 13.2% in 2011 to 41.7% in 2017. Mean BMH spending in non–emergency department outpatient settings, which includes both behavioral intervention–related procedure codes and other behavioral and mental health services, increased from $2,859 in 2011 to $9,364 in 2017, a 228% increase (t=16.95, df=11,805, p<0.001), and the BMH share of all spending among children with ASD increased from 21.7% to 46.9% (Table 2). As a share of all BMH spending, behavioral intervention–related spending increased from 61.1% in 2011 to 88.8% in 2017. Mean spending for all health care services other than non–emergency department outpatient BMH was virtually the same at the beginning and end of the study period, $10,338 in 2011 and $10,591 in 2017 (Table 2).
TABLE 2. Expenditures for children ages 3–7 with current-year autism spectrum disorder (ASD) continuously enrolled in noncapitated large-employer plans, by calendar yeara
 Outpatient nonemergency behavioral intervention–related spending (2017 $)Outpatient nonemergency behavioral and mental health spending (2017 $)Other outpatient nonemergency spending (2017 $)Hospital services: emergency department and inpatient spending (2017 $)Outpatient pharmacy spending (2017 $)All spending other than outpatient nonemergency behavioral and mental health spending (2017 $)
YearM±SD% of all spendingM±SD% of all spendingM±SD% of all spendingM±SD% of all spendingM±SD% of all spendingM±SD% of all spending
20111,746±10,92313.22,859±12,21721.76,893±14,18952.22,045±20,54815.51,400±3,93610.610,338±27,57378.3
20121,956±11,97914.93,144±13,30224.06,904±12,81852.61,787±12,94313.71,291±3,5449.89,982±22,71776.0
20132,575±13,32418.03,741±14,42326.17,204±15,89650.31,995±19,15113.91,377±4,1369.610,575±30,85873.9
20143,123±13,69320.64,206±14,62427.87,498±19,04849.51,993±20,96213.11,443±7,3159.510,934±33,31472.2
20154,837±18,03929.15,868±18,96735.37,573±17,80645.61,779±23,77110.71,381±7,8408.310,733±36,94464.7
20166,323±21,56936.47,474±22,81843.07,252±14,39441.71,436±11,8468.31,225±10,0387.09,913±23,87757.0
20178,317±22,52841.79,364±23,27446.97,297±15,42636.61,743±14,0878.71,551±14,9627.810,591±30,22053.1
% change, 2011–2017376b 228b 6c –15d 11e 2f 
a
Source: MarketScan Commercial database, 2011–2017. Expenditures were adjusted for inflation to 2017 U.S. dollars by using the U.S. gross domestic product deflator. Children with current-year ASD diagnoses had two or more ASD claims on separate days in the calendar year.
b
p<.001, two-sample t tests (immediate form) for the changes in mean expenditures between 2011 and 2017.
c
p=.16, two-sample t test (immediate form) for the changes in mean expenditures between 2011 and 2017.
d
p=.35, two-sample t test (immediate form) for the changes in mean expenditures between 2011 and 2017.
e
p=.52, two-sample t tests (immediate form) for the changes in mean expenditures between 2011 and 2017.
f
p=.65, two-sample t test (immediate form) for the change in mean expenditures between 2011 and 2017.
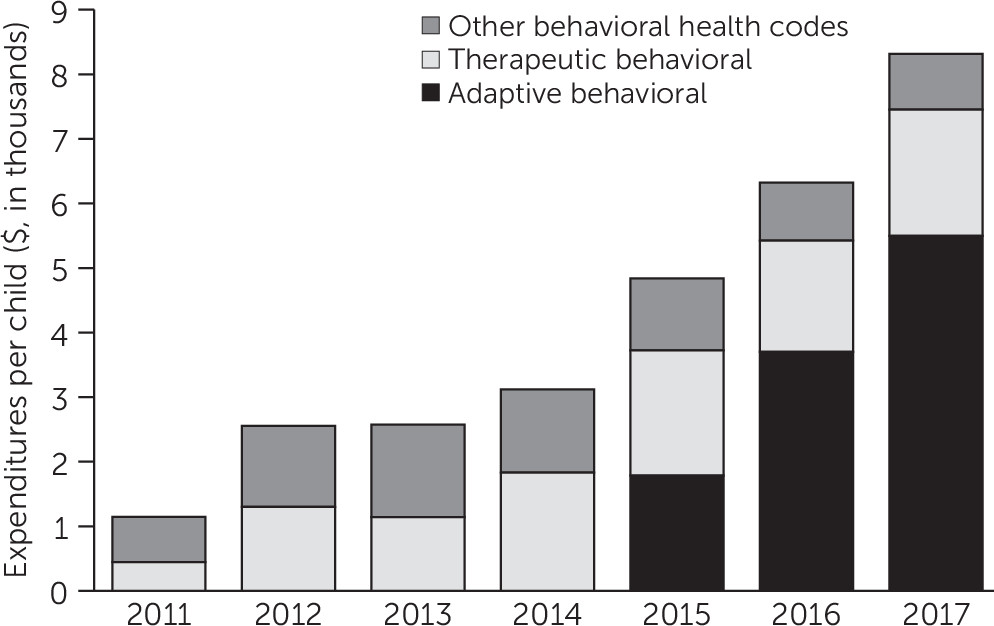
Mean±SD outpatient behavioral intervention–related spending associated with claims with procedure codes for adaptive behavioral interventions, such as ABA, increased from $1,785±$12,633 in 2015 to $5,498±$19,855 in 2017 per child with current-year ASD, accounting for 66% of behavioral intervention–related spending in 2017 (Figure 1). Spending associated with procedure codes for therapeutic behavioral services increased rapidly from 2011 to 2014 and subsequently plateaued (Figure 1).
FIGURE 1. Mean expenditures on outpatient behavioral intervention–related services per child ages 3–7 with current-year autism spectrum disorder (ASD) in noncapitated large- employer plans, by procedure code typea
aSource: MarketScan Commercial Data, 2011–2017. Expenditures were adjusted for inflation to 2017 U.S. dollars by using the U.S. gross domestic product deflator. Adaptive behavioral procedure codes 0364T–0374T; therapeutic behavioral procedure codes H2019 and H2020; behavioral intervention–related and all other behavioral intervention–related codes listed in Table S2, part a, in online supplement.
In 2011, 10.7% (N=453) of children ages 3–7 with current-year ASD in self-insured ESI plans had one or more outpatient claims with behavioral intervention–related codes, which tripled to 32.3% (N=2,445) in 2017 (z=26.18, p<0.001) (Table 3). There was also rapid growth in the proportion of children ages 3–7 with current-year ASD who had outpatient claims with behavioral intervention–related codes on ≥60 days, from 3.1% (N=131) in 2011 to 18.9% (N=1,428) in 2017 (z=24.33, p<0.001). Similarly, 14.4% (N=1,092) of these children incurred ≥$20,000 spending during 2017 on outpatient encounters given behavioral intervention–related codes, up from 2.5% (N=106) in 2011 (z=20.57, p<0.001). When cutoffs of 180 service days or $50,000 annual spending were used, the absolute increases were smaller, from 1.2% (N=49) to 6.1% (N=465) (z=12.54, p<0.001) and from 1.2% (N=52) to 5.9% (N=444) (z=12.20, p<0.001), respectively.
TABLE 3. Receipt of reimbursed behavioral intervention–related services (in percentages) among children ages 3–7 with current-year autism spectrum disorder (ASD) continuously enrolled in noncapitated large-employer plans, by calendar yeara
  Yearly behavioral intervention–related claims on ≥30 daysYearly behavioral intervention–related spending (2017 $)
YearAny behavioral intervention-related claim≥30 days≥60 days≥90 days≥180 days≥$10,000≥$20,000≥$50,000
201110.74.53.12.41.23.42.51.2
201212.65.53.82.81.14.02.51.2
201313.67.65.44.31.95.63.91.7
201417.29.87.05.32.17.44.81.9
201523.315.011.48.53.611.68.23.0
201627.919.415.312.35.015.410.53.8
201732.323.218.915.46.119.614.45.9
a
Source: MarketScan Commercial database, 2011–2017. Children with current-year ASD diagnoses had two or more ASD claims on separate days in the calendar year. p<.001, two-sample tests of proportions (immediate form) for all changes between 2011 and 2017.

Supplementary Analyses

Among children with ASD enrolled in “other,” mostly fully insured ESI plans, we observed similar levels and percentage changes in per-child spending, but the numbers of cases and expenditure estimates were less stable (see Table S5 in online supplement). Among children with ASD enrolled in large-employer–sponsored capitated plans, mean spending per child increased during 2011–2017 by 185%, versus 51% for those enrolled noncapitated plans (see Table S6 in online supplement).
Among children with current-year ASD in noncapitated plans, those ages 3–5 had higher overall spending than did those ages 6–7; the relative increase in total spending was also higher for the younger group, 60% versus 36% (see Table S7 in online supplement). Among children with ASD ages 8–17 years, mean spending per child increased by 25% during 2011–2017 (see Table S8 in online supplement). Mean behavioral intervention–related spending increased by 553%, from 2.9% of spending in 2011 to 15.4% in 2017.
Numbers of children ages 3–7 years in 2011–2013 with ASD and per-child expenditures (in 2017 dollars) are reported for three time windows for ascertaining cases, in addition to the algorithm of two or more ASD claims on separate days in the current calendar year used in our main analysis (see Table S9 in online supplement). The number of children in each year who met the criterion of two or more ASD claims at any point in 5 years of data was approximately twice the number who met this criterion in the current year. In addition, mean spending per child was 27%−31% lower for cohorts with ASD ascertained using 5 years of data, although temporal changes were similar. The implication is that children with current-year ASD have higher health care utilization and expenditures than the broader population of children with ASD identified by using ASD claims over a 5-year period.

Discussion

To our knowledge, this is the first study to document post-2012 changes in health care spending for U.S. children with ASD covered by large-employer–sponsored plans. Increases in inflation-adjusted per-child expenditures for children ages 3–7 with current-year ASD diagnoses far outpaced spending for children without ASD, as defined in the study; during 2011–2017, the increases were 51% and 8%, respectively. Mean spending per child with current-year ASD increased from roughly $13,000 in 2011 to $20,000 in 2017. Combined with the doubling of current-year ASD diagnoses, two-fifths (41%) of the total increase in per-child spending for all children ages 3–7 in noncapitated large-employer–sponsored plans was accounted for by spending on children with current-year ASD diagnoses.
Despite rapid growth in the prevalence of current-year ASD diagnosis to 1.05% in 2017, it remained low relative to the 1.85% prevalence among 8-year-old children in the Autism and Developmental Disabilities Monitoring Network in 2016 or the 2.76% parent-reported prevalence among children ages 3–17 in the National Health Interview Survey in 2016 (21, 22). It should be noted that use of a time window of 5 years resulted in twice as many children being classified as having ASD in 2013, 1.45% versus 0.67% (see Table S9 in online supplement). Additionally, children with parent-reported ASD may not have ASD listed in medical claims and may also be more likely to be enrolled in Medicaid.
The increase in spending for privately insured children ages 3–7 with current-year ASD was driven by outpatient behavioral intervention–related spending, which accounted for almost all of the nearly fourfold increase in inflation-adjusted spending per child with ASD, compared with a 2% increase in all other spending. In 2011, 2.5% of children with current-year ASD incurred more than $20,000 in outpatient spending (in 2017 dollars) associated with behavioral intervention–related codes, which increased to 14.4% in 2017 (Table 3). Because early intensive behavioral and developmental interventions are likely to cost at least $20,000 per year (5), it follows that a minority of privately insured children with ASD were receiving early intensive interventions reimbursed through health plans. One cannot determine by using claims data which children with ASD required early intensive intervention. Although cost offsets have been documented with early intensive interventions (5, 14, 15), the impact of services delivered with lower intensity or frequency is not known.
The expansion in spending by large-employer–sponsored plans on behavioral services for young children with ASD cannot be explained by state mandates, because few such plans were subject to state laws, unlike fully insured ESI plans (8, 11). On the other hand, the expansion of mandates from 2008 onward (7) together with grassroots advocacy from parents may have contributed to growing acceptance by self-insured employers of early intensive behavioral intervention as the standard of care, as reflected in national FEHB policies that evolved from allowing such services in 2012 to a mandate for such services in 2017 (10).
Our findings cannot be generalized to children with public insurance or no health insurance. Published estimates of health care costs for U.S. children with ASD for all payer types are substantially lower than those reported here (2325). Traditionally, Medicaid programs have been reported to pay for behavioral therapies for Medicaid-enrolled children with ASD (2631).
An important limitation is that the MarketScan Commercial databases include only claims submitted to participating ESI plans; claims covered by Medicaid are not included. Children with ASD whose families have private insurance may obtain Medicaid coverage through waiver programs (28, 30, 32, 33), “medically needy” classification, receipt of Supplemental Security Income benefits, or conventional income-based eligibility. We were unable to quantify the extent to which the estimates for the ESI sample might have been underestimated and how that changed over time. This could be an area for research using state all-payer claims databases.
Our study had other limitations. We had no information on income, education, or race-ethnicity. All administrative databases are subject to incomplete sensitivity and specificity of diagnosis codes for ASD (20). Requiring two or more claims with ASD diagnosis codes increased the specificity but lowered the sensitivity for identifying children with ASD (20). The length of the “window” of claims data used to identify ASD cases affected estimates of both numbers of ASD cases and per-child spending for those meeting the ASD case definition. In supplementary analyses, we altered the time window over which ASD case status was ascertained. We found that requiring two or more claims with ASD codes for current-year ASD excluded roughly half the children who met the same ASD claims criterion using 5 years of data (see Table S6 in online supplement). The excluded children had considerably lower expenditures in years prior to meeting the ASD claims criterion. However, those children accounted for a very small proportion of the comparison group. We were able to compare only temporal changes for a few years for the group ascertained with 5 years of data and observed similar increases in expenditures despite lower levels of per-child spending with a longer window for case ascertainment (see Table S9 in online supplement).
Procedure codes for ABA services were introduced in late 2014 and soon dominated behavioral intervention–related spending. It is likely that the introduction of specific ABA procedure codes increased reimbursements as well as substituted for other procedure codes, specifically for therapeutic behavioral services. The share of all behavioral intervention–related spending associated with those two types of procedure codes increased from 24% in 2011 to 90% in 2017 (Figure 1). Because most other behavioral intervention–related procedure codes do not specify the type of service provided, we could not determine which other claims may have been billed for intensive behavioral and developmental interventions.
In addition, our study did not assess the overall utilization of services by privately insured young children with ASD, and it excluded services delivered through schools or paid directly by families or through Medicaid waivers. Surveys of U.S. caregivers of school-age children with ASD reported that schools have been the primary place where behavioral services are delivered (34, 35). Other data sources would be required to determine to what extent increased spending by large-employer plans represented increased use of interventions among privately insured children with ASD in this age group, as opposed to substitution of payment for services otherwise paid for by families, schools, or Medicaid.
Changes in the composition of the MarketScan sample over time could affect comparability of estimates. We restricted our main analysis to noncapitated large-employer plans, which had more stable enrollments than did other plans (see Table S1 in online supplement). Likely owing to changing plan composition, expenditure estimates for children with ASD in the other two plan types were less stable and more difficult to interpret (see Tables S5 and S6 in online supplement). Finally, our database included only year of birth; we were unable to accurately determine a child’s age when he or she received services.
Conclusions

Between 2011 and 2017, spending on overall health care and behavioral intervention–related services for privately insured young children with current-year ASD increased rapidly, and such findings have not been previously reported. Behavioral intervention–related spending as a share of spending increased almost fourfold, which accounted for almost the entire increase in overall spending for privately insured young children with ASD during that period. However, even at the end of the period, only a minority of privately insured children in this age group received intensive behavioral intervention–related services reimbursed through health plans sponsored by large employers.

Footnotes

The findings and conclusions in this report are those of the authors and do not necessarily represent the official position of the CDC.
The authors report no financial relationships with commercial interests.

Supplementary Material

File (appi.ps.202000099.ds001.pdf)

References

1.
Shimabukuro TT, Grosse SD, Rice C: Medical expenditures for children with an autism spectrum disorder in a privately insured population. J Autism Dev Disord 2008; 38:546–552
2.
Weitlauf AS, McPheeters ML, Peters B, et al: Therapies for Children With Autism Spectrum Disorder: Behavioral Interventions Update. Rockville, MD, Agency for Healthcare Research and Quality, 2014
3.
Warren Z, McPheeters ML, Sathe N, et al: A systematic review of early intensive intervention for autism spectrum disorders. Pediatrics 2011; 127:e1303–e1311
4.
Caron V, Bérubé A, Paquet A: Implementation evaluation of early intensive behavioral intervention programs for children with autism spectrum disorders: a systematic review of studies in the last decade. Eval Program Plann 2017; 62:1–8
5.
Cidav Z, Munson J, Estes A, et al: Cost offset associated with Early Start Denver model for children with autism. J Am Acad Child Adolesc Psychiatry 2017; 56:777–783
6.
Schreibman L, Dawson G, Stahmer AC, et al: Naturalistic developmental behavioral interventions: empirically validated treatments for autism spectrum disorder. J Autism Dev Disord 2015; 45:2411–2428
7.
Chatterji P, Decker SL, Markowitz S: The effects of mandated health insurance benefits for autism on out-of-pocket costs and access to treatment. J Policy Anal Manage 2015; 34:328–353
8.
Barry CL, Epstein AJ, Marcus SC, et al: Effects of state insurance mandates on health care use and spending for autism spectrum disorder. Health Aff 2017; 36:1754–1761
9.
Stuart EA, McGinty EE, Kalb L, et al: Increased service use among children with autism spectrum disorder associated with mental health parity law. Health Aff 2017; 36:337–345
10.
Onukwugha E, McRae J, Kravetz A, et al: Cost-of-illness studies: an updated review of current methods. Pharmacoeconomics 2016; 34:43–58
11.
Candon MK, Barry CL, Epstein AJ, et al: The differential effects of insurance mandates on health care spending for children’s autism spectrum disorder. Med Care 2018; 56:228–232
12.
Saloner B, Barry CL: Changes in spending and service use after a state autism insurance mandate. Autism 2017; 23:167–174, 2019
13.
Wang L, Ma J, Dholakia R, et al: Changes in healthcare expenditures after the autism insurance mandate. Res Autism Spectr Disord 2019; 57:97–104
14.
Piccininni C, Bisnaire L, Penner M: Cost-effectiveness of wait time reduction for intensive behavioral intervention services in Ontario, Canada. JAMA Pediatr 2017; 171:23–30
15.
Peters-Scheffer N, Didden R, Korzilius H, et al: Cost comparison of early intensive behavioral intervention and treatment as usual for children with autism spectrum disorder in The Netherlands. Res Dev Disabil 2012; 33:1763–1772
16.
Zuckerman KE, Friedman NDB, Chavez AE, et al: Parent-reported severity and health/educational services use among US children with autism: results from a national survey. J Dev Behav Pediatr 2017; 38:260–268
17.
Dunn A, Grosse SD, Zuvekas SH: Adjusting health expenditures for inflation: a review of measures for health services research in the United States. Health Serv Res 2018; 53:175–196
18.
Cidav Z, Lawer L, Marcus SC, et al: Age-related variation in health service use and associated expenditures among children with autism. J Autism Dev Disord 2013; 43:924–931
19.
Cuzick J: A Wilcoxon-type test for trend. Stat Med 1985; 4:87–90
20.
Burke JP, Jain A, Yang W, et al: Does a claims diagnosis of autism mean a true case? Autism 2014; 18:321–330
21.
Xu G, Strathearn L, Liu B, et al: Prevalence of autism spectrum disorder among US children and adolescents, 2014–2016. JAMA 2018; 319:81–82
22.
Maenner MJ, Shaw KA, Baio J, et al: Prevalence of autism spectrum disorder among children aged 8 years—Autism and Developmental Disabilities Monitoring Network, 11 sites, United States, 2016. MMWR Surveill Summ 2020; 69:1–12
23.
Croen LA, Najjar DV, Ray GT, et al: A comparison of health care utilization and costs of children with and without autism spectrum disorders in a large group-model health plan. Pediatrics 2006; 118:e1203–e1211
24.
Lavelle TA, Weinstein MC, Newhouse JP, et al: Economic burden of childhood autism spectrum disorders. Pediatrics 2014; 133:e520–e529
25.
Amendah D, Grosse S, Peacock G, et al: The economic costs of autism: a review; in Autism Spectrum Disorders. Edited by Amaral DG, Dawson G, Geschwind DH. New York, Oxford University Press, 2011
26.
Wang L, Mandell DS, Lawer L, et al: Healthcare service use and costs for autism spectrum disorder: a comparison between Medicaid and private insurance. J Autism Dev Disord 2013; 43:1057–1064
27.
Peacock G, Amendah D, Ouyang L, et al: Autism spectrum disorders and health care expenditures: the effects of co-occurring conditions. J Dev Behav Pediatr 2012; 33:2–8
28.
Cidav Z, Marcus SC, Mandell DS: Home- and community-based waivers for children with autism: effects on service use and costs. Intellect Dev Disabil 2014; 52:239–248
29.
Kang-Yi CD, Locke J, Marcus SC, et al: School-based behavioral health service use and expenditures for children with autism and children with other disorders. Psychiatr Serv 2016; 67:101–106
30.
Shattuck PT, Grosse S, Parish S, et al: Utilization of a Medicaid-funded intervention for children with autism. Psychiatr Serv 2009; 60:549–552
31.
Stein BD, Sorbero MJ, Goswami U, et al: Impact of a private health insurance mandate on public sector autism service use in Pennsylvania. J Am Acad Child Adolesc Psychiatry 2012; 51:771–779
32.
LaClair M, Mandell DS, Dick AW, et al: The effect of Medicaid waivers on ameliorating racial/ethnic disparities among children with autism. Health Serv Res 2019; 54:912–919
33.
Yingling ME, Bell BA, Hock RM: Comparing neighborhoods of children with autism spectrum disorder in a Medicaid waiver program and a state population, 2007­–2015. Psychiatr Serv 2019; 70:1034–1039
34.
Zuckerman K, Lindly OJ, Chavez AE: Timeliness of autism spectrum disorder diagnosis and use of services among US elementary school-aged children. Psychiatr Serv 2017; 68:33–40
35.
Monz BU, Houghton R, Law K, et al: Treatment patterns in children with autism in the United States. Autism Res 2019; 12:517–526

Information & Authors

Information

Published In

Go to Psychiatric Services
Psychiatric Services
Pages: 16 - 22
PubMed: 33076792

History

Received: 14 February 2020
Revision received: 17 April 2020
Accepted: 21 May 2020
Published online: 20 October 2020
Published in print: January 01, 2021

Keywords

  1. Autism
  2. Economics

Authors

Details

Scott D. Grosse, Ph.D. [email protected]
National Center on Birth Defects and Developmental Disabilities, Centers for Disease Control and Prevention (CDC), Atlanta (Grosse, Nichols, Yeargin-Allsopp); Department of Pediatrics, Emory University School of Medicine and Children’s Healthcare of Atlanta, Atlanta (Ji); Center for Financing, Access and Cost Trends, Agency for Healthcare Research and Quality, Rockville, Maryland (Zuvekas); Department of Psychiatry and Behavioral Sciences, Emory University School of Medicine, Atlanta (Rice). This work was performed when Dr. Ji was a Prevention Effectiveness Fellow at the CDC.
Xu Ji, Ph.D.
National Center on Birth Defects and Developmental Disabilities, Centers for Disease Control and Prevention (CDC), Atlanta (Grosse, Nichols, Yeargin-Allsopp); Department of Pediatrics, Emory University School of Medicine and Children’s Healthcare of Atlanta, Atlanta (Ji); Center for Financing, Access and Cost Trends, Agency for Healthcare Research and Quality, Rockville, Maryland (Zuvekas); Department of Psychiatry and Behavioral Sciences, Emory University School of Medicine, Atlanta (Rice). This work was performed when Dr. Ji was a Prevention Effectiveness Fellow at the CDC.
Phyllis Nichols, M.P.H.
National Center on Birth Defects and Developmental Disabilities, Centers for Disease Control and Prevention (CDC), Atlanta (Grosse, Nichols, Yeargin-Allsopp); Department of Pediatrics, Emory University School of Medicine and Children’s Healthcare of Atlanta, Atlanta (Ji); Center for Financing, Access and Cost Trends, Agency for Healthcare Research and Quality, Rockville, Maryland (Zuvekas); Department of Psychiatry and Behavioral Sciences, Emory University School of Medicine, Atlanta (Rice). This work was performed when Dr. Ji was a Prevention Effectiveness Fellow at the CDC.
Samuel H. Zuvekas, Ph.D.
National Center on Birth Defects and Developmental Disabilities, Centers for Disease Control and Prevention (CDC), Atlanta (Grosse, Nichols, Yeargin-Allsopp); Department of Pediatrics, Emory University School of Medicine and Children’s Healthcare of Atlanta, Atlanta (Ji); Center for Financing, Access and Cost Trends, Agency for Healthcare Research and Quality, Rockville, Maryland (Zuvekas); Department of Psychiatry and Behavioral Sciences, Emory University School of Medicine, Atlanta (Rice). This work was performed when Dr. Ji was a Prevention Effectiveness Fellow at the CDC.
Catherine E. Rice, Ph.D.
National Center on Birth Defects and Developmental Disabilities, Centers for Disease Control and Prevention (CDC), Atlanta (Grosse, Nichols, Yeargin-Allsopp); Department of Pediatrics, Emory University School of Medicine and Children’s Healthcare of Atlanta, Atlanta (Ji); Center for Financing, Access and Cost Trends, Agency for Healthcare Research and Quality, Rockville, Maryland (Zuvekas); Department of Psychiatry and Behavioral Sciences, Emory University School of Medicine, Atlanta (Rice). This work was performed when Dr. Ji was a Prevention Effectiveness Fellow at the CDC.
Marshalyn Yeargin-Allsopp, M.D.
National Center on Birth Defects and Developmental Disabilities, Centers for Disease Control and Prevention (CDC), Atlanta (Grosse, Nichols, Yeargin-Allsopp); Department of Pediatrics, Emory University School of Medicine and Children’s Healthcare of Atlanta, Atlanta (Ji); Center for Financing, Access and Cost Trends, Agency for Healthcare Research and Quality, Rockville, Maryland (Zuvekas); Department of Psychiatry and Behavioral Sciences, Emory University School of Medicine, Atlanta (Rice). This work was performed when Dr. Ji was a Prevention Effectiveness Fellow at the CDC.

Notes

Send correspondence to Dr. Grosse ([email protected]).

Metrics & Citations

Metrics

Citations

Export Citations

If you have the appropriate software installed, you can download article citation data to the citation manager of your choice. Simply select your manager software from the list below and click Download.

For more information or tips please see 'Downloading to a citation manager' in the Help menu.

Format
Citation style
Style
Copy to clipboard

View Options

View options

PDF/EPUB

View PDF/EPUB

Login options

Already a subscriber? Access your subscription through your login credentials or your institution for full access to this article.

Personal login Institutional Login Open Athens login
Purchase Options

Purchase this article to access the full text.

PPV Articles - Psychiatric Services

PPV Articles - Psychiatric Services

Not a subscriber?

Subscribe Now / Learn More

PsychiatryOnline subscription options offer access to the DSM-5-TR® library, books, journals, CME, and patient resources. This all-in-one virtual library provides psychiatrists and mental health professionals with key resources for diagnosis, treatment, research, and professional development.

Need more help? PsychiatryOnline Customer Service may be reached by emailing [email protected] or by calling 800-368-5777 (in the U.S.) or 703-907-7322 (outside the U.S.).

Media

Figures

Other

Tables

Share

Share

Share article link

Share