Subjects
Comprehensive data were collected for the years 1994 through 1997 for all adult male users of VA behavioral health services programs and for all men incarcerated in 16 counties in northeastern New York state. The counties are Albany, Allegheny, Chemung, Chenango, Columbia, Cortland, Essex, Franklin, Greene, Herkimer, Jefferson, Lewis, Otsego, Schenectady, Steuben, and Washington. For the purposes of comparison, data were collected for all men who received inpatient behavioral health care services in general hospitals and state mental hospitals in the same counties between 1994 and 1996.
Data on the VA sample were extracted from two computerized national workload files: the patient treatment file, which is a discharge abstract file that documents all episodes of VA hospital care, and the outpatient care file, a workload file that documents all VA outpatient service use. Service codes and residence zip codes in these files allowed identification of all users of VA psychiatric services, substance abuse services, or both types of services—that is, dual diagnosis patients—during each year. Over the four-year study period, data were obtained on 5,603 male VA system users, including 5,445 users of outpatient services and 1,682 users of inpatient services.
Data on persons incarcerated in local jails were obtained from correctional authorities for the 16 counties. A total of 44,783 episodes of incarceration involving an unduplicated total of 27,869±728 adult male residents between 1994 and 1997 were described in this file. All unique personal identifiers except date of birth were stripped from the incarceration files by the agencies responsible for the files. The procedure for determining the unduplicated number of people represented in this dataset is described below.
Data on users of inpatient behavioral health services in general hospitals were obtained from the New York State Department of Health. These data describe 15,510 episodes of hospitalization involving 9,039±115 male patients in the study area who were hospitalized for psychiatric disorders in general hospitals between 1994 and 1996. The procedure for determining the unduplicated number of people represented in this dataset is described below.
Data on inpatients of state mental hospitals in the 16 counties were obtained from the New York Office of Mental Health. This file included 1,896 computer records that described episodes of hospitalization for 1,321 male patients who were hospitalized for psychiatric disorders in state mental hospitals in the study area between 1994 and 1996.
Statistical method
Estimation of overlap between the samples was based entirely on probabilistic population estimation, a statistical procedure that was developed to facilitate the use of existing operational and administrative datasets for mental health service systems research. The procedure, its derivation, and validation studies are described in detail elsewhere (
16,
18,
19). This method addresses the question of how many individuals in datasets from two organizations are served by both of them. The following paragraphs describe the application of this procedure in the current study and demonstrate the precision and validity of the estimates.
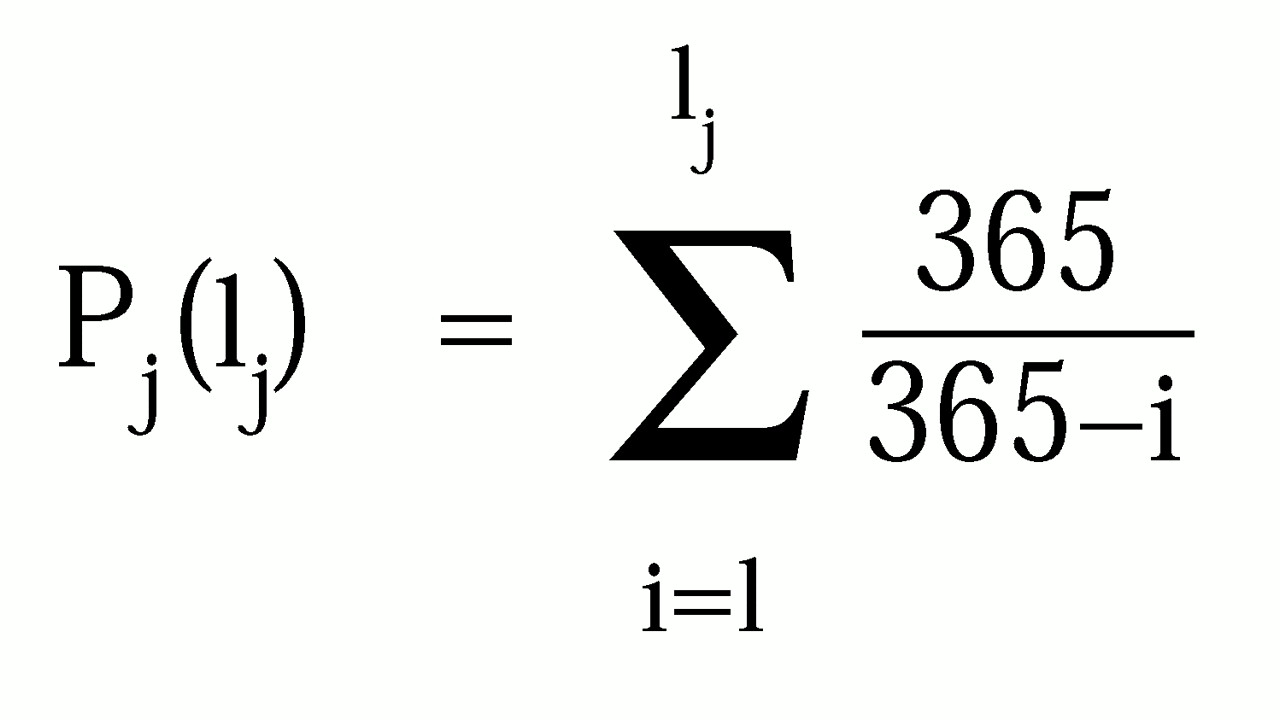
In order to derive estimates of the number of individuals represented in the criminal justice and the general hospital datasets, each dataset was broken into smaller data subsets in which all records listed the same year of birth—for example, all records in the subset were for men born in 1945. The number of distinct birthdays that occurred in each data subset was counted. The number of persons necessary to produce the observed number of birthdays was calculated using the formula

where P
j is the population estimate for subset j, and l
j is the number of birthdays observed in the year. Confidence intervals for the estimate were calculated using a similar procedure. Estimates of the total number of individuals represented in the complete dataset and the confidence intervals for this estimate were obtained by combining the results for every year-of-birth cohort in the original dataset. Because this procedure uses the number of dates of birth represented in a dataset rather than the number of records in the dataset, the dataset may include multiple records for a single individual—for example, event or episode records.
In order to probabilistically determine the number of individuals shared across datasets that do not use unique person identifiers, the sizes of three populations are determined, and the results are compared. First, the number of persons represented in the dataset that describes each of the service sectors is determined. In this study, the datasets came from a behavioral health service system and a criminal justice system. A third dataset is formed by combining the two original datasets and determining the number of individuals represented in the combined dataset. In this study, the number of individuals represented in the original and the combined (concatenated) datasets were determined using probabilistic population estimation.
The number of individuals who are shared by the two datasets is the difference between the sum of the numbers of people represented in the two original datasets and the number of people represented in the combined dataset. This result occurs because the sum of the number of people represented in the two original datasets will include a double count of every person who is represented in both datasets. The number of individuals represented in the combined dataset does not include this duplication. The difference between these two numbers is the size of the duplication between the two original datasets, the size of the caseload overlap.
Because the VA datasets included a unique person identifier, it was possible to compare actual unduplicated counts of the number of persons represented in these datasets with the probabilistic estimates of the number of individuals represented.
Table 1 presents the results of this comparison for three diagnostic groups and for the population of VA clients overall. In every case, the probabilistic estimate was within 1 percent of the true value, and the 95 percent confidence interval of the estimate included the true value in every case. In a larger demonstration, the 95 percent confidence interval would include the true value in 19 of every 20 demonstrations.
 where Pj is the population estimate for subset j, and lj is the number of birthdays observed in the year. Confidence intervals for the estimate were calculated using a similar procedure. Estimates of the total number of individuals represented in the complete dataset and the confidence intervals for this estimate were obtained by combining the results for every year-of-birth cohort in the original dataset. Because this procedure uses the number of dates of birth represented in a dataset rather than the number of records in the dataset, the dataset may include multiple records for a single individual—for example, event or episode records.


