Linkage analysis and positional cloning
The genes that are mutated in cystic fibrosis, Huntington’s disease, and hundreds of other recessive and dominant disorders were identified in the past 20 years by positional cloning. The concept of positional cloning is a genetic approach, not requiring any prior hypothesis about the disorder, but rather starting with localizing the disease gene to its position on a chromosome. The first step in positional cloning is linkage analysis. Linkage relies on the fact that when DNA segments or loci are near each other on a chromosome, they tend to get inherited together. If they are further apart, recombination during meiosis can separate the loci. Markers are an indirect way to track the inheritance or “mark” an unknown locus, e.g., a gene that affects the risk for bipolar disorder or a locus that affects blood pressure. A genetic marker is thus a DNA segment with a known location on a chromosome whose inheritance can be followed. In genetics classes, this principle is often illustrated with visible genetic markers, for example, different eye colors and bristle lengths in Drosophila crosses. When red-eyed flies mostly have short bristles and white-eyed flies mostly have long bristles, we conclude that the genes for eye color and bristle length are cosegregating and, therefore, that they are on the same chromosome.
In human genetics we use mostly molecular markers. In the early years, these were restriction fragment length polymorphisms [RFLPs, pronounced rif-lips, explained previously (
2)]. The most commonly used polymorphisms nowadays are microsatellites and single nucleotide polymorphisms (SNPs, pronounced snips). Microsatellites or short tandem repeats are stretches of short repeats of sequences, e.g. GTGTGTGTGT or GATAGATAGATAGATA. These repeats, of which there are an estimated 50,000 in the human genome, occur at the same position in all individuals, but differ in number of repeats. For example, a locus may have four, five, or even more than 10 alleles by having 17, 19, 20, 21, etc., repeats of GT. One individual might have 21 copies of GT on one chromosome and 23 copies of GT on the other, resulting in a 4-base pair length difference at this locus. This length difference can be demonstrated by polymerase chain reaction amplification specific for each locus, followed by acrylamide or capillary electrophoresis to separate the different sizes.
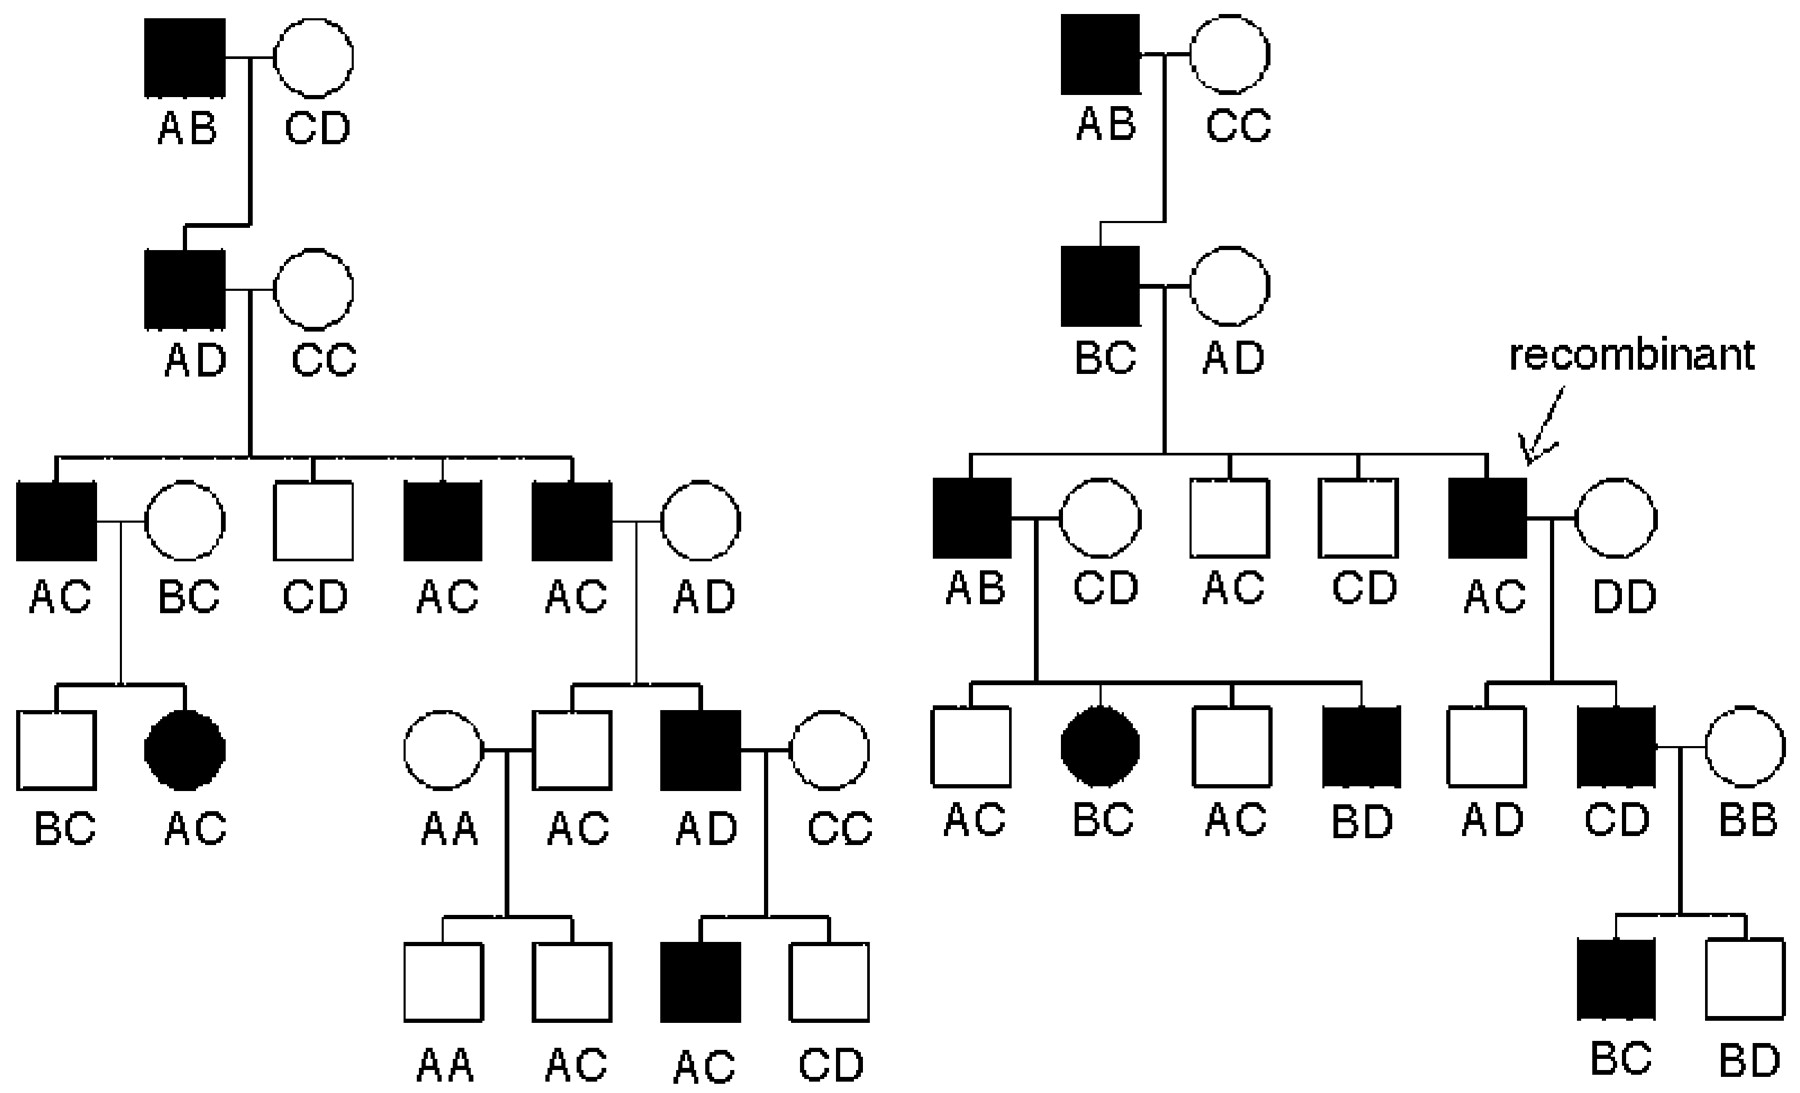
In linkage analysis, geneticists use genetic markers to determine the chromosomal location of the gene for a disorder. This is possible without knowing anything about the function of the disorder or the gene. Figure 1 illustrates this concept. In the family on the left, everyone who is affected inherited the A allele of the locus from an affected founder. In the family on the right, most affected family members inherited the B allele at the same locus, except one individual, a recombinant indicated by the arrow, who inherited the C allele from the affected parent, suggesting that a recombination event occurred between the genetic marker locus and the disease locus in the meiosis step leading to that individual. All subsequent offspring who are affected then also carry the C allele, because after the recombination event, the C allele of the marker locus is close to the disease locus. Note that for linkage, the specific allele that is linked (A, B, or C) can be different in each family, even when there is close linkage between the marker and the gene. Once linkage has been found, a statement about the rough chromosomal location but not about the nature of the gene can be made. In lay articles this issue is often confused in statements such as “Gene for Bipolar Disorder Found,” when the evidence just suggests a specific chromosomal location.
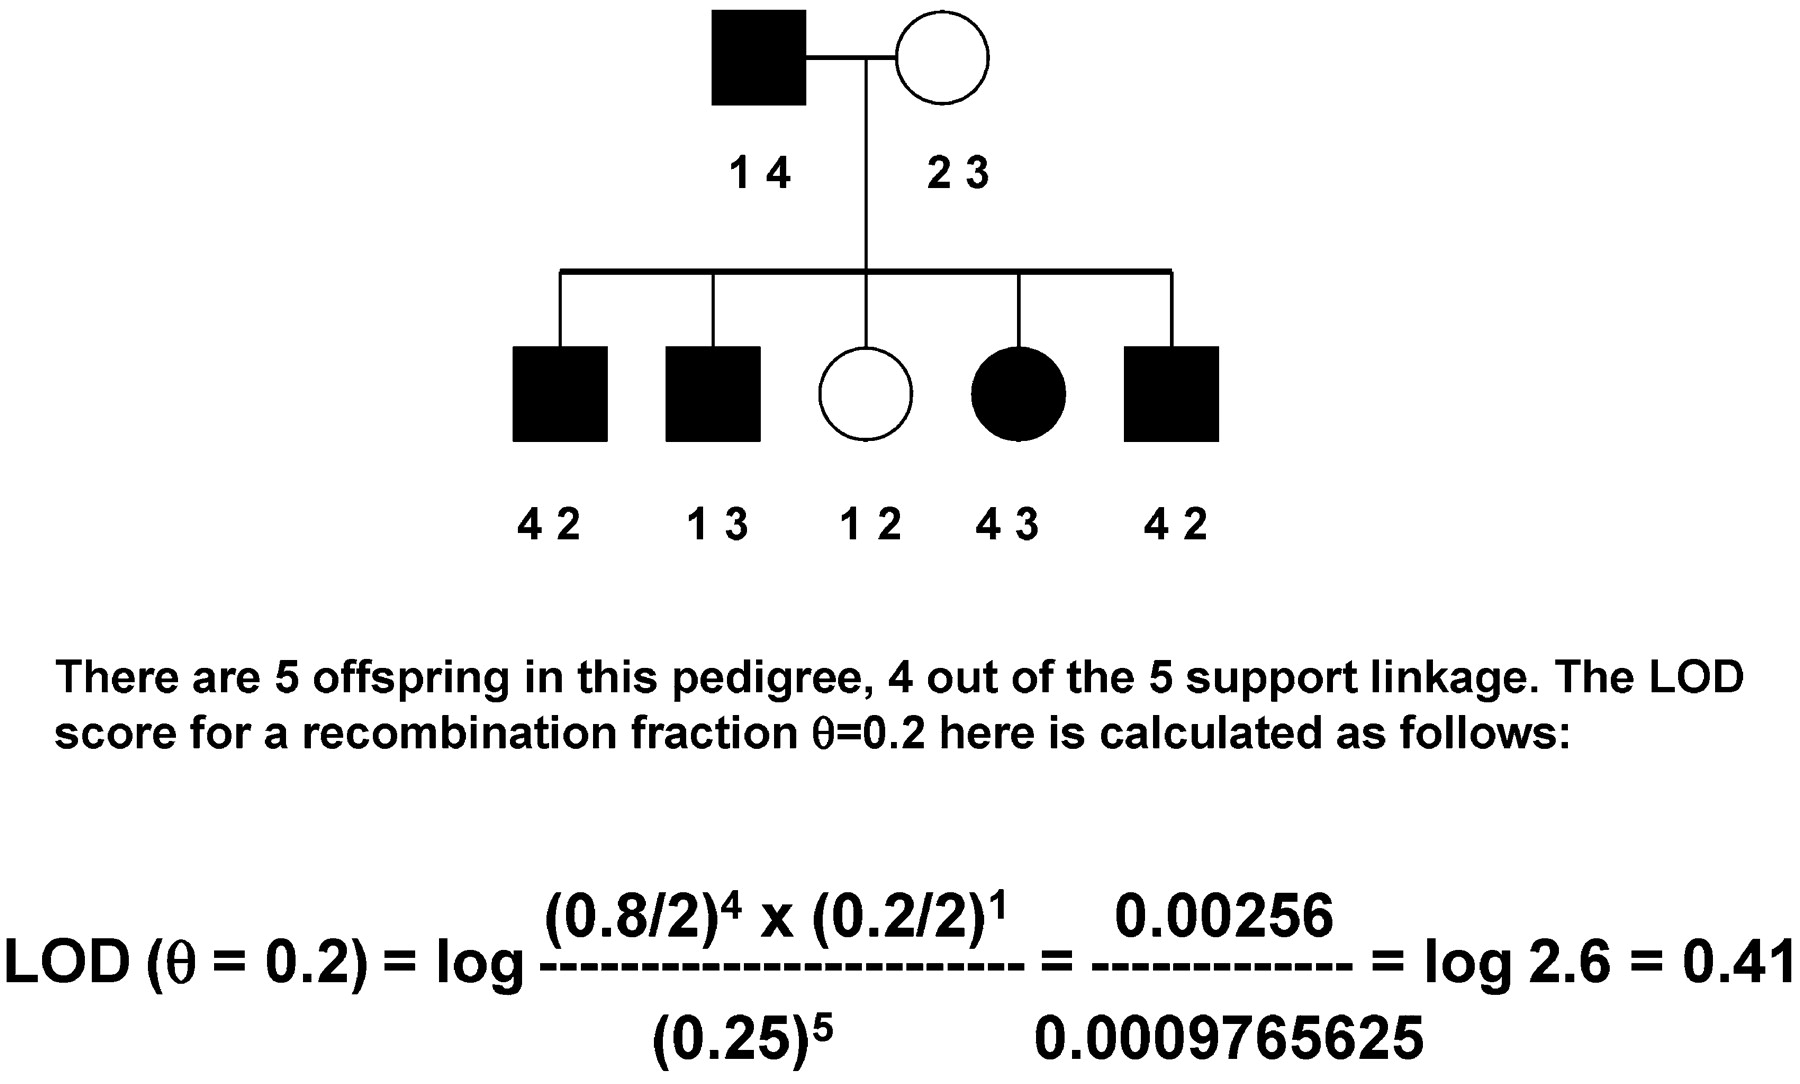
Although the two families shown in Figure 1 suggest linkage, we need to attach a degree of certainty, or significance level, to the data. For linkage analysis, that is traditionally done by calculating a logarithm of odds (LOD) score. The null hypothesis indicates that a disorder and a marker are completely unlinked, not on the same chromosome. We expect such loci to segregate with Mendelian ratios: if the founder is heterozygous for the disease and heterozygous at a locus with alleles A and B, half of the time the disorder will be inherited with the A allele and the other half of the time with the B allele; i.e., two alleles on unlinked loci are inherited together 50% of the time. If the gene mutated in the disorder is on the same chromosome, but a certain distance away from the marker, we define this distance as theta (0), which is measured as how θ often recombination happens: 0 θ = 0.1 means that 10% of the time the two loci (e.g., a marker and the disease locus) are separated by recombination. The formula to calculate a LOD score for a recombination fraction of 0.1 is given by:
Figure 2 shows a simple pedigree in which the LOD score is calculated. Usually, all but the most simple pedigrees require a computer program, in which typically two very small numbers are determined and divided. If the data are 1,000 times more likely to have occurred under the assumption of linkage than under the null hypothesis of no linkage or Mendelian expectations, the LOD score would be 3 (log to base 10 of 1,000:1). This is traditionally considered the threshold for declaring significant linkage. We do not use a ratio of 20:1, as the traditional significance threshold of a p = 0.05 value might suggest, because typically many markers all over the genome are tested. We need to compensate for the testing of the many markers all over the genome, with each one having a very low a priori chance of being linked. In fact, in humans, a LOD score of 3.3 is approximately equivalent to p = 0.05 (
3). As a rule of thumb, each informative meiosis can increase the LOD score by about 0.3. When more than one family is analyzed, the probabilities would have to be multiplied, but LOD scores for the same markers can simply be added. For a Mendelian, fully penetrant disorder such as Huntington’s disease, a single family with five affected members and five unaffected members without recombinants or three different families with a total of 10 children would be sufficient to find significant linkage, as would as few as three affected children from cousin marriages with a recessive disorder (
4). Thus, parametric linkage analysis can be very powerful for Mendelian disorders, and in such cases, very few families are needed to determine the chromosomal location of a disease locus.
Complexity in psychiatric disorder genetics
Psychiatric disorders are more complex, however. In complex disorders, a single mutation is usually neither necessary nor sufficient. The causes of genetic complexity were systematically reviewed in 1994 (
5). For psychiatric disorders, a small effect of each vulnerability allele, which will increase or decrease risk by only a small factor, many risk genes (heterogeneity), interaction with environmental factors, and diagnostic uncertainty are the most likely causes of complex inheritance. Heterogeneity is a problem when families are combined in parametric linkage analysis— one unlinked family can cancel out the positive results from a linked family. Diagnostic uncertainty here does not have the same meaning as in clinical usage: we could be very sure of the DSM-IV diagnosis of bipolar disorder, depression, and substance abuse, yet still have a problem in our linkage analysis: in the genetic model used in linkage analysis, we need to specify whom to call affected and whom to call unaffected. Thus, we are left with a problem: on the one hand, the risks for depression and substance use disorders are increased in families that are ascertained for bipolar disorder, so some cases of depression and of substance abuse may be different manifestations of the same susceptibility gene, and thus one might call all of these individuals affected. On the other hand, not all subjects with depression or alcoholism have “latent” bipolar disorder—there are other causes for these much more common disorders. Thus, these subjects often have to be classified as “unknown,” neither affected nor unaffected, or linkage analysis is performed with more than one model: a narrow model in which only subjects with pure bipolar I disorder are called affected, an intermediate model that may include subjects with schizoaffective disorder or bipolar II disorder, and a broad model in which all subjects with any mood disorder may be called affected. The phenomenon of pleiotropy (many different phenotypic manifestations of the same gene) can also be illustrated by genetic syndromes with psychiatric manifestations: a fairly common deletion on 22q leads to velocardiofacial syndrome, which, in addition to palatal, heart, and facial abnormalities, is associated with behavioral abnormalities including mood, anxiety disorders, attention deficit hyperactivity disorder, and an increased risk for schizophrenia (
6,
7). Clearly, this genetic vulnerability factor increases risk for behavioral abnormalities that span the diagnostic spectrum.
In addition, genetic predisposition factors for psychiatric disorders interact with the environment. We know, for example, from twin studies of depression that there is probably an interaction between genetic risk factors, early childhood environment, and stressful life events (
8). It is thought that stressful life events leave resilient individuals healthy but increase the risk for depression in a subset of people predisposed by genetic risk factors when they are exposed to the environmental triggers. Similarly, it is thought that whether someone experimenting with nicotine or illegal substances becomes addicted may have genetic components, yet environmental access to cigarettes or illegal substances of abuse also play a key role.
Genetic association
Assuming that by traditional or nonparametric linkage analysis one or several peaks that suggest a high likelihood of a gene somewhere in one or more genetically defined regions were identified, how do we proceed to identify the gene? With the human genome map now available, we are able to determine all the genes that lie under such a peak. Such genes would be called positional candidate genes, because they became candidate genes due to their position. In contrast, the serotonin transporter gene, for example, is a (biological) candidate gene for depression: its protein is the target of antidepressants. Similarly, dopamine receptors are biological candidate genes for schizophrenia. To test such positional or biological candidate genes is conceptionally simple: we search for genetic variations in these genes, preferentially functional variants (genetic variations that affect the strength of a promoter, a repressor binding site, or splicing or encode a different amino acid). We then genotype such variants in several hundred affected persons and control samples and ask, Is the distribution of the alleles different? If the allele increases risk, it would be more frequent among affected persons than among control subjects; if it decreases risk, it will be more common among control subjects. For example,
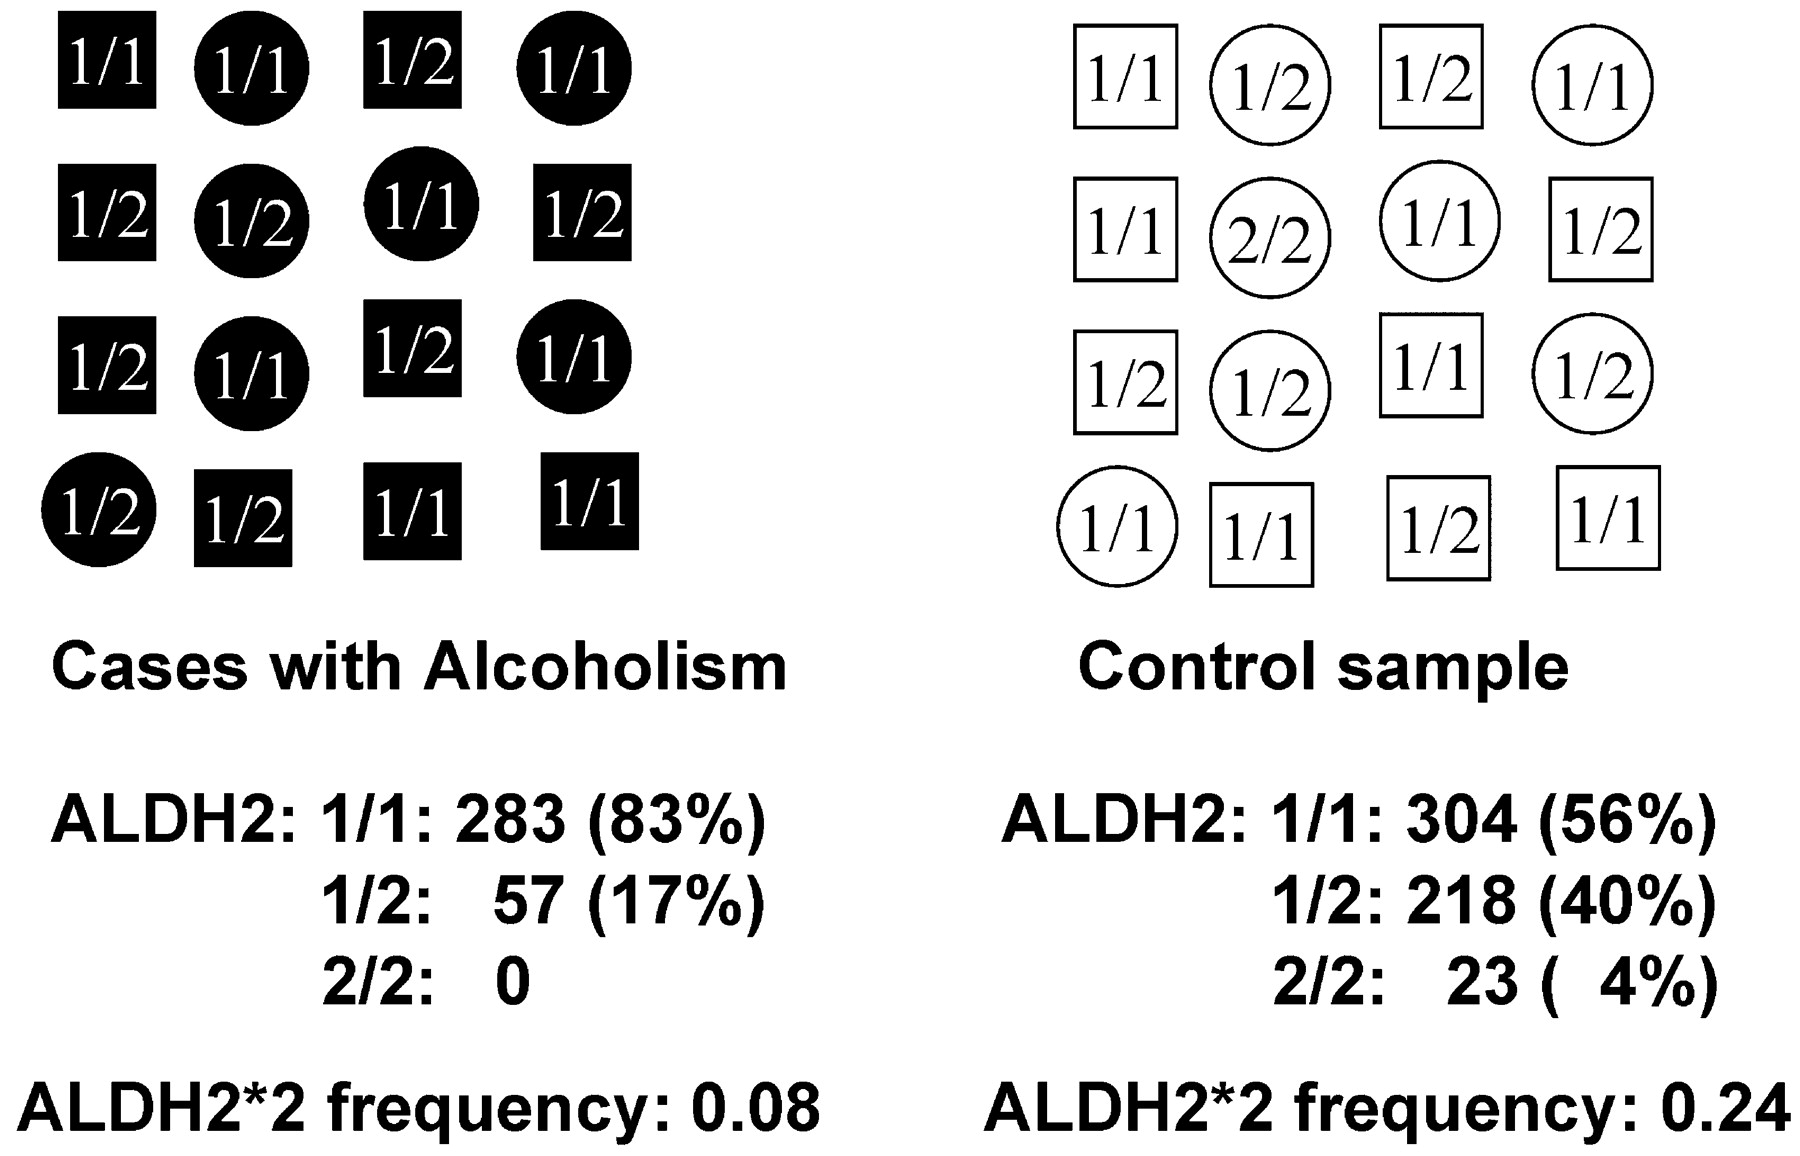
ALDH2*2 is a nonfunctional allele of the aldehyde dehydrogenase gene that is quite common in Southeast Asia—nearly half of Southeast Asian individuals are heterozygous carriers of the nonfunctional allele. This allele has been known for more than 30 years to protect against alcoholism (
11): subjects who are homozygous for the mutant form cannot easily metabolize the first degradation product of alcohol, acetaldehyde, and have a so-called flushing response: They feel dizzy and nauseated after drinking alcohol. This very unpleasant response to alcohol protects these gene carriers substantially against alcoholism (see reference
12 for a recent review). Heterozygous individuals degrade acetaldehyde more slowly, acetaldehyde builds up and leads to the flushing response, and this unpleasant response leads to negative reinforcement, thus decreasing the risk for alcoholism. Thus, if we compare the frequency of this allele among the affected individuals and control subjects, we find an association (Figure 3): the mutant form is rarer among affected individuals than among control subjects, or, genetically speaking, we detect a genotype frequency difference among the affected individuals and the control subjects, as well as an allele frequency difference. Although this is an example of a protective allele, similarly, predisposing alleles would be found more often in affected individuals than in control subjects.
Association studies can be used to detect such a difference in frequency between affected persons and control subjects even if alleles have a relatively minor effect, for example, increasing risk by only 1.5- or 2-fold, and even in the presence of heterogeneity, even if there are dozens of alleles that affect risk. Simulation studies with such small effect size alleles have shown that association studies are much more powerful than linkage analysis (
13).
One problem with association studies is that the result is a correlation, and just as any correlation is not proof of causation, there are other reasons that loci may be associated than genetic predisposition. If a trait in question is more common in one ethnic group than in another, the affected persons and control subjects may not be ethnically well matched, and any allele that is more common in one group than in the other will appear associated, even though it is really only a marker of ethnicity. For example, if we were to map the ability to eat with chopsticks, we would find a strong association with HLA alleles that are more common in Chinese than in European populations (
3). This problem, called “ethnic stratification,” can be overcome statistically by using genetic markers all over the genome that test for ethic stratification and assign an ethnicity or ethnic mix to each individual (
14) or by using the nontransmitted chromosomes of parents as controls (
15), as I explained in more detail in a previous publication (
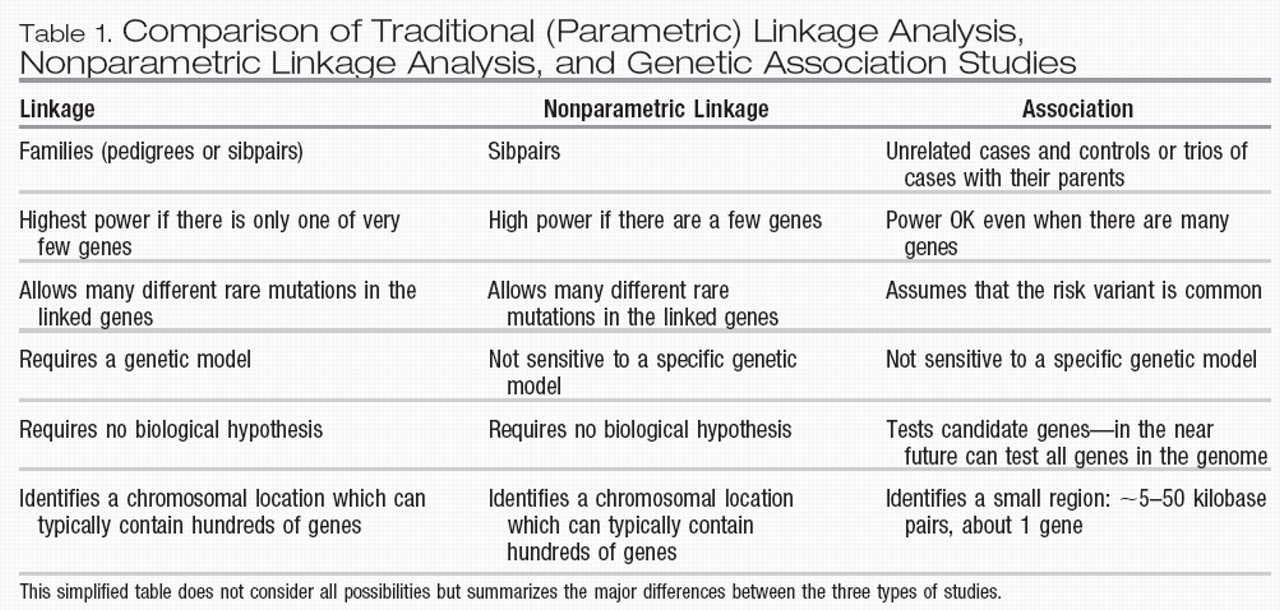
2). The latter strategy is particularly useful when one is studying childhood-onset psychiatric disorders such as obsessive-compulsive disorder (OCD) and autism, for which parents are usually easily recruited at the same time as the proband. The requirements and differences between linkage and association studies are summarized in Table 1.
Linkage disequilibrium and whole genome association studies
Until recently, only one or a few genetic variants in a few candidate genes could be tested for association. However, if for complex traits the power of association is so much larger than the power of linkage, one wonders whether it would be possible to survey the whole genome for association with the disorder, just as linkage tests routinely the whole genome. There is more than enough genetic variation— on average, there is a SNP every 300 bases and any two individuals differ about once every 1,000 bases. Given that the whole genome has 3 × 10⁹ base pairs, this would suggest that we might have to test several million SNPs— even with new technologies, that number is currently quite unrealistic.
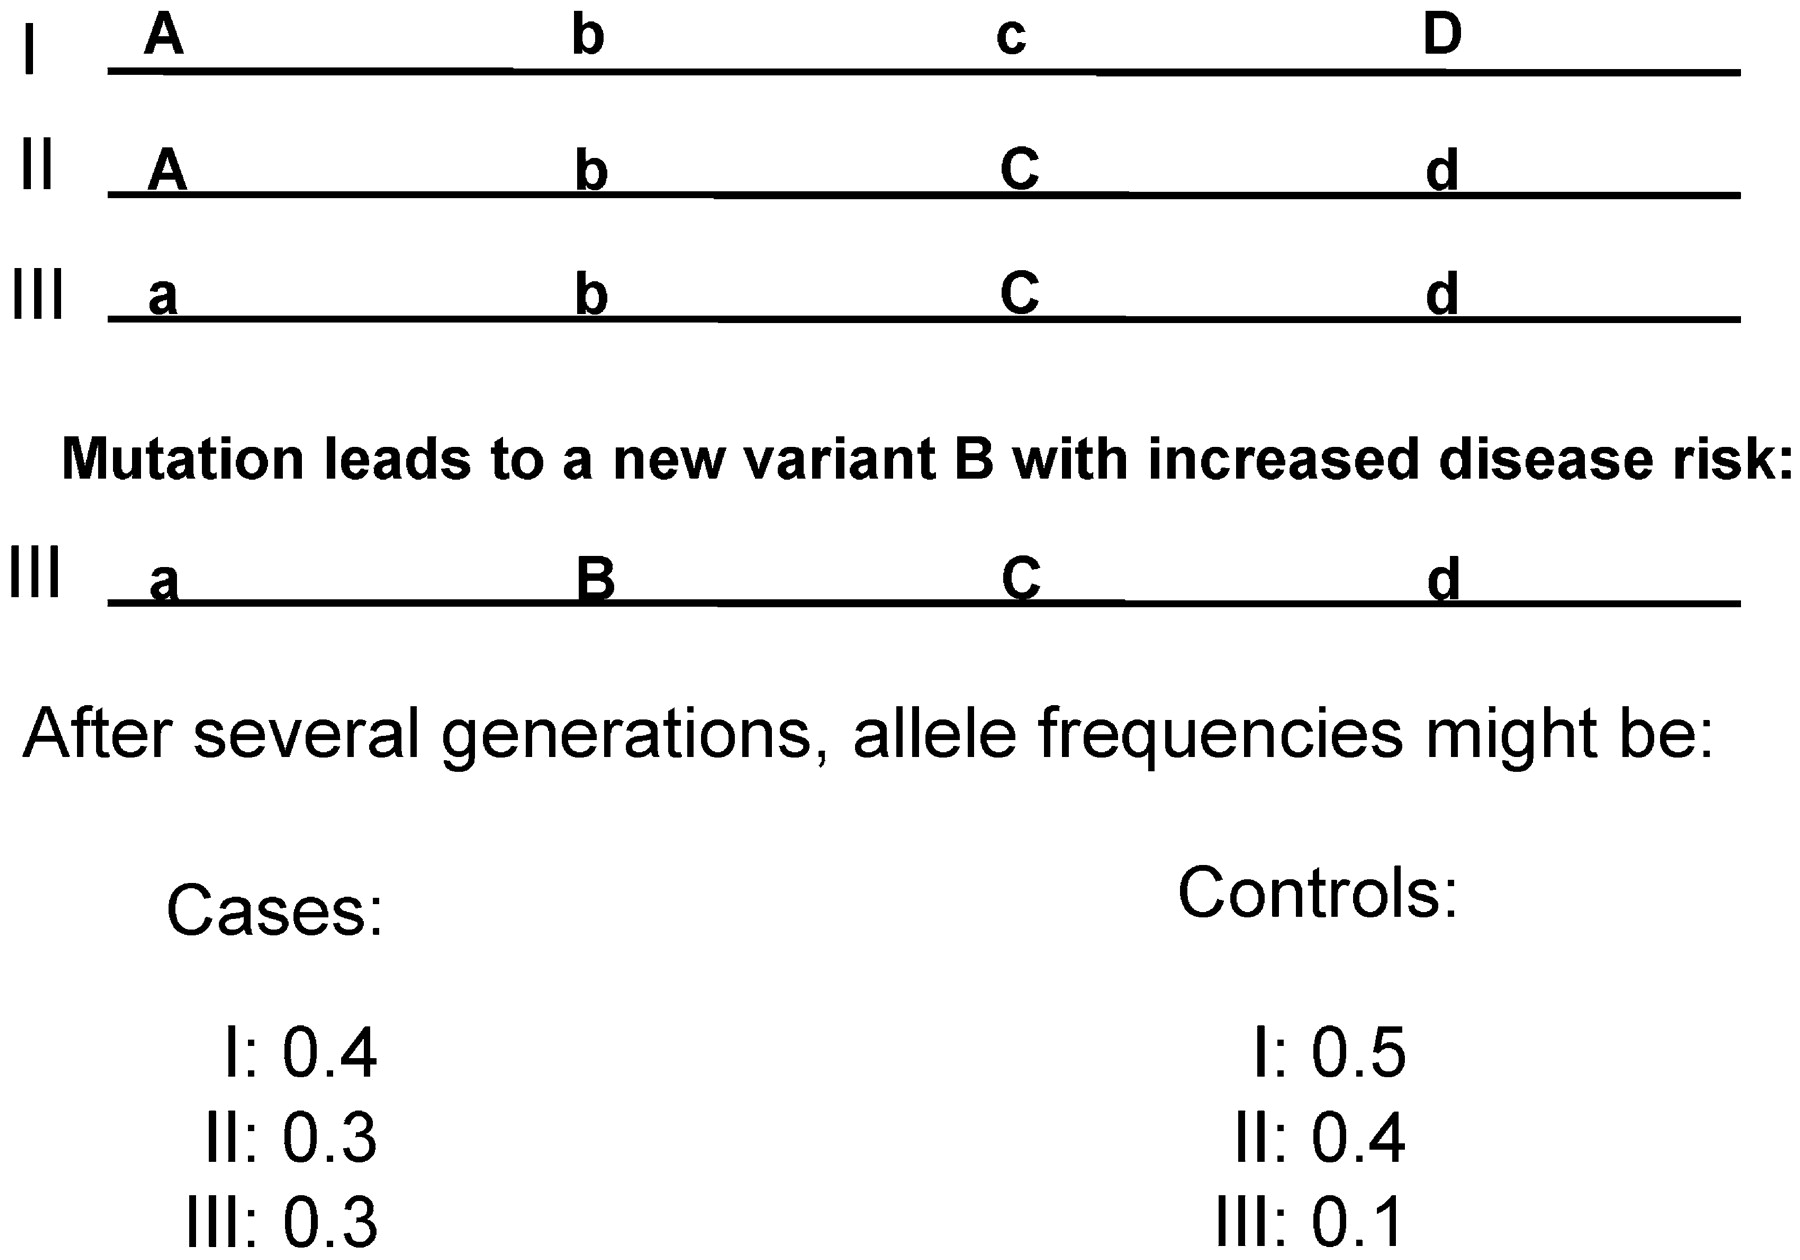
Luckily, in the past few years, it has become clear that about 300,000–500,000 carefully chosen SNPs are sufficient to get nearly all the information for the 3–10 million SNPs, at least in non-African populations such as Asians and Caucasians. The reason is that many of the millions of SNPs are highly correlated; thus, when we know the genotype at one SNP, we can predict with high probability the genotype of several others due to a phenomenon called linkage disequilibrium (LD). LD basically is a reflection of the history of a mutation or SNP. Figure 4 illustrates this point. When a new mutation, B, occurs, it necessarily happens on a specific chromosome with a specific combination of alleles at nearby loci. Combinations of alleles inherited together on one chromosome are called a haplotype. All future chromosomes containing that new SNP allele B will initially contain that original haplotype on surrounding alleles. If these alleles are very close to the mutation, recombination will not happen until a long time has passed, and the LD between B and the original haplotype will persist. Thus, even if we are not aware of a hypothetical, schizophrenia-causing allele B, we expect to find that the B-containing haplotype would be more common among affected individuals than among control subjects (Figure 4). Such patterns of association of alleles are pervasive over the genome, and many SNPs are completely redundant: in the example in Figure 4, the SNP with alleles C and c is in complete LD with the SNP with alleles D and d— knowing one allows complete prediction of the other.
The HAPMAP Consortium (
16) has compiled this pattern of LD for about 2 million SNPs in the three major populations—Africans, Asians, and Caucasians. Using these data, several companies are now offering chips that allow genotyping of 300,000–500,000 SNPs that cover most (75%–90%) of the genetic information of all 2 million SNPs. These chips will thus allow powerful association studies over the whole genome to not just identify association with expected biological candidate genes but also allow testing of all genes of the genome, which may lead to identification of completely new pathways in psychiatric disorders. Results from such studies are expected in the next few years.
Current status of gene identification in psychiatric disorders
Linkage studies in the major psychiatric disorders have been largely disappointing. Whenever linkage was performed on a new set of families, the chromosomal regions implicated were different in each study. Recently, therefore, scientists have started to perform meta-analyses. Meta-analysis is a systematic way to combine data from different studies. It is used in both linkage and association studies to overcome the limitations in power in smaller individual studies. However, even meta-analyses of linkage results in psychiatric disorders are not encouraging: whereas chromosomes 8p and 13q, regions that have sometimes also been implicated in schizophrenia, were implicated in bipolar disorder in an early meta-analysis (
20), in one recent large meta-analysis not a single region that was significant genome-wide was found, and results in other chromosomal regions were borderline (
21). In a third meta-analysis on >5,000 individuals in >1,000 families yet another two regions, 6q and 8q, were implicated (
10). For schizophrenia, 8p and 22q were initially identified (
20), but a later meta-analysis implicated 2q, a region not previously discussed much for schizophrenia (
8). In autism, a region on chromosome 7q has been fairly consistently implicated and confirmed in meta-analyses (
22,
23). However, many other regions have also been found to be linked, with various degrees of replication, and no gene on 7q has been consistently found to be associated with autism. Only two very large linkage scans have been performed for OCD, and in both the same region on 9q was identified, suggesting that there might be less of a problem with heterogeneity in this disorder (
24,
25), but no gene has been identified. Several large studies and meta-analyses also suggested some consistent linkage peaks for substance abuse, with interesting overlaps between linkage for different types of drugs of abuse (
26).
Association studies have been performed on both biological candidate genes and systematically under a linkage peak. About a dozen candidate genes have been found to be associated with schizophrenia and have been replicated more than once, but none is consistent, and often different alleles are implicated in different studies. There is disagreement in the field whether most of these will turn out to be false-positives, or whether we now need to take the dozen or so associations and try to understand the biology of how variants in these genes might cause the disorder (
27). Because of the rapidly changing field, I will not address here specific details of any of these association findings, except for one example discussed in the next section.
Glossary
This is an updated version of a glossary that was previously compiled and published (
2).
Allele—
One of several alternative forms of a locus.
APM—
Affected pedigree member method. A non-parametric linkage method in which alleles that are shared between at least two affected individuals of a family are compared.
ASP—
Affected sibpair method. A specific form of APM using only affected sibs.
Candidate gene—
A gene that might be involved in the disease. A biological candidate gene might be involved in the neurotransmitter system implicated by the psychoactive drugs for the disorder (e.g., serotonin system genes for depression), whereas a positional candidate gene is any gene that maps within a chromosomal region implicated by linkage.
Endophenotype—
A
phenotype that is measurable but unseen by the unaided eye along the pathway between
genotype and
phenotype (
32).
Genotype—
The genetic constitution of an individual.
GRR—
Genotype relative risk. The increased risk of having a given disorder due to carrying one particular allele compared with not carrying this allele. In contrast to the relative risk λ, GRR is not known until a risk allele has been identified.
Haplotype—
a combination of closely linked alleles inherited together as a unit. When phase is unknown, haplotype is often unknown and needs to be estimated.
Heterogeneity—
Genetic or locus heterogeneity exists if mutations in different genes can cause the same phenotype. This should be contrasted with allelic heterogeneity, when different mutations in the same gene can cause the same disease.
HRR—
Haplotype relative risk method. A statistical method for association studies in which the nontransmitted parental alleles are used as controls.
HWE—
Hardy Weinberg equilibrium. If there is no selection and the population is in equilibrium with random mating, the distributions of genotypes for alleles p and q is given as p2 + 2pq + q2 and similar for more alleles. Deviation from HWE (which is tested using a chi-square test with 1 df for two alleles) can indicate recent admixture (nonrandom mating) or selection but is often observed due to genotyping errors.
IBD—
Identity by descent. The identity of two alleles in two individuals because they inherited the same chromosomal segment carrying the allele from a common ancestor.
IBS—
Identity by state. Identity of two alleles in two people. Identity by state may or may not reflect IBD, which is the more relevant parameter.
LD—
Linkage disequilibrium. Preferential association of one allele of one locus with a particular allele of another locus more than expected by chance. In the simplest case, a rare disease mutation may be in LD with alleles on nearby loci because the mutation arose only once, on a founder chromosome that carried specific alleles. Those loci close to the mutation have not been separated from the mutation during evolution. Therefore, alleles that were present in the founder chromosome are overrepresented in patients.
Linkage—
The close proximity of two loci on a chromosome such that they are separated during meiosis less frequently than expected by chance (50%).
Locus—
Plural loci: a defined place in the genome. A locus can be a place where a disease gene has been mapped to, a specific gene, a specific SNP, or a genetic marker.
LOD score—
The logarithm to base 10 of the likelihood ratio. The likelihood ratio gives odds favoring linkage at a specific distance, measured as recombination fraction θ, over the alternative, no linkage. By convention, a LOD score >3, reflecting an odds ratio of 1000:1, is taken as significant evidence for linkage, a LOD score of −2 (odds 100:1 against linkage) as evidence for excluding linkage. A LOD score of 3.0 is approximately equivalent to p = 0.09, and p = 0.05 requires a LOD score of 3.3 for Mendelian disorders (
5).
MAF—
Minor allele frequency. In a biallelic locus, the frequency of the rarer of the two forms of the locus. In the psychiatric genetic literature, instead of MAF, often only “frequency” is used. This rather imprecise term usually refers to the frequency of allele-carriers, which for rare alleles is about twice the MAF.
Mutation—
The process that leads to any change of a heritable DNA sequence change. In human molecular genetics, often the distinction is made between (disease-causing) mutations and innocuous polymorphisms. See also sequence variation.
Parametric—
model-based. Parametric linkage analysis requires specifying a genetic model, which includes dominance, penetrance, age of onset, and many other parameters. The contrast is nonparametric.
Phase—
Assignment of a chromosome for alleles of two or more closely linked loci: if an individual is heterozygous (
1,
2) at each of two adjacent loci, the phase is unknown because the chromosomes could either be 1-1 and 2-2 or 1-2 and 2-1.
Pleiotropy—
One gene (or genetic variant) can have many different phenotypic manifestations.
Phenotype—
The appearance or attributes of an individual (whether resulting from genotype, environment, or combinations of these).
Polymorphism—
The occurrence of at least two alleles of a locus of which the rarer allele has a frequency of at least 1% in at least one population. In recent years, the frequency criterion has been relaxed, and rare polymorphism may be contrasted as nonpathological with (disease-causing) mutations. See also sequence variation.
QTL—
Quantitative trait locus. A locus that affects the magnitude of a quantitative trait, i.e., a phenotype that shows continuous variation, such as height, blood pressure, basal cortisol level, or neuroticism.
RFLP—
Restriction fragment length polymorphism. A polymorphism that results in an altered pattern of DNA fragments after the action of a specific restriction enzyme.
RR—
Relative risk λ: recurrence risk for relative of an affected compared to the general population, e.g. λ
o is the risk to offspring of affected parents. Recurrence risks for most psychiatric disorders are given at
http://www.nchpeg.org/cdrom/empiric.html.
Sequence variation—
The term
sequence variation is used to prevent confusion with the terms
mutation and
polymorphism, mutation meaning any kind of heritable change in some disciplines (e.g., epidemiology and population genetics) and “disease-causing change” in human molecular genetics and polymorphism meaning “non– disease-causing change” or “change found at a frequency of 1% or higher in the population” (
35).
SNP—
Single nucleotide polymorphism. A locus in which there are two or more possible alleles of a single nucleotide, both common in at least one population (usually MAF>0.01). Recently, SNP has been used for any nucleotide change, i.e., many publications now mention rare SNPs.
SSLP—
Simple sequence length polymorphism, also known as microsatellite or STR marker. A locus in which a simple sequence (e.g., GT, CAA, or GATA) is repeated in tandem many times and in which there are multiple alleles of different length, resulting from different numbers of the repeat.
STR—
Short tandem repeat. See SSLP.
TDT—
Transmission disequilibrium test. A statistic that tests for linkage and association simultaneously. A positive TDT test means that parents heterozygous for a predisposing allele transmit that allele more frequently to affected offspring than the chance expectation of 50%.
Variant—
See sequence variation.

