Spatial Tasks
Line Bisection: Subjects made a significantly higher number of total left (right plus left hand, 11.5 ± 3.7) than right displacements (right plus left hand, 8.7 ± 4.1;
Z = –2.34,
P = 0.02). For the hands separately, this difference was significant for the left hand (
Z = –3.14,
P = 0.002) but not the right (
Z = –0.43,
P = 0.66) (
Table 1). With the left hand, more subjects bisected lines to the left than to the right (χ
2 = 6.43, df = 1,
P = 0.01). With the right hand, neither side was preferred over the other (χ
2 = 0.26, df = 1,
P = 0.61).
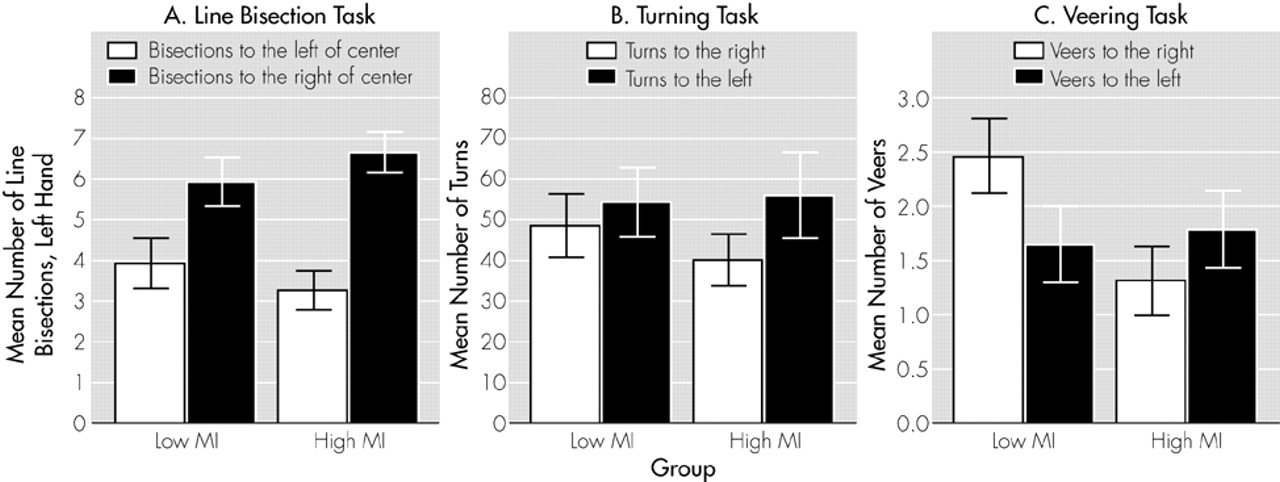
Line Bisection Performance and MI: Across hands, the high MI group did not differ from the low MI group in the number of left (Z = –0.98, P = 0.33) or right (Z = –0.48, P = 0.63) displacements. Groups did not differ significantly in left displacements with the left (Z = –0.90, P = 0.37) or right hand (Z = –0.60, P = 0.55) and for right displacements with the left (Z = –0.74, P = 0.46) or right hand (Z = –0.22, P = 0.83). As illustrated in Figure 1A, the high MI group demonstrated a significant preference for left-sided displacements with the left hand (Z = –2.70, P = 0.007). For the right hand, the difference was in the same direction, but was note statistically significant (Z = –0.46, P = 0.65). The low MI group did not differ between left or right displacements for either hand (left hand, Z = –1.66, P = 0.10; right hand, Z = –0.06, P = 0.95).
The correlations between MI scores and number of left displacements with either hand (left hand, Spearman rank-correlation coefficient [Sr] = –0.15, P = 0.38; right hand, Sr = –0.04, P = 0.81) or right displacements with either hand (left hand, Sr = –0.05, P = 0.78; right hand, Sr = 0.11, P = 0.52) were not significant.
Two chi-square comparisons, one for each hand, between the number of subjects with a right- or left-side bias and MI groups were not significant (left hand, χ
2 = 0.73,
P = 0.39; right hand, χ
2 = 0.27,
P = 0.60). In both groups, slightly more subjects bisected lines to the left than to the right of the center (
Table 1).
Turning: For the whole sample, the mean total number of turns (left plus right) was 99.2 (± 66.3). Significantly more turns were performed to the left than to the right (
Z = –2.48,
P = 0.01), and significantly more subjects demonstrated a preference for turning to the left than to the right (χ
2 = 9.0,
P = 0.003) (
Table 2).
The mean total number of turns was not different between the high MI (96.0 ± 72.5) and low MI (102.7 ± 60.5) groups (
Z = –0.56,
P = 0.59). The number of left turns was significantly higher than the number of right turns for the subjects in the high MI (
Z = –2.90,
P = 0.004) but not the low MI group (
Z = –0.85,
P = 0.39) (see Figure 1B and
Table 2). However, the two groups did not differ from each other in the number of left (
Z = –0.56,
P = 0.58) or right turns (
Z = –0.84,
P = 0.40). No relationship was found between raw MI score and the number of turns to the left (Sr = –0.02,
P = 0.93) or to the right (Sr = –0.05,
P = 0.77).
The number of subjects preferring right or left turns differed between groups (χ
2 = 4.5,
P = 0.03). In the high MI group, the number of subjects with a left turning preference was higher than in the low MI group (see
Table 2).
Veering: For the whole group, the mean total number of veers (left plus right) was 3.6 (± 2.2). The number of veers to the right did not differ significantly from the number of veers to the left (
Z = –0.53,
P = 0.60). The number of subjects veering to the left was comparable to those veering to the right (χ
2 = 1.50, df = 2,
P = 0.47) (
Table 3). With respect to the first veer, however, only three subjects walked straight ahead without any veer, and the remainder veered in almost equal numbers to the left or the right (χ
2 = 10.50, df = 2,
P = 0.005) (
Table 3).
The high and low MI groups did not differ in mean total number of veers (high MI group, 3.1 ± 2.3; and low MI group, 4.1 ± 2.0; Z = –1.44, P = 0.15) or in number of veers to one side or the other (high MI group, Z = –1.00, P = 0.32; low MI group, Z = –1.64, P = 0.10). Figure 1C shows that subjects in the high MI group deviated less to the right than those in the low MI group (Z = –2.43, P = 0.02). The difference between MI groups for veers to the left was not significant (Z = –0.29, P = 0.77). Likewise, correlation analyses confirmed that subjects deviated significantly less to the right the higher their MI scores were (Sr = –0.43, P = 0.01). By contrast, veers to the left were independent of MI scores (Sr =–0.01, P = 0.97).
The number of subjects with a left, right, or no side preference did not differ between MI groups (χ2 = 3.90, df = 2, P = 0.14). With regard to the first veer, however, subjects in the high MI group showed a preference for walking either straight or veering to the left, whereas the subjects in the low MI group had a preference for veering to the right (χ2 = 8.18, df = 2, P = 0.02).


