A substantial literature has documented a delayed P2 component of the flash visual evoked potential (VEP) in groups of patients with probable Alzheimer's dementia (AD) compared with groups of age-matched normal control subjects. Because many visual system pathologies can produce VEP component delays, the selective P2 delay is often measured relative to either the flash P1 or the pattern reversal P100. The P2 is said to be selectively delayed because both the flash P1 and the pattern reversal P100 VEP components are normal in probable AD patients. The selective P2 delay is thought to mirror the cholinergic deterioration in AD because it arises from the richly cholinergic visual association cortex, whereas the normal P1 and P100 arise from the sparsely cholinergic primary visual cortex.
1 A selective P2 delay may be produced in subjects who do not have dementia by pharmacological suppression of cholinergic functioning.
1,2Among AD patients with otherwise intact visual systems, these interpeak measures show the same delays as absolute P2 latency measures.
3,4 The selective P2 delay is not found in patient groups suffering from nondementing psychiatric disorders
5,6 or other forms of dementia,
3,4 but in AD groups it increases over time, paralleling dementia severity.
7,8 These findings show remarkable consistency across laboratories and recording techniques.
9 Several authors
5,9,10 have suggested that the flash P2 delay should be investigated as a simple and reliable diagnostic test for AD, perhaps in its earliest stages.
11 Currently the diagnostic workup for AD described by McKhann et al.,
12 a process of exclusion rather than detection, is costly, time-consuming, and cumbersome. A simple positive test for AD could add precision to the diagnostic process or, if it were correlated highly with the final clinical diagnosis, could shortcut the process.
This study addressed the question of the diagnostic utility of the selective P2 delay: To what extent is a selectively delayed flash P2 correlated with the clinical diagnosis of AD according to the McKhann criteria in individual patients?
METHOD
Indexes of sensitivity and specificity were calculated for a range of possible cutoff scores on VEP component data from retrospective samples of 45 AD patients (mean age, 73.2 years, SD = 8.69) and 60 healthy elderly control subjects (mean age, 70.7 years, SD = 8.03). All AD patients had been referred for participation in research studies conducted at the Southern Illinois University School of Medicine or at the Mercer University School of Medicine and had received thorough workups culminating in a diagnosis of probable AD according to the McKhann et al.
12 criteria. Diagnostic assessment was made before VEP testing was done. The healthy controls had been recruited at the same time and for the same research studies as the patients. Except for signs and symptoms related directly to Alzheimer's disease in the patients, patients and controls all had medical histories free of significant neurological or psychiatric difficulties and had no other health problems that were likely to affect brain activity. Both patients and controls were not taking any medications that have significant effects on the cholinergic system, including cholinesterase inhibitors. Although they were not specifically assessed, the general educational level and medical burden (except for the dementia itself) on patients and controls appeared comparable. All participants originally had enrolled in various research studies examining EEG changes in dementia, conducted either at the Southern Illinois University School of Medicine or at the Mercer University School of Medicine. After all procedures had been carefully explained to participants and, when appropriate, their caregivers, written informed consent, as approved by the institutional review boards of the respective medical schools, had been obtained from all participants or their caregivers.
For all participants, flash and pattern reversal VEP data were recorded from 20 active scalp channels of the international 10-20 system, using techniques that have been detailed elsewhere.
3 To include recordings using different physical reference electrodes, all data were converted to a “global average” virtual reference system involving all scalp electrodes.
4 Additional post hoc analyses were performed using partial average and Hjorth Laplacian reference systems. All analyses were performed blind to participant group.
Since many clinical neurodiagnostic laboratories lack the ability to perform topographic mapping or sophisticated quantitative analysis of electrophysiological data, simplified nontopographic methods were used to identify VEP components in this study. The flash P1 was identified as the maximum positivity at Pz within a 60–100 ms latency window. The flash P2 and pattern reversal P100 components were identified as the maximum positivities at Oz within 100–300 ms and 90–140 ms latency windows, respectively. Previous topographic studies
9 identified these recording sites as showing the components at their maximum amplitudes in both probable AD patients and healthy elderly controls. The P2 latency was measured as an interpeak latency relative to the P1 or P100.
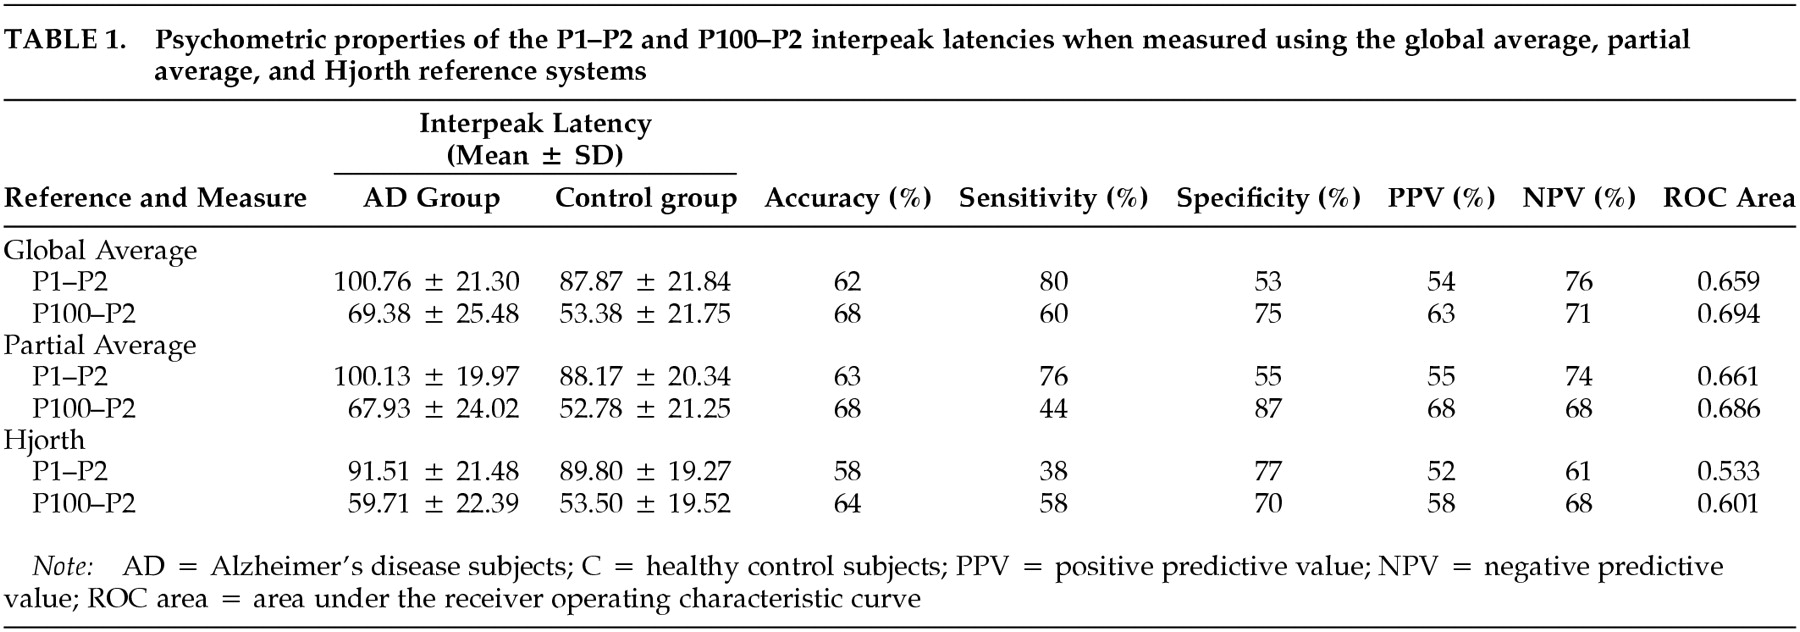
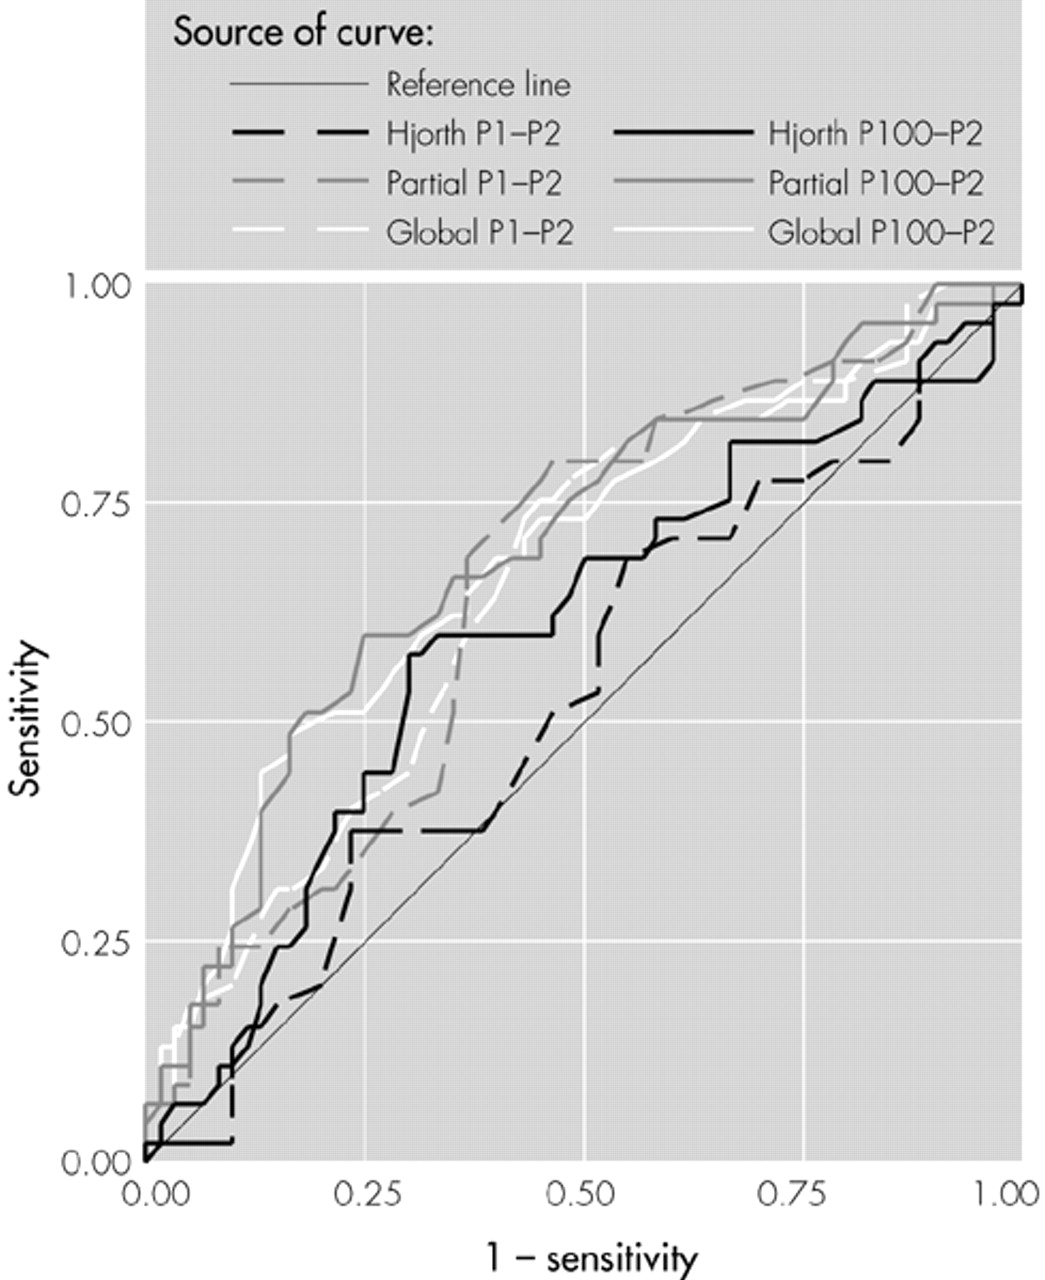
Measures of sensitivity (proportion of patients correctly identified) and specificity (proportion of controls correctly identified) were calculated for each interpeak latency and reference system. Assuming that both psychometric properties are of equal value in clinical diagnosis, the latency was identified at which the sum of sensitivity and specificity was maximal. At that latency the overall proportion of correct classifications was computed as an “accuracy” measure. Positive and negative predictive values also were calculated, as was the area under each ROC curve. ROC areas provide an overall estimate of the diagnostic accuracy of each dependent variable, complementing the point measures of accuracy computed from sensitivity and specificity.
A multivariate analysis of covariance (MANCOVA) was conducted to determine whether probable AD patients exhibit a selective P2 delay relative to healthy elderly controls. Age was used as a covariate, and the selective P2 delays associated with the global and partial average reference systems and the Hjorth reference system were treated as dependent measures. The family-wise error rate (FWa) associated with the MANCOVA was 0.05. Separate ANCOVAs were used as follow-up tests. All statistical tests were two-tailed.
RESULTS
The primary analysis used global average referenced data (
Table 1;
Figure 1). Compared with the control group, the probable AD group exhibited a significant delay in the P2 component, whether measured as interpeak latencies from the P1 (
F = 6.22, df = 1, 102,
P<0.05) or from the P100 (
F = 10.04, df = 1, 102,
P<0.05), thereby replicating the P2 delays commonly reported in this disorder. Measures of treatment effect, eta-squared, for the P1–P2 and P100–P2 interpeak latencies were 0.06 and 0.09, respectively. However, the classification accuracies for the P1–P2 (accuracy 62%, sensitivity 80%, specificity 53%) and for the P100–P2 (accuracy 68%, sensitivity 60%, specificity 75%) were too low to add meaningful information to the McKhann diagnostic process or to substitute for the complete diagnostic workup.
One possible reason for the low diagnostic accuracy of the global average referenced VEP data might be a contamination of the reference by electro-oculogram (EOG) artifacts that were of low enough amplitude to avoid the automatic EOG rejection algorithm during data acquisition.
13In the next part of the study, VEP data were transformed to a “partial average” virtual reference system omitting Fp1, Fpz, and Fp2 electrodes to minimize any possible EOG distortions. The partial average reference again demonstrated a significant delay in the P2 component among the AD group (
Table 1;
Figure 1), whether measured as interpeak latencies from the P1 (
F = 6.30, df = 1,102,
P<0.05) or from the P100 (
F = 9.03, df = 1,102,
P<0.05), replicating the between-group differences found above. Eta-squared for the P1–P2 and P100–P2 interpeak latencies were 0.06 and 0.08, respectively. Although the two groups clearly differed on average, there was considerable overlap, and the classification accuracies for the P1–P2 (accuracy 63%, sensitivity 76%, specificity 55%) and for the P100–P2 (accuracy 68%, sensitivity 44%, specificity 87%) again were too low to add meaningful information to the McKhann diagnostic process or to serve as a shortcut for the clinical workup.
Another possible reason for the low diagnostic accuracy of the global average and partial average referenced VEP data could be that the waveforms recorded at one or more of the electrodes represent a mixture of activity from several closely adjacent areas. Activity that is time-locked to the visual stimulus but unaffected by AD would constitute “noise” in the present context, thereby degrading any AD-specific signal. Although the topographic distributions of the pattern reversal P100 component generated by primary visual cortex and the flash P2 component generated by visual association cortex differ, both show maximal amplitudes at Oz. To assess the relative contributions of the AD-specific signal and nonspecific noise at Oz, VEP data were transformed to a Hjorth Laplacian reference system emphasizing locally generated components with high spatial frequencies.
The Hjorth reference (
Table 1;
Figure 1) showed nonsignificant P2 component delays in the AD group, whether measured as interpeak latencies from the P1 (
F = 0.01, df = 1, 102,
P>0.05) or from the P100 (
F = 1.42, df = 1, 102,
P>0.05). Eta-squared values for the P1–P2 and P100–P2 interpeak latencies were 0.00 and 0.01, respectively. AD and control groups showed virtually complete overlap, and the classification accuracies for the P1–P2 (accuracy 58%, sensitivity 38%, specificity 77%) and for the P100–P2 (accuracy 64%, sensitivity 58%, specificity 78%) were unimpressive.
It appears that the locally generated VEP activity recorded at Oz (to the extent that this is accentuated by the Hjorth reference) is unaffected by the AD process and that the very significant between-group differences found using other reference systems represents activity deriving from the visual association areas surrounding Oz. However, this interpretation is speculative, since inspection of Hjorth-referenced waveforms recorded from the international 10-20 system electrode sites surrounding Oz also showed no evidence of delayed P2 components among AD participants. This suggests that the spatial sampling of the cortex by the 20-electrode array is too coarse to resolve affected areas and that higher-density arrays will be necessary if the advantages of the Hjorth system are to be exploited.
DISCUSSION
The purpose of this study was to examine the selective delay of the flash P2 component in AD patients using simple stimulation, recording, and analysis methods available in most clinical electroneurodiagnostic laboratories and to ascertain whether the P2 delay contained diagnostically relevant information about individual patients. The between-group differences obtained using global and partial average reference systems in this study (as well as a variety of other reference systems used by others) suggest that an AD-specific signal containing potentially pathognomonic information is contained within VEP data. However, the modest classification accuracies found in this study show that present methods do not adequately capture that information. In terms of clinical utility, measurement of the flash P2 latency using standard methods does not appear to add meaningful information to the McKhann diagnostic process and does not offer a useful shortcut of the complete diagnostic workup.
Future research should refine the methods currently being used. This may include a refinement of the visual stimulus to accentuate the flash P2 signal or the use of a higher-density electrode array. The increased spatial resolution offered by the latter may allow for a differentiation of an AD-specific signal. Finally, alternative analytic methods
14,15 may better separate AD patients from healthy controls,
16 with the limitation that these methods should be appropriate for the facilities found in most electroneurodiagnostic laboratories. A follow-up study examining these possibilities is in progress.
ACKNOWLEDGMENTS
Portions of these results were presented at the Eighth World Congress of the International Society for Brain Electromagnetic Topography, Zurich, March 6–8, 1997. This work was supported in part by grants from the Medical Center of Central Georgia.