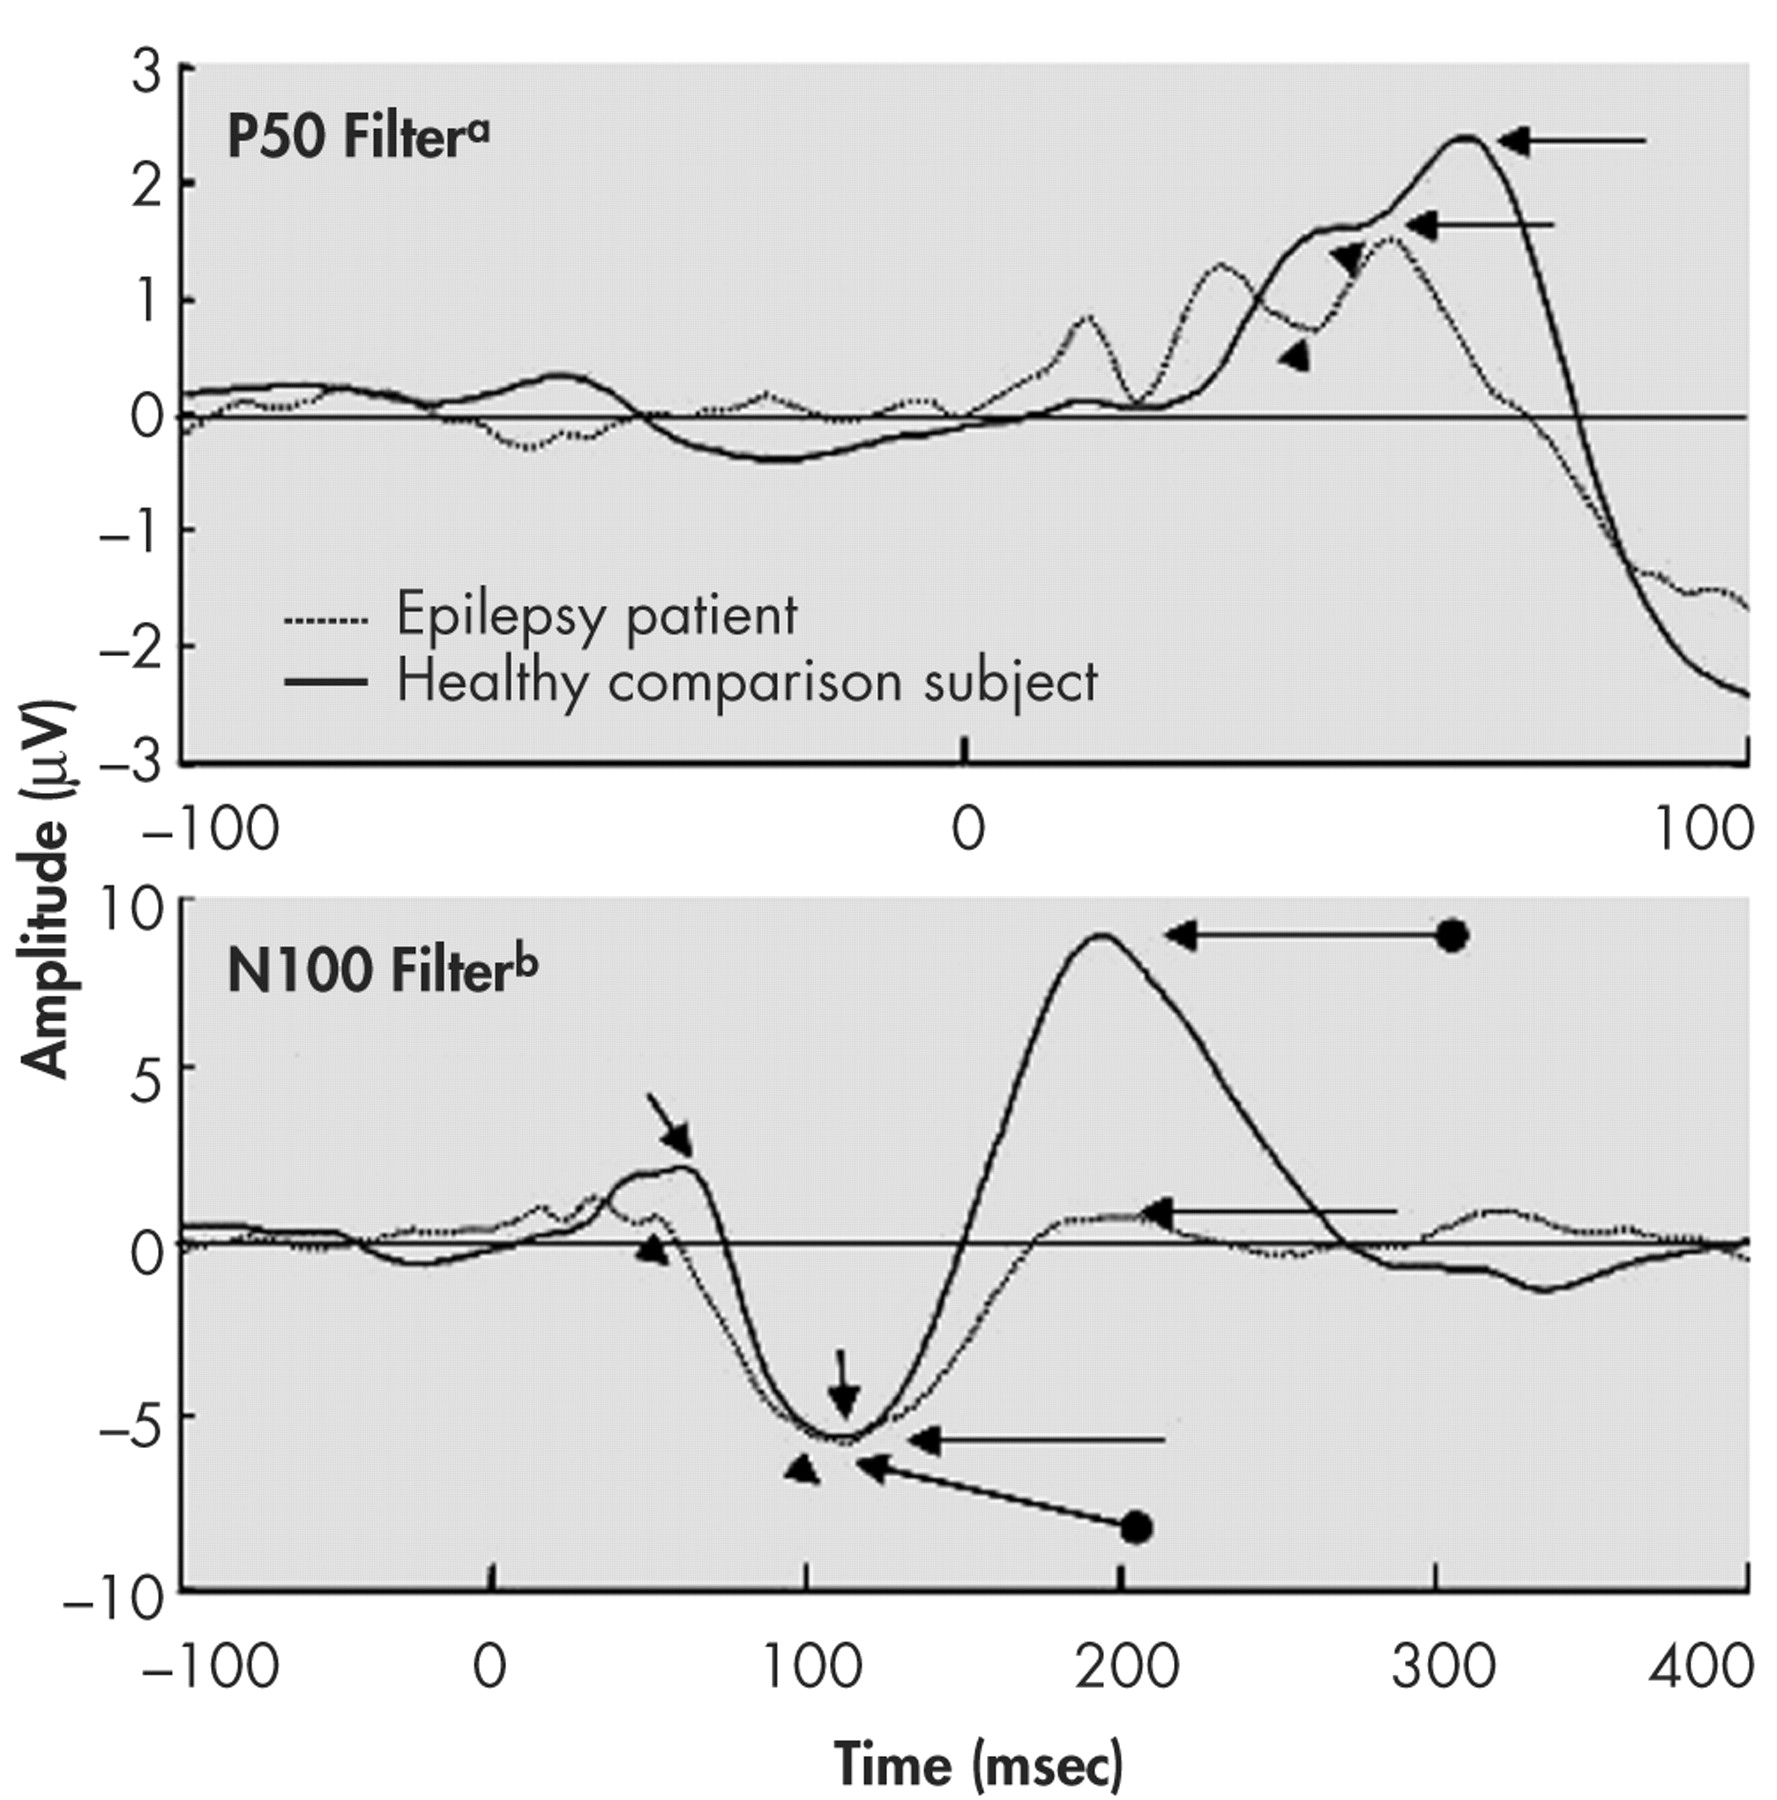
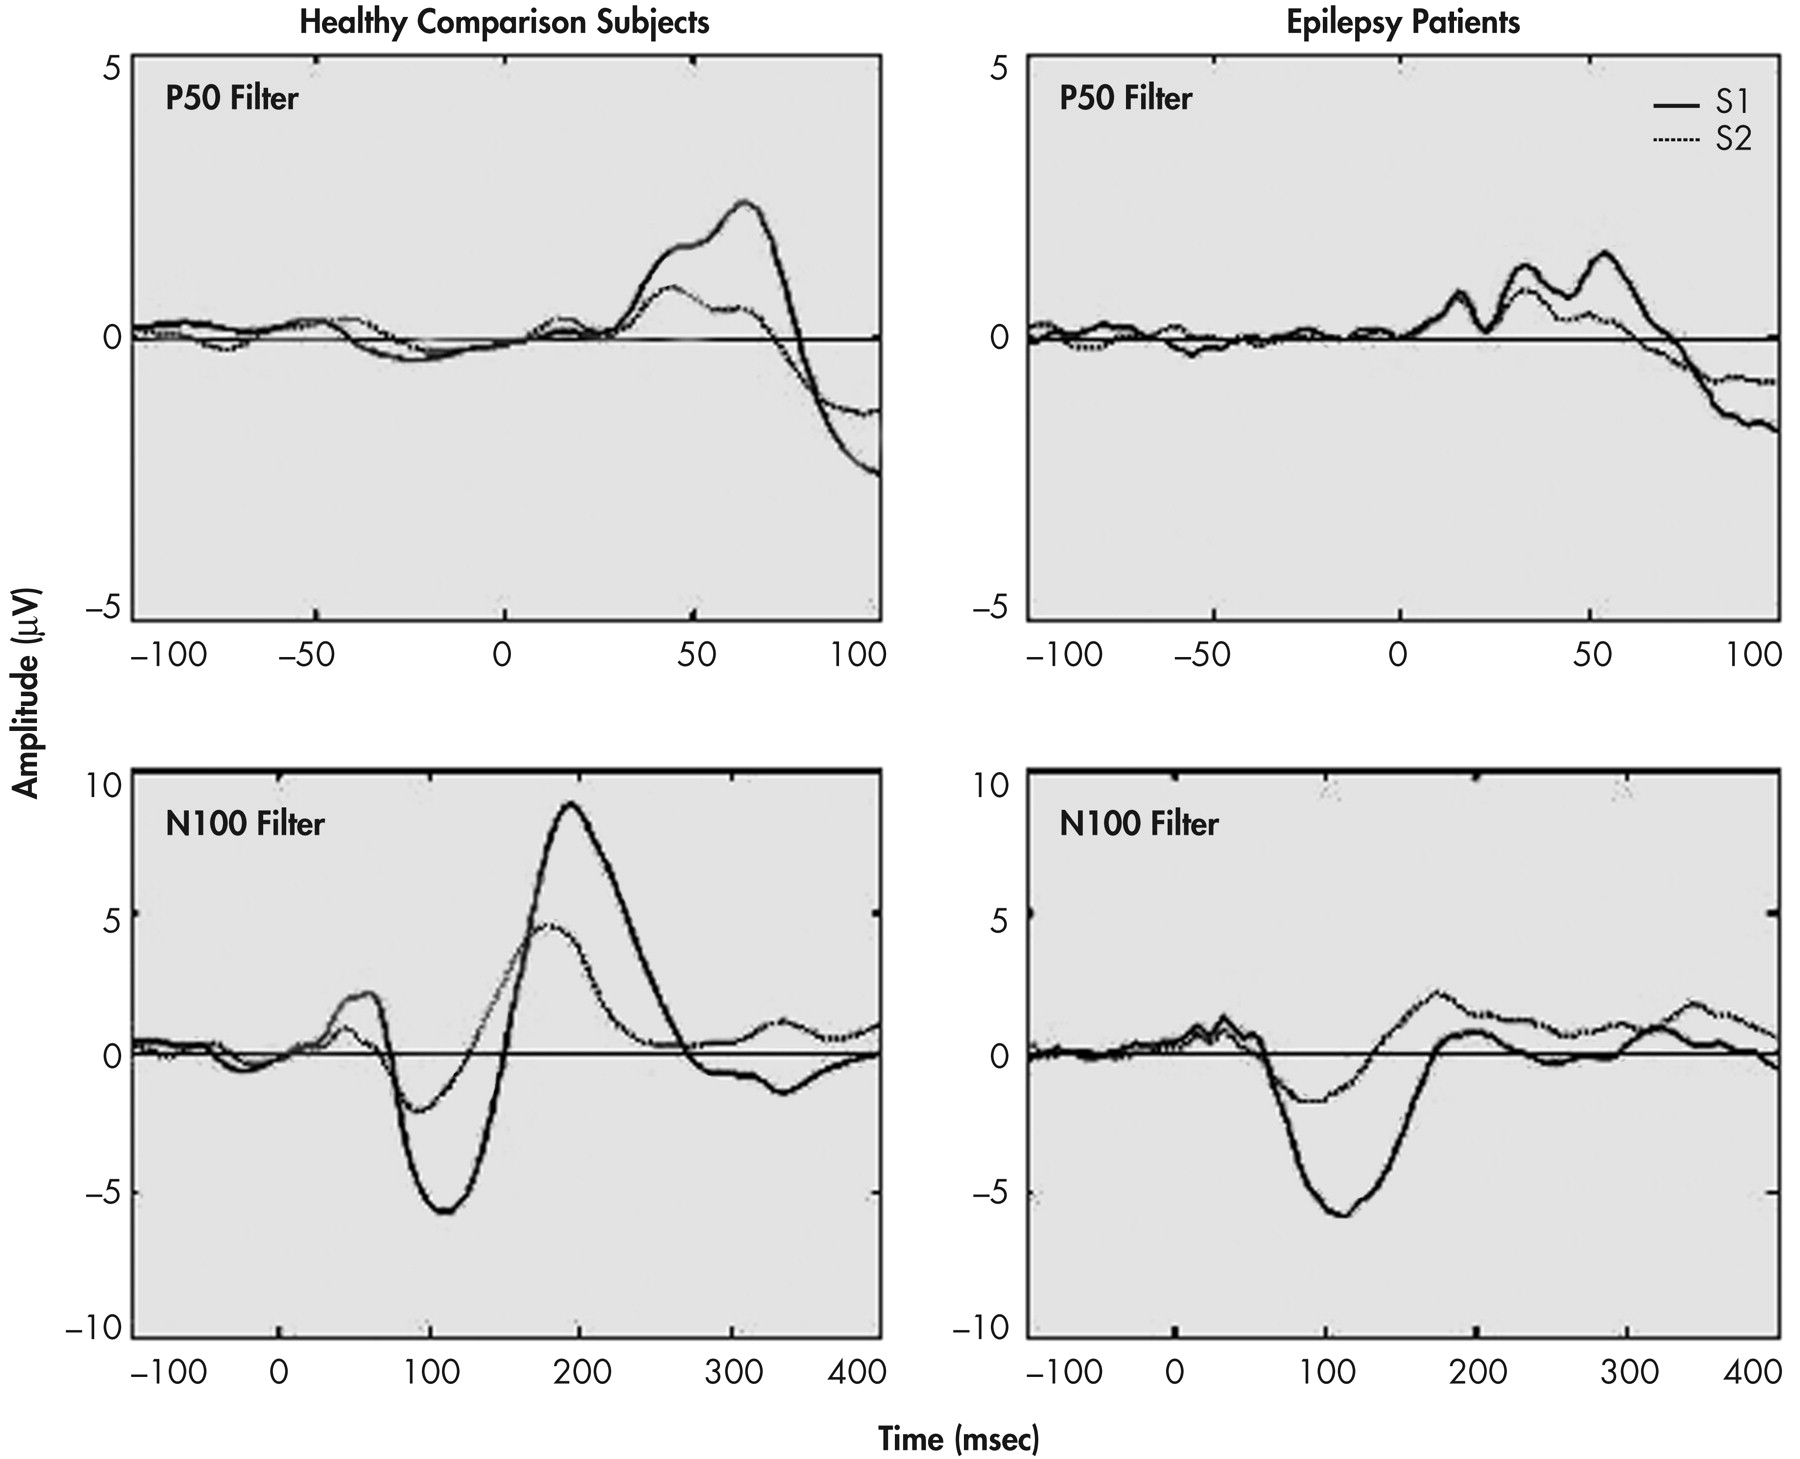
Buchsbaum used the term “middle evoked response components” to describe three main auditory evoked potentials components: a positive, negative, positive sequence occurring at 40–80 (P50), 75–150 (N100), and 150–250 (P200) msec.
4 Subsequently, Roth and Horvath
5 used the term “mid-latency” to describe evoked potential components occurring between 50 and 200 msec. These components characteristically decrease in amplitude with faster repetitions.
6 The P50 component is hardly affected by attentional factors and therefore may reflect a pre-attentive stage of information processing.
7,
8 The N100 and the P200 have been associated with later (attentive) stages of information processing.
9 Abnormalities of these components have been repeatedly demonstrated in schizophrenia patients.
2,
10 The most consistently reported abnormality of these components is amplitude reduction of the P50 and N100, and less consistently, the P200.
11 Though the P50 has also been reported to decrease in amplitude in epileptic patients,
12,
13 the N100 amplitude was reported not to be affected in this population.
2 To our knowledge, the P200 has not been examined in this population. Examination of these mid-latency auditory evoked responses may thus be helpful in further identifying similar or divergent mechanisms at play in these two disorders.
Sensory gating deficiency has been identified as a possible endophenotype for psychosis.
14 The decrease in response magnitude with repetitive sensory input is an essential function of the central nervous system and has been demonstrated in studies on humans and animals.
6,
15 Deficits of this function could lead to impairments of the brain’s capacity to select, process, and store information,
16 and have been associated with the development of severe behavioral aberration.
17 In humans, the response decrease by repetitive stimulation (also termed sensory gating) has been examined extensively for the P50. A deficient response decrease of the P50 has been reported mainly for patients with schizophrenia,
17 but also for other neuropsychiatric diseases, such as posttraumatic stress disorder (PTSD).
18 Sensory gating is yet to be examined in epileptic populations. While most of the investigations of sensory gating in schizophrenia have focused on the P50 mid-latency auditory-evoked response component, we have recently shown that the abnormality extends to N100 and P200.
10In the current preliminary study we sought to examine the amplitudes, latencies, and sensory gating indices derived from the three major mid-latency auditory-evoked response components in a group of patients with epilepsy with focal seizures (mostly of temporal lobe origin) in order to ascertain whether sensory gating deficit is observable in this group, and if an observed gating deficit parallels the deficit observed in schizophrenia patients.
METHOD
We included 29 patients (16 men and 13 women, from 19 to 59 years old with a mean of 38.3 years) with focal epilepsy. Of the 29 patients, 17 had temporal lobe epilepsy (11 left, 5 right, and one bilateral). Seven subjects had frontal lobe lesions (three left- and four right-sided). The five remaining subjects were either multifocal or had lesions outside the frontal or temporal lobes (e.g., occipital). The 29 subjects were selected from 39 subjects who had scalp-recorded evoked potentials. Selected records had all three identifiable target components (P50, N100, and P200). The data were collected as part of a larger study to ascertain the anatomical substrates of sensory gating.
19 Patients were being evaluated for resective surgery (on an inpatient basis). The diagnosis of epilepsy was made based on extensive simultaneous EEG/video recordings. All patients were taking antiepileptic medication, and three were taking atypical antipsychotic agents at the time of recording (none was taking clozapin). Other psychiatric problems included history of depression (four), posttraumatic stress disorder (two), a history of panic and depressive disorder (one), and an additional subject with a history of psychotic episodes but who was not psychotic or medicated at the time of recording. No other psychotropic medications were being administered. All mid-latency auditory-evoked response recordings were obtained prior to any invasive procedures.
Twenty-nine healthy comparison subjects were selected from among a larger sample of already collected evoked potentials of healthy comparison subjects recorded at the electrophysiology laboratory at Yale University. Comparison subjects were selected first based on age and then on gender for matching to subjects in the epilepsy group (16 men and 13 women). All subjects signed a consent form approved by the Institutional Review Board committees of the University of Bonn, Germany (epileptic patients), Yale University for healthy comparison subjects (location of the laboratory at time of data collection).
Epileptic patients were administered the Structured Clinical Interview for DSM-IV (SCID). Additional clinical data were obtained from the medical records. We first screened comparison subjects by phone to assure the absence of any psychiatric or neurological disorders, being on any psychoactive medications, history of head injury (leading to any period of loss of consciousness), and any history of drug abuse. Individuals meeting criteria were invited to the laboratory for a SCID-interview as well as a urine test for drugs of abuse. Urine drug screens are not routinely obtained as part of the initial admission workup for epilepsy patients unless there is a history of drug use. None of the patients included in this sample gave such history.
The inhibitory capacity of the brain was measured using identical pairs of brief tones. For the healthy comparison group, the stimuli were brief tones (1000Hz) of 4 msec duration and 1 msec rise and fall time, and 90 dbSPL as measured at the ear using a measure-and-hold digital sound meter (Tandy Corp). In paired stimulus paradigms, 2 identical stimuli are presented binaurally with a 500 msec interstimulus interval (ISI).
20 The pairs are repeated every 8 seconds.
21 One hundred pairs of stimuli are presented to assure the availability of 60 artifact-free trials. Responses to the first stimulus (S1) and the second stimulus (S2) are averaged separately.
For epileptic patients (recorded in Bonn, Germany), the EEG was recorded with the digital EPAS system (Schwarzer, Munich, Germany) and its implemented Harmonie EEG software (Stellate Systems, Quebec). The EEG was measured against a reference of left and right mastoid electrodes with a sampling rate of 1000 Hz. Patients were seated on a comfortable chair in a quiet room illuminated by bright light. The stimuli used were short tone bursts of a single sine wave with 1500 Hz frequency and a duration of 6.6 msec (including rise and fall times of 1.5 msec) presented by headphones. A set of 100 pairs of stimuli was administered (minimum of 60 artifact-free needed for averaging) with an ISI of 0.5 seconds and an interpair interval of 8 seconds. Tones were presented at 60dbSPL.
Healthy comparison subjects (recorded at West-Haven VA-Medical Center) were allowed to smoke up to arrival at the laboratory. Recordings were made from silver/silver chloride disk electrodes applied at the Fz, Cz, Pz, Oz, F7, F8, T3, T4, P5, and P6 locations and referred to linked ears. For both groups, P50, N100, and P200 measurements were made from the Cz electrode for consistency with the literature. The Oz electrode was used for monitoring levels of alertness (by monitoring alpha/theta activity). Other midline electrodes were used to verify the evoked potential components. One channel was devoted to detecting eye movement artifacts recorded from a supraorbital electrode to the outer canthus. Online EEG artifact rejection allowed for trial rejection when activity in any channel exceeded 75 symbol 109 /f “Symbol” /s 12mV (Neuroscan Software, Herndon, VA). Band-pass filters (0.05 and 300 Hz) were used and data were digitized at 1000 Hz for online averaging. EEG recording started 100 msec prior to stimulation and extended to 400 msec after stimulation.
In order to increase the signal to noise ratio, we refiltered the EEG data between 10 and 50 Hz when examining the P50 component.
7 This procedure is useful as the main frequency content of the P50 component is expected in this frequency range.
22 A 1–30 Hz band-pass was used to examine N100 and P200 components. Only data from midline electrodes are reported in this article. Figures 1 and 2 provide the grand averages resulting from the two sets of filters.
Amplitudes of the three components were measured from peak to the preceding peak of positivity or negativity,
23 as well as from the component’s peak to a 100 msec prestimulus baseline. Criteria for identification of the N100 component were: a) the largest negative peak between 75 and 150 msec post-stimulation (which has to be distinct from ongoing baseline fluctuations), and b) the component was seen clearly in more than one recorded channel. The P50 was identified as the largest positivity within the latency range of 35–85 msec, and the P200 was identified as the largest positivity following the N100 (within the latency range of 150–250 msec).
All averages were printed without identifying information. Three copies of all averages were then evaluated blindly by three investigators (Dr. Boutros, Dr. Burroughs, and Dr. Korzyukov). Each evaluator marked the P50, N100, and P200 peaks. Following the independent evaluations, a consensus session was held and all three evaluators were able to reach 100% agreement on the detected components.
Statistical Analysis
Peak latencies were measured from stimulus onset to peak of component. Amplitudes were measured from peak to preceding peak (for consistency with sensory gating literature), as well as from peak to baseline. The patients and healthy comparison subjects were compared on P50, N100, and P200 components for amplitudes, latencies, and sensory gating measures derived from each component. Two sensory gating measures were computed for each component. The ratio measure was calculated by dividing the amplitude of the S2 response by the amplitude of the S1 response (i.e., S2/S1). Smaller ratios indicate better gating . The difference measure was calculated by subtracting the amplitude of the S2 response from that of the S1 response (i.e., S1-S2). Larger differences indicate better gating . Analyses were performed based on both peak-to-peak as well as baseline-to-peak measurements. The first series of analyses performed were 2 (patients versus healthy comparison subjects) x 2 (gender: men versus women) between-subjects ANOVAs on amplitudes, latencies, and gating measures. The next set of analyses of variance (ANOVAs) was performed to examine differences related to sensory gating measures.


