R ecent neuroscience research has provided great insights into the mechanisms of antidepressants. Most antidepressants seem to work by inhibiting uptake of the monoamines—serotonin (5-HT), norepinephrine, and/or dopamine—thereby increasing their synaptic availability. However, the neurophysiological correlates of these neurochemical effects on the brain’s mood regulating circuit
1 are not well understood.
2 Functional MRI (fMRI) and positron emission tomography (PET) studies have reported decreased function of the cortical mood regulating regions, such as the ventral anterior cingulate cortex (vACC)
3 –
5 and increased limbic (in particular amygdala) metabolism and activation in depression.
4,
6 –
9 In light of the reciprocal relationship between cortical and limbic function in depression, it has been proposed that corticolimbic connectivity abnormalities may be present in depression, and recent reports of corticolimbic functional connectivity in depression lend support to this hypothesis.
2,
10Brain imaging studies have shown that antidepressant treatment may reverse the pattern of activation and connectivity abnormalities seen in depression. Antidepressants have been shown to decrease limbic activation in response to negative stimuli and to increase corticolimbic connectivity.
2,
8,
11 –
13 These findings have led to the hypothesis that antidepressants may restore the integrity of the corticolimbic mood regulating circuit,
14 and thereby restore the synchronous functioning between the cortical-mood-regulating and limbic-mood-generating regions.
2,
11 To validate this hypothesis, the effects of antidepressants on corticolimbic connectivity and regional activation need to be measured concurrently.
Functional connectivity, defined as the temporal correlation between spatially remote brain events,
15 is frequently investigated by correlating task-related regional activation, and several studies have reported important findings using this method.
16 –
20 However, if two regions are highly activated by a task, they will inevitably be seen to be coactive and hence viewed as functionally connected.
21 Therefore, to investigate the differential effects of antidepressant treatment on connectivity and regional activation, a connectivity-specific, task-independent measure may be more useful.
Steady state (resting state) measurement of coherence in electroencephalogram (EEG) data and PET regional metabolism data has been used as such a connectivity-specific, task-independent measure.
2,
22,
23 Functional connectivity between brain areas can also be investigated using a more recently used connectivity-specific fMRI measure—correlation of steady (resting) state low-frequency (<0.08 Hz) blood oxygen level-dependent (BOLD) weighted fluctuations (LFBFs) in echoplanar imaging data. It has been recognized that these LFBFs (<0.08 Hz) are not caused by instrumentation or physiological effects (e.g., cardiac and respiratory cycles) originating outside of the brain.
24 It has also been shown that these resting state signal changes reflect alterations in blood flow and oxygenation that may be coupled to neuronal activity, and that LFBFs correlate between brain areas of plausible functional connectivity.
25 –
35 Published studies of connectivity abnormalities using the LFBF correlation method have been reported in neuropsychiatric conditions, such as multiple sclerosis, Alzheimer’s disease, and substance abuse.
36 –
39We previously reported the results of an fMRI experiment in which we measured corticolimbic connectivity using the resting state LFBF correlations method and regional limbic activation, in response to negative versus neutral stimuli in unmedicated depressed patients and healthy subjects.
10 We also previously reported the effect of antidepressant (sertraline) treatment on corticolimbic connectivity as measured with LFBF correlations.
11 The results of these studies indicated that resting state functional connectivity between the pregenual anterior cingulate cortex (ACC) and the limbic regions—amygdala, pallidostriatum, and medial thalamus—decreases in depression and that antidepressant treatment reverses this abnormality.
10,
11 It was also reported that at baseline, limbic activation was greater in depressed patients compared with healthy subjects.
10 However, the effect of antidepressants on both regional activation and connectivity has not been previously reported. In this study, we report the results of the fMRI experiment pertaining to the effect of antidepressant treatment on regional limbic activation in response to negative versus neutral pictures, and the relationship between the change in resting state connectivity and regional limbic activation. We hypothesized that antidepressant treatment would lead to increased connectivity between the pregenual ACC and the limbic regions, such as the amygdala, which will be associated with decreased limbic activation in response to a negative emotional task.
METHOD
We recruited medication-free unipolar depressed outpatients from the outpatient clinic at University Hospital, Indiana University School of Medicine, and by advertisements from the community. Healthy subjects were recruited via advertisements and selected to match the age and gender distribution of the patient group. All subjects took part after signing an informed consent form approved by the Investigational Review Board (IRB) at Indiana University School of Medicine. Both patients and healthy subjects were paid $50 for screening and $50 for each MRI scan.
Inclusion criteria for depressed subjects were: being between the ages of 18 and 60 years and ability to give voluntary informed consent; ability to satisfy Diagnostic and Statistical Manual–IV (DSM-IV) criteria for major depressive episode; a 25-item Hamilton Depression Rating Scale (HAM-D) score>18; the criteria to undergo an MRI scan based on an MRI screening questionnaire; and ability to be managed as outpatients.
Exclusion criteria for depressed patients were: meeting DSM-IV criteria for schizophrenia, schizoaffective disorder, bipolar disorder, or an anxiety disorder as a primary diagnosis; use of psychotropics in the past 2 weeks; using fluoxetine in the past 4 weeks; being acutely suicidal or homicidal or requiring inpatient treatment; meeting DSM-IV criteria for substance dependence within the past year, except for caffeine or nicotine; positive urinary toxicology screening at baseline; using alcohol in the past week; serious medical or neurological illness; current pregnancy or breast feeding; metallic implants or other contraindications to MRI.
Inclusion criteria for healthy subjects were: ages 18 to 60 years and ability to give voluntary informed consent; no history of psychiatric illness or substance abuse or dependence; no significant family history of psychiatric or neurological illness; not currently taking any prescription or centrally acting medications; no use of alcohol in the past week; and no serious medical or neurological illness.
Exclusion criteria for healthy subjects were: under 18 years of age; pregnant or breast-feeding; metallic implants or other contraindications to MRI.
Antidepressant Treatment
Patients were started on a regimen of sertraline treatment, 50 mg q.d. orally, on the day they completed the baseline scan. This dosage was increased to 100 mg after 1 week. After the first two weekly visits, sertraline was increased by 50 mg every 2 weeks to a maximum of 200 mg, depending on the patient’s response and tolerance.
Behavioral Ratings
Subjects were rated on a 25-item HAM-D
40 at the time of the baseline scan and at 2 weekly intervals until they finished 6 weeks of the study.
Visual Pictures for Activation Scan
We selected pictures from the International Affective Picture System (IAPS),
41 which is a large set of standardized, emotionally evocative, internationally accessible color photographs. The IAPS pictures are rated on two primary dimensions—affective valence and arousal. Each picture is rated on a 9-point scale such that 9 represents a high rating on each dimension (high pleasure, high arousal) and 1 represents a low rating (low pleasure, low arousal). For the purpose of this study, we included ratings applicable to both genders, negative pictures of valence 2 to 3, arousal scores <6, neutral pictures of valence 4.5 to 5.5, and arousal scores <3. Different picture sets were given for baseline and after treatment fMRI activation scans.
fMRI Scan
Scans were performed in either the morning or early afternoon. Image data were acquired using a General Electric (Waukesha, Wisc.) 1.5 T MRI scanner. Subjects were placed in a birdcage head coil and individually fitted to a bite bar partially composed of a dental impression compound attached to the coil to reduce head motion. For the activation scan, visual stimuli for all tasks were computer generated and presented using MRI compatible binocular fiberoptic goggles (Avotec Inc., Jensen Beach, Fla.). Before the scan, we instructed subjects to just look at the pictures and let the feelings elicited by the pictures flow and not try to suppress the feelings elicited by the pictures. Subjects passively viewed the pictures and were not asked to rate the pictures or perform any other cognitive task, as cognitive activity has been shown to inhibit activation of the limbic system, particularly amygdala activation.
42,
43 For the resting state connectivity scan, we asked the subjects to keep their eyes closed, stay awake, and not think of anything in particular. Subjects were interviewed at the end of the scan to make sure that they had followed the instructions.
The fMRI sequence was as follows:
1.
3D spoiled gradient recalled echo (SPGR) whole brain axial T1
2.
Anatomic scan: T1-weighted axial images: TR/TE 500/12 msec; 16 slices; thickness/gap 7.0/2.0 mm; matrix 256×128; FOV 24×24 cm; 1 NEX.
3.
fMRI activation scan: gradient echo EPI functional scans: TR/TE 2000/50 ms; same slices, locations, thickness, and gap as scan 2; matrix 64×64; FOV 24×24 cm; flip 90°; bandwidth +/− 62.5 kHz; 166 repetitions; scan time: 5 minutes and 32 seconds.
4.
fMRI connectivity scan: gradient echo 2D EPI scans: TR/TE 400/50 ms; thickness=7 mm, with the gap adjusted to acquire desired slices; matrix 64×64; FOV 24×24 cm; flip 30°; bandwidth (SD=62.5) kHz; 512 repetitions; scan time: 5 minutes and 7 seconds. The short TR limits the number of slices that can be acquired, so four noncontiguous axial slices covered the areas of interest at the level of ACC, medial thalamus/pallidostriatum and amygdala identified by trained radiology staff (Y.W.). Slices for before and after treatment scans were chosen as close to each other as possible.
Visual Stimulus
The following sequence was created using E-prime software for paradigm design for presentation of pictorial stimuli:
•
Activation scan: Negative versus neutral pictures: alternate blocks of four neutral and four negative pictures. Three blocks of neutral and two blocks of negative pictures were presented. Each block was presented for 1 minute and each picture was shown for 15 seconds
•
Connectivity scan: Resting state, awake with eyes closed with no task performance
Image analysis
The raw image data were Hamming-filtered to improve signal-to-noise ratio with minimal reduction in spatial resolution.
44Selection of Regions of Interest
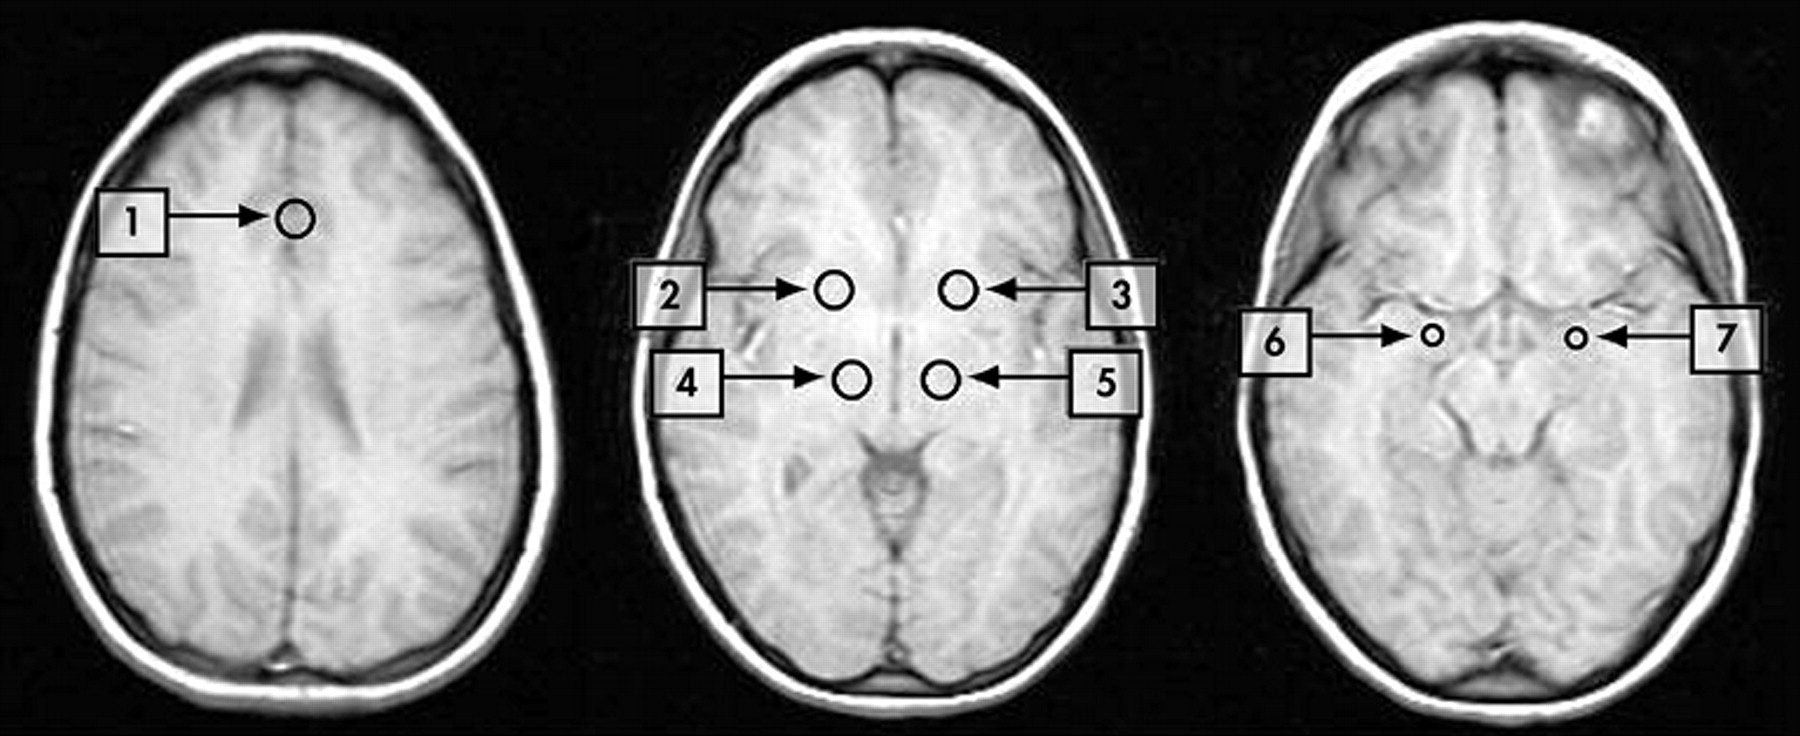
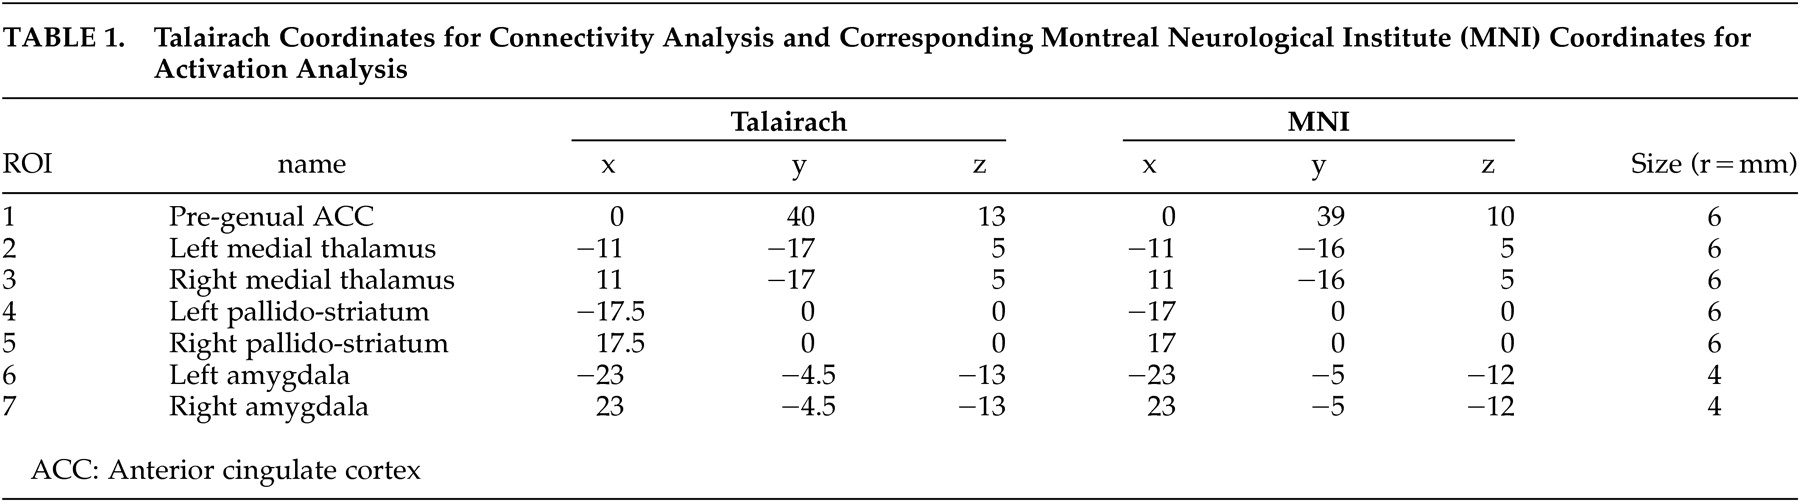
Regions of interest (ROIs) were placed by trained radiology staff (Y.W.) corresponding to the a priori-defined areas of the mood regulating circuit (
Figure 1 ). For cortical regions, we chose the pregenual ACC as the ROI, as a number of neurological studies have indicated that it is involved in regulation of emotions.
45 –
48 The anterior cingulate cortex ROI was delineated in the region of pregenual ACC
46 (subregion of Brodmann area 24). Activity in this area has been shown to accompany reward-based emotional/motivational processing
46 and this area is thought to be important in emotional regulation.
45 Pallidostriatum ROI was defined as reported by Burruss et al.
49 and partially covered putamen and lateral palladium. Medial thalamus ROI was centered in the dorsal-posterior part of the thalamus. Using the “draw dataset” function in AFNI, regions of interest were defined as fixed-size circles with a radius of 6 mm for the ACC, medial thalamus and pallidostriatum and 4 mm for the amygdala. The center coordinates for each ROI are presented in
Table 1 .
Relationship of Regions of Interest for Activation and Connectivity
To ascertain the relationship between these two measures, we extracted activation data from ROIs with the coordinates derived from the connectivity analysis. As the connectivity scan for each patient consisted of four noncontiguous slices, the ROI mask of average coordinates used for the ROIs was applied to the activation scan for each of the subjects to extract the activation data.
1. Activation fMRI data analysis: We performed fMRI data analysis as previously described using Statistical Parametric Mapping 1999 (SPM 99) image analysis software (Wellcome Department of Cognitive Neurology).
10 Briefly, each time series was realigned, motion and slice timing corrected, spatially normalized to MNI space, and smoothed (8 mm full width half maximum [FWHM]). Percent signal change, with an 8-second delay correction, was calculated for each ROI. For negative versus neutral pictures, the percent signal change for each block of pictures was calculated as ([average signal of all voxels within the region on exposure to negative pictures – average signal of all voxels within the region on exposure to neutral pictures]/average signal of all voxels within the region on exposure to neutral pictures) × 100.
2. LFBF correlation analysis: We performed LFBF correction analysis as previously described.
10 Briefly, averaged data from all of the voxels within each ROI (as defined above) was detrended for global signal drifts using methods previously described
50 and then passed through a finite-impulse response (FIR) filter to remove all frequencies above 0.08 Hz. This removes the oxygenation fluctuations from physiological processes, such as direct sampling of respiratory and cardiac-related oxygenation fluctuations.
26,
27 Next, we calculated the correlation coefficient between the averaged LFBF time series of each ROI as a reference region with the averaged time-series of each of the other ROIs across all time points (512 in all).
27 The correlation coefficient was then transformed to a t statistic
10,
27 to enable a comparison between groups. We calculated the t-score of the correlation of LFBF between two ROIs for each of the time series acquired during resting for the depressed patients and healthy groups. LFBF correlations between pregenual ACC and the limbic regions—amygdala, pallidostriatum and medial thalamus—were used a measure of connectivity between these regions before and after treatment.
Statistical Analysis
For treatment effects on activation (percent signal change) and connectivity (LFBF correlation t-score), we performed a group (depressed patients versus healthy subjects) by time (baseline versus second scan at 6 weeks) repeated measures analysis of variance(ANOVA).
Spearman’s correlations were calculated between the change after treatment in connectivity of the anterior cingulate cortex ROI with each of the limbic ROIs and the change in activation of each of the limbic ROIs to look at the relationship between changes in limbic activation and changes in corticolimbic connectivity.
RESULTS
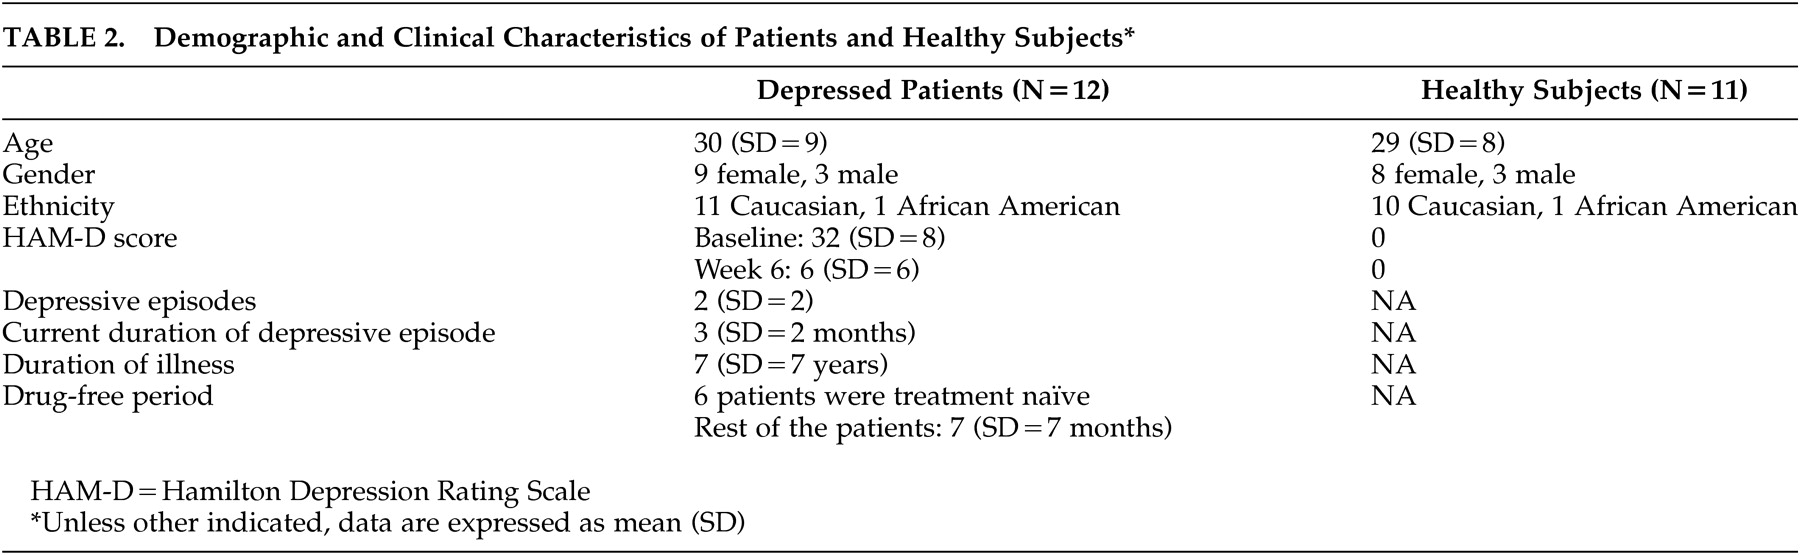
Fourteen depressed patients and 11 healthy subjects completed baseline and repeat fMRI scans. Data from one patient were excluded due to technical difficulties in the connectivity portion of the second scan. One patient’s data were excluded as, unlike other subjects, she had a strong history of recent multiple substance abuse. However, because of the use of different substances, she did not meet criteria for dependence on any one of them. Data for 12 patients and 11 healthy subjects, and subject characteristics are presented in
Table 2 . Patients had a good response to treatment with 10 out of 12 patients having more than a 50% decrease in HAM-D scores after treatment.
Baseline differences and treatment effect on resting state corticolimbic connectivity have been reported previously.
10,
11 Briefly, depressed patients showed increased limbic activation and decreased resting state corticolimbic connectivity compared with healthy subjects.
10 After treatment, depressed patients had an increase in resting state functional connectivity compared with healthy subjects.
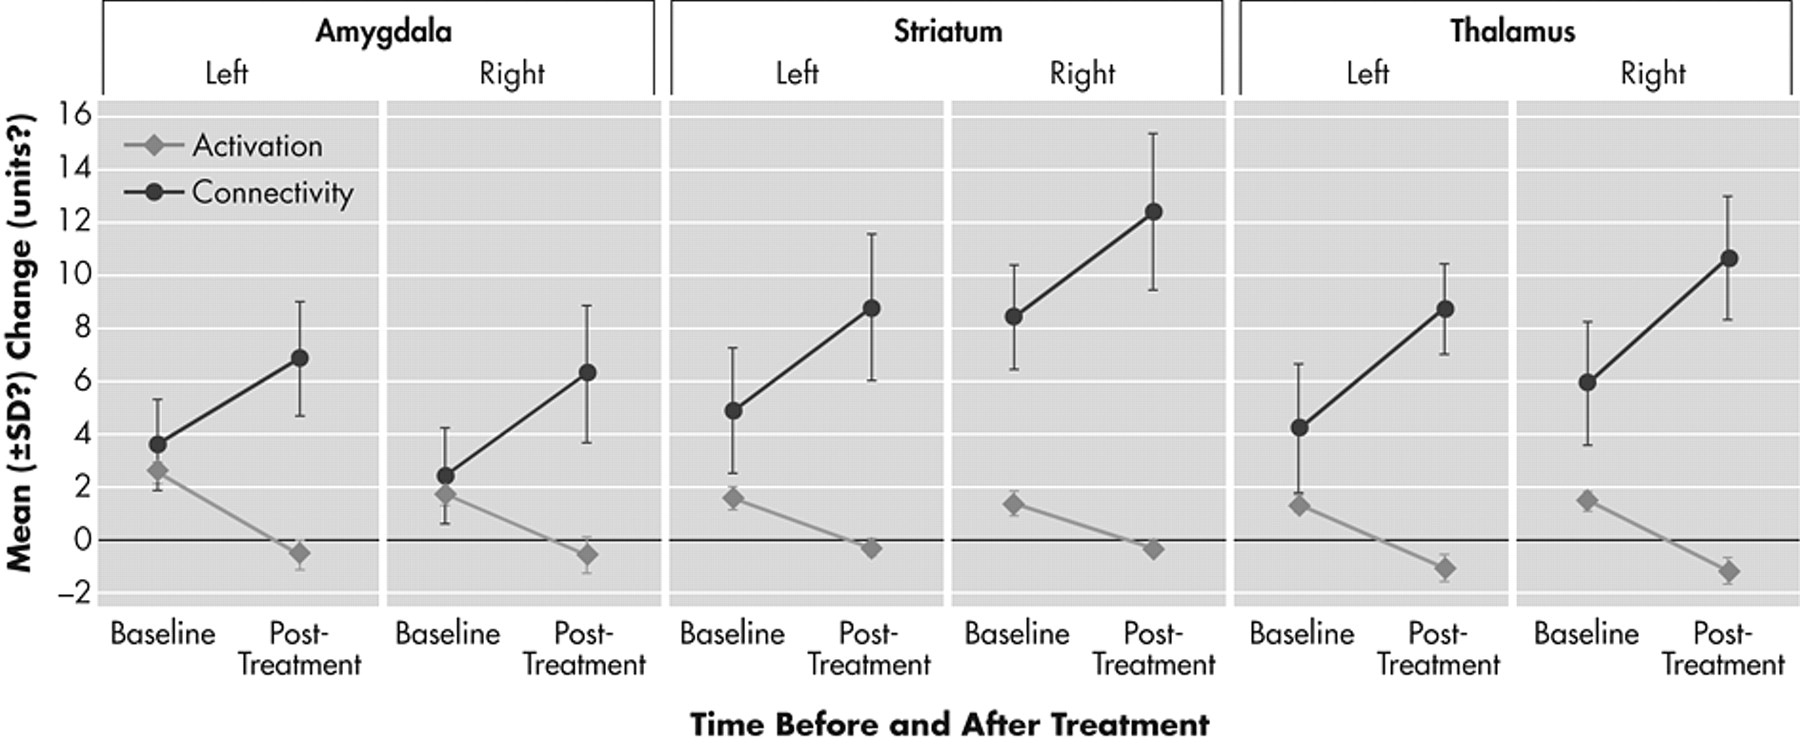
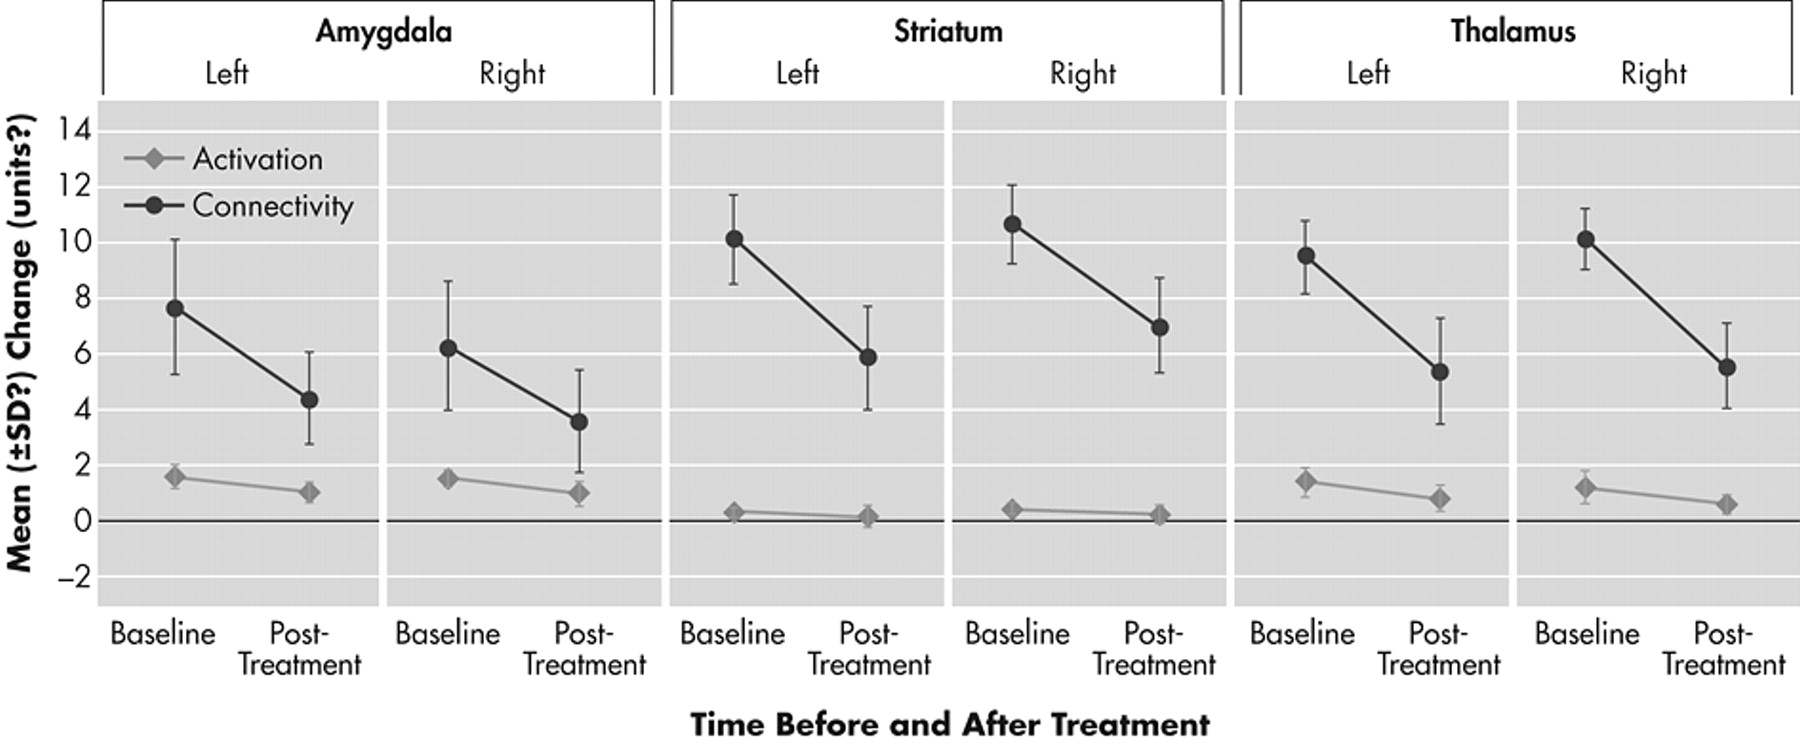
11Treatment Effect on Regional Brain Activation in Response to Emotionally Valenced Pictures
Depressed patients after treatment compared to depressed patients before treatment had significant decreases in activation of the limbic regions of the mood-regulating circuit that were a priori designated as ROIs. Percent signal change for the negative versus neutral picture blocks decreased after treatment in the a priori-defined regions of interest. Healthy subjects exhibited a only a small decrease in activation in the repeat scan (
Figures 2 and
3 ).
A group by time-repeated measures ANOVA interaction for percent signal change after treatment was significant for the following a priori-defined regions of interest: left amygdala (df=1, 21; F=5.98, p=0.03) (
Figure 3 ) and left pallidostriatum (df=1, 21; F=5.14, p=0.04), while there was a trend for significance for right pallidostriatum (p=0.07), left medial thalamus (p=0.08) and right medial thalamus (p=0.06).
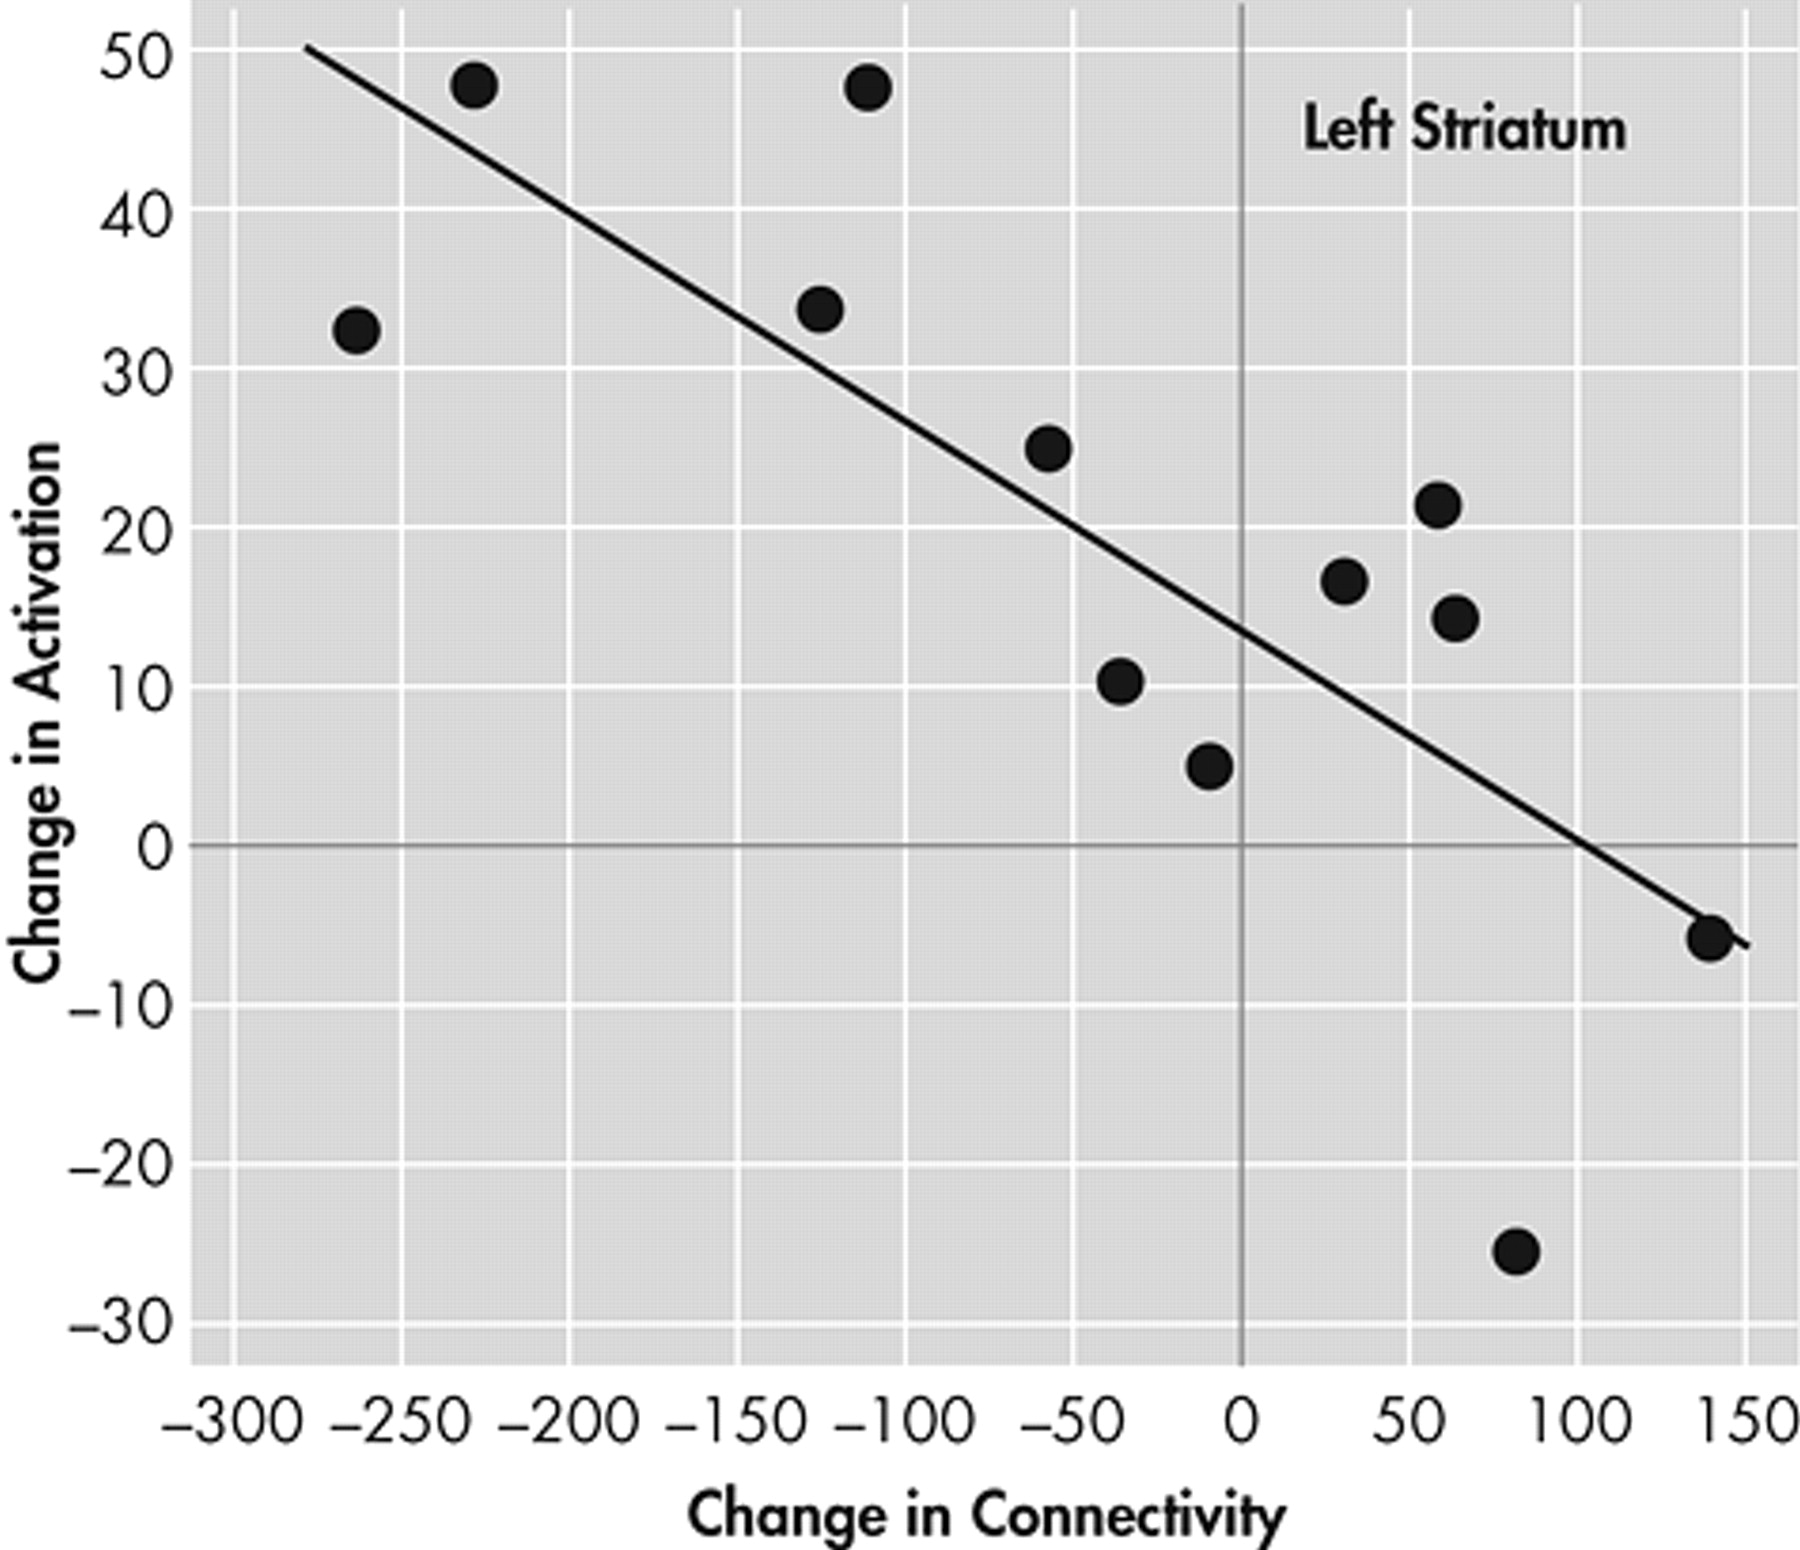
The relationship between changes in activation and connectivity between the ACC and each of the three limbic regions—amygdala, pallidostriatum, and medial thalamus—is depicted in
Figures 1 and
2 . The overall trend was for antidepressant treatment to decrease limbic activation and increase corticolimbic connectivity. The relationships between changes in activation and connectivity measures after treatment are depicted in
Figures 2 and
3 .
Next, we examined the correlation between the change in connectivity with pregenual ACC and activation for each of the three limbic areas on each side. A significant negative correlation was found only for the left ventral striatum (r=0.61, p<0.003) (
Figure 4 ).
DISCUSSION
The results of this study indicate a reciprocal relationship between antidepressant-induced changes in resting state corticolimbic functional connectivity and limbic activation in response to negative versus neutral stimuli. The increase in phase coherence between LFBF in the ACC and the limbic regions—medial thalamus, pallidostriatum, and amygdala—may be associated with increased regulation of the cortical mood-regulating regions over the mood-regulating limbic regions. In support of this hypothesis, limbic regions after treatment showed a decrease in activation and an increase in connectivityn with the ACC. For the left pallidostriatum this reciprocal relationship was the strongest and achieved statistical significance.
The correlation of LFBF between two areas is a measure of functional connectivity (i.e., that two are in synchrony).
15 However, this could also occur because of the influence of a third factor that may simultaneously affect both areas. In the future, to measure the actual effect of one area over another (i.e., a measure of effective connectivity), LFBF correlation data could inform the analysis using structural equation modeling (SEM)
51 methods or newer techniques such as Dynamic Causal Modeling (DCM)
52 and investigation of structural connectivity using diffusion tensor imaging (DTI).
53The duration of a medication-free period for psychiatric studies always contains a compromise between what is ideal and what is clinically feasible. We chose a 2-week period minimum for patients to be off medication as the usual half-life of most antidepressants is 12 to 24 hours, and therefore most antidepressants (except fluoxetine for which we required a 4-week medication-free period) should be washed off within a week. Another week would make sure that all the residual effects of the medication are accounted for. However, long-term effects of antidepressants may still linger. Future studies could be conducted to address this issue with a larger number of subjects using subjects’ previous medication status as a covariate in the analysis.
For both activation and connectivity there was a decrease in the repeat testing in healthy subjects, which was probably a test-retest effect. These results underlie the importance of studying healthy subjects at the same time points as the patients before and after treatment and the treatment effect analyzed as the difference between the time points using a two-way repeated measures ANOVA (diagnosis × time). Other studies have also used this strategy to examine treatment effects using fMRI.
12,
13 Another reason for the decrease appeared to be the small number of subjects studied in which individual subject results can have an inordinate effect on the mean. In the future, this type of study will be conducted with a larger number of subjects and with an improved methodology of image acquisition (e.g., better signal acquisition from basal regions of the brain, such as the amygdala) to decrease the variance in the data.
This study was limited by the small number of subjects studied for the number of variables analyzed. The reciprocal relationship between connectivity and regional limbic activation changes was seen with all three a priori-defined limbic ROIs, but the negative correlation reached statistical significance only for the left striatum. This could be a function of the small number of subjects that were studied, and future studies should include larger numbers of subjects to further confirm these findings.
This study was not able to differentiate between the acute effects of the antidepressants and the more long-term antidepressant effects as data were acquired only after 6 weeks of treatment. Another limitation of the study was the open label design, making it difficult to differentiate between the active versus placebo effects of antidepressant treatment. Ten out of 12 patients responded to treatment; therefore, a comparison between responders and nonresponders was not feasible. Finally, the ventral areas of the brain, such as the amygdala, are characterized by a lower signal-to-noise ratio than from cortical areas because of susceptibility artifacts. To control for these limitations, the findings of this study will need to be further validated with better design, for example, with a randomized, placebo controlled arm; better stimulus presentation with random order and collection of behavioral ratings; and better image acquisition methodology, such as techniques to obtain a better signal from the ventral areas of the brain.
Acknowledgments
This study was supported by Indiana University 21st Century Fund and INGEN fund. The first author has received travel funds and honorarium from Pfizer Inc., U.S. Pharmaceuticals Group for consultation and presentations. The results of this study were previously presented in part at the Meeting of Society of Biological Psychiatry and American Psychiatric Association Meeting, San Francisco, Calif., 2003, and at the Human Brain Mapping Meeting, New York, NY, 2003.